http://dx.doi.org/10.4236/opj.2013.37A004
Dynamic Analysis of Mental Sweating by the
Time-Sequential Piled-Up En-Face OCT Images
Masato Ohmi, Yuki Wada, Motomu Tanigawa
Division of Health Sciences, Graduate School of Medicine, Osaka University, Suita City, Japan Email: [email protected]
Received July 26, 2013; revised August 25, 2013; accepted September 23, 2013
Copyright © 2013 Masato Ohmi et al. This is an open access article distributed under the Creative Commons Attribution License, which permits unrestricted use, distribution, and reproduction in any medium, provided the original work is properly cited.
ABSTRACT
In this paper, the dynamic analysis of mental sweating for sound stimulus of a few tens of eccrine sweat glands is per- formed by the time-sequential piled-up en-face optical coherence tomography (OCT) images with the frame spacing of 3.3 sec. In the experiment, the amount of excess sweat can be evaluated simultaneously for a few tens of sweat glands by piling up of all the en-face OCT images. Strong non-uniformity is observed in mental sweating where the amount of sweat in response to sound stimulus is different for each sweat gland. Furthermore, the amount of sweat is significantly increased in proportion to the strength of the stimulus.
Keywords: Optical Coherence Tomography; En-Face OCT Images; Mental Sweating; Sweat Gland; Sympathetic Nerve
1. Introduction
Optical coherence tomography (OCT) enables cross sec- tional imaging of tissues in vivo with micron scale reso- lution, and now used for clinical diagnoses of retina dis- eases in ophthalmology and arteriosclerosis in circulatory medicine [1-3]. Besides the clinical applications, OCT was applied for brain science, in which the nerve re- sponse was detected by the OCT signals [4]. Recently, we demonstrated the dynamic OCT of skin physiology including the dynamics of sweat glands and peripheral vessels was tracked by time-sequential OCT images [5-7]. We discussed in detail mental sweating where mental or physical stress was applied to a subject to accelerate ex- cess sweating. When a sound stress was used, we found internal mental sweating without ejection of excess sweat to the skin surface for evaluation of the nerve activity [8]. In our previous work, the dynamic OCT analysis of mental sweating of a single eccrine sweat gland was made using the time-domain OCT (TD-OCT) [5,8]. A lot of eccrine sweat glands align along the hill of fingerprint on human fingertips with the density of several hundred glands in cm2. Therefore, the 3-D image construction method with the so-called maximum intensity projection (MIP) of B-mode OCT images is proposed for in vivo
dynamic analysis of mental sweating [9]. By use of the fast speed swept-source OCT (SS-OCT), we demonstrate
the dynamic OCT possible for a few tens of eccrine sweat glands. In this paper, the dynamic analysis of men- tal sweating for sound stimulus of a few tens of eccrine sweat glands is performed by the time-sequential piled- up en-face OCT images with the frame spacing of 3.3 sec.
2. Materials and Methods
x
z y
400m
(a) (b)
x
zy
400m
2.0mm
1.
6m
m
400m
x
y
A1, A2, A3, A4, A5 B1, B2, B3, B4, B5 C1, C2, C3, C4, C5 D1, D2, D3
[image:2.595.67.283.86.343.2](c)
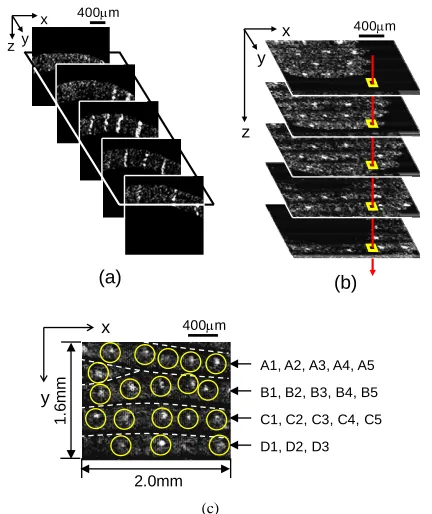
Figure 1. Image construction of en-face OCT. (a) 128 OCT images in the x-z plane are obtained with a spacing of 12.5 mm along the y direction; (b) The en-face OCT images in the x-y plane are extracted with the slice spacing of 5.9 mm, (c) Piled-up en-face OCT image of where nineteen eccrine sweat glands were imaged in the area of 2.0 × 1.6 mm2.
ing of the time-sequential piled-up en-face OCT images. From the 128 B-mode OCT images, the en-face OCT images in the x-y plane are extracted with the slice spac- ing of 5.9 mm, as shown in Figure 1(b), where the num- ber of en-face OCT images is 100 or more in epidermis. In the en-face OCT, the pixel size is 12.5 mm which is a proper image resolution for clear imaging of the spiral lumen of eccrine sweat glands. All en-face OCT images along the spiral lumen in stratum corneum of epidermis are piled up to evaluate the amount of excess sweat. In the resulting piled-up en-face OCT image, as shown in
Figure 1(c), the amount of excess sweat can be evaluated simultaneously for seventeen eccrine sweat glands which align along four lines of the fingerprint on a human fin- gertip.
3. Experimental Results
3.1. Simultaneous Tracking of Mental Sweating of a Few Tens of Sweat Glands by Dynamic OCT
The dynamic OCT analysis was made for mental sweat- ing of a group of eccrine sweat glands in the area of 2.0 × 1.6 mm2 on the middle-finger tip, where a subject was a 23-year-old male. In the experiment, after confirmation of the resting state of the subject, mental stress is applied
to the volunteer where the stress is unpleasant sound of breaking glass for 0.5 sec at a sound level of 90 dB. Fig- ure 2 show time-sequential piled-up enface OCT images with the frame spacing of 3.3 sec. In the sweat glands, marked by a yellow circle, the reflection light intensity increases suddenly in response to the sound stress.
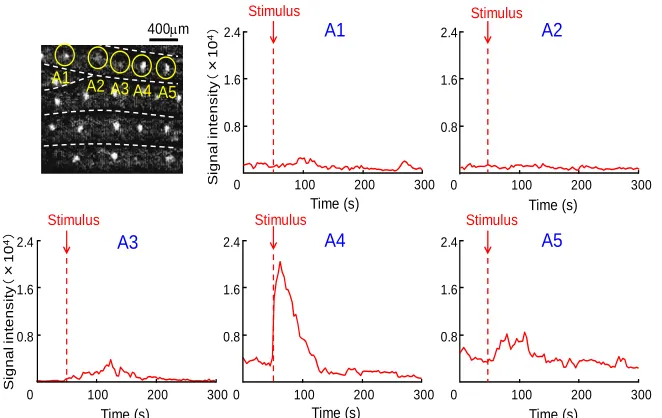
The nineteen sweat glands are also classified by four lines of the fingerprint. Figure 3 shows time variation of the reflection light intensity for the sweat glands from A1 to A5. In our previous study, an instantaneous amount of sweat stored in the sweat glands can be evaluated quan- titatively by summation of the reflection light intensity of all pixels included in the spiral lumen [8]. These five sweat glands are active, but there is large difference in the amount of the stored sweat in the spiral lumen. It is thus found that the response to mental stress is different for each sweat gland even though the sweat glands are aligned to each other. Furthermore, Figure 4 shows the time integrated value of the reflection light intensity dur- ing the experiment indicated by the red bars. These val- ues are corresponding to the total excess sweat. From these results, strong non-uniformity is observed in mental sweating where the amount of excess sweat in response to sound stress is different for each sweat gland.
3.2. Influence of the Experience of the Sound Stimulus
In the next experiment, we consider the influence of the experience of the sound stimulus. The dynamic analysis for mental seating of sweat glands was performed for two times using the same experimental protocol of Figure 2, where a subject was a 23-year-old male. In this experi- ment, the sweating dynamics of sixteen eccrine sweat glands were measured simultaneously. Figure 5 show the time variation of the total reflection light intensity by application of the sound stimulus of the first and second times. There is almost same in the response to the sound stimulus. In addition, the time integrated value of the reflection light intensity is indicated by the red and the pink bars in Figure 6. The values corresponding to the total excess sweat are almost equal. These results suggest that there is no influence of the experience of the sound
50 s 62.7 s 138.6 s
400m
・ ・ ・ ・
・ ・
Sound stimulus Sound stimulus(90dB)
50
start end
100
Time(s) 300
0
0 s Resting state
[image:2.595.309.536.608.710.2]2.4
1.6
0.8
0 100 200 300
S ig nal int e ns ity (× 10 4) Time (s) 2.4 1.6 0.8
0 100 200 300
2.4
1.6
0.8
0 100 200 300
400m A1 A2
A3 A4 A5
A1
A2 A3 A4 A5
Stimulus Stimulus Stimulus Stimulus Stimulus 2.4 1.6 0.8
0 100 200 300 2.4
1.6
0.8
0 100 200 300
[image:3.595.134.465.89.298.2]Time (s) Time (s) Time (s) Time (s) S ig nal int e ns it y (× 10 4)
Figure 3. Time variation of the reflection light intensity of the sweat glands, corresponding to the amount of excess sweat in response to the sound stress.
stimulus to the subject.
3.0
1.5
0
A1 A2 A3 A4 A5 B1 B2 B3 B4B5 C1 C2 C3 C4 C5 D1 D2 D3 01 A1, A2, A3, A4, A5
B1, B2, B3, B4, B5
C1, C2, C3, C4, C5
D1, D2, D3 01
400m
T im e i nt egr at e d v a lue of t he re fl e c ti on light int ens it y (× 10 6) Sweat gland
3.3. Variation of the Amount of Mental Sweat for the Different Sound Stimulus
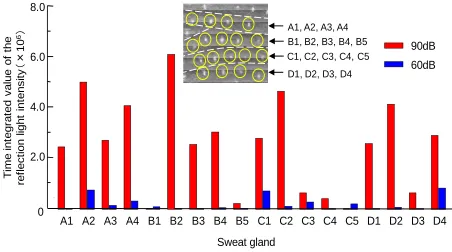
[image:3.595.59.288.346.476.2]Finally, we consider the variation of the amount of sweat for different sound levels. The dynamic analysis for men- tal seating of sweat glands was performed two times, where the first stimulus of sound level was 90 dB and the second sound stimulus was 60 dB. Figure 7 show the time variation of the total reflection light intensity. There is large difference of time variation of the reflection light intensity of the sweat glands between 90 dB and 60 dB of the sound stimulus. The time integrated value of the re- flection light intensity is also indicated by the red and the blue bars in Figure 8. The values corresponding to the total excess sweat are significantly increased in propor- tion to the sound levels. This result indicates that the ac- tivity of the symphathetic nerve is proportional to the strength of the sound stimulus.
Figure 4. Time integrated values of the reflection light in- tensity, corresponding to the total amount of excess sweat.
S igna l in ten s it y (× 10
4) 3.0
2.0 1.0 0 3.0 2.0 1.0 0 3.0 2.0 1.0 3.0 2.0 1.0
100 200 300
Time (s)
A3
C2 D4
B3 First Second
100 200 300
0 100 200 300 0 100 200 300
Stimulus Stimulus
4. Discussion and Conclusions
We have demonstrated the dynamic OCT analysis of mental sweating of sweat glands on a human fingertip. We have proposed a novel method for evaluation of the amount of excess sweat in response to stress, where the en-face OCT images of the sweat gland are constructed by the 128 B-mode OCT images. Amount of sweat can be evaluated simultaneously for a few tens of sweat glands by piling up of all the en-face OCT images. The dynamic analysis of mental sweating is performed by the time-sequential en-face OCT images with the frame spacing of 3.3 sec.
S ig n a l in te nsit y (× 10 4) Time (s)
Time (s) Time (s)
[image:3.595.60.285.521.701.2]T im e in te gr a te d v a lue of t h e re fl ec ti on li ght in te ns it y (× 10 6)
A1 A2 A3 A4 B1 B2 B3 C1 C2 C3 C4 C5 D1 D2 D3 D4 0 First Second 0.3 0.6 0.9 1.2 1.5
A1, A2, A3, A4
B1, B2, B3
C1, C2, C3, C4, C5
D1, D2, D3, D4
[image:4.595.59.286.77.230.2]Sweat gland
Figure 6. Time integrated values of amount of sweat stimu- lated by application of the sound stimulus of first and sec- ond times. 3.0 2.0 1.0 0 3.0 2.0 1.0 0 100 200 300
Time (s)
100 200 300
A2 Stimulus B2
Stimulus 90dB 60dB Time (s) 3.0 2.0 1.0
0 100 200 300
C2 Stimulus Time (s) 3.0 2.0 1.0
0 100 200 300
[image:4.595.60.288.286.467.2]D2 Stimulus 1 0 4) X 1 0 Time (s) S ign al in te n s it y ( X S ign al int e n s it y ( 4)
Figure 7. Time variation of the reflection light intensity by application of the sound stimulus of 90 dB and 60 dB.
A1 A2 A3 A4 B1 B2 B3 B4 B5 C1 C2 C3 C4 C5 D1 D2 D3 D4 0 2.0 4.0 6.0 8.0 90dB 60dB
A1, A2, A3, A4 B1, B2, B3, B4, B5 C1, C2, C3, C4, C5 D1, D2, D3, D4
Sweat gland T im e int egr at ed v alue of t he re fl ec ti on light in tens it y (× 10 6)
Figure 8. Time integrated values of amount of sweat stimu- lated by application of the sound stimulus of 90 dB and 60 dB.
From our experimental results, there are some inter- esting results of mental sweating in sweat glands on a human fingertip. 1) Strong non-uniformity is observed in mental sweating where the amount of excess sweat in
response to sound stress is different for each sweat gland. The non-uniformity may be necessary to adjust as pre- cisely the total amount of excess sweat as possible through the sympathetic nerve in response to strength of the stress. 2) There is no influence of the experience of the sound stimulus to the volunteer. Our experimental protocol can be used frequently. 3) The amount of excess sweat of eccrine sweat glands is increased in proportion to the strength of the stimulus. This result suggests that the mental sweating varies quantitatively according to the stimulus.
5. Acknowledgements
This research was partially supported by Grant-in-Aid for Scientific Research (C) (25350528) from the Japan Soci- ety for the Promotion of Science (JSPS) and Industrial Technology Research Grant Program from New Energy and Industrial Technology Development Organization (NEDO) of Japan.
REFERENCES
[1] D. Huang, E. A. Swanson, C. P. Lin, J. S. Schuman, W. G. Stinson, W. Chang, M. R. Hee, T. Flotte, K. Gregory, C. A. Puliafito and J. G. Fujimoto, “Optical Coherence To- mography,” Science, Vol. 254, No. 5035, 1991, pp. 1178- 1181. http://dx.doi.org/10.1126/science.1957169
[2] E. A. Swanson, J. A. Izatt, M. R. Hee, D. Huang, C. P. Lin, J. S. Schuman, C. A. Puliafito and J. G. Fujimoto, “In-Vivo Retinal Imaging by Optical Coherence Tomo- graphy,” Optics Letters, Vol. 18, No. 21, 1993, pp. 1864- 1866. http://dx.doi.org/10.1364/OL.18.001864
[3] G. J. Tearney, M. E. Brezinski, B. E. Bouma, S. A. Bop- part, C. Ptiris, J. F. Southern and J. G. Fujimoto, “In Vivo
Endoscopic Optical Biopsy with Optical Coherence To- mography,” Science, Vol. 276, No. 5321, 1997, pp. 2037- 2039. http://dx.doi.org/10.1126/science.276.5321.2037
[4] R. Uma Maheswari, H. Takaoka, R. Homma, H. Kadono and M. Tanifuji, “Implementation of Optical Coherence Tomography (OCT) in Visualization of Functional Struc- tures of Cat Visual Cortex,” Optics Communications,Vol. 202, No. 1-3, 2002, pp. 47-54.
http://dx.doi.org/10.1016/S0030-4018(02)01079-9 [5] M. Ohmi, K. Nohara, Y. Ueda, T. Fuji and M. Haruna,
“Dynamic Observation of Sweat Glands of Human Finger Tip Using All-Optical-Fiber High-Speed Optical Coher- ence Tomography,” Japanese Journal of Applied Physics, Vol. 44, No. 26, 2005, pp. L854-L856.
http://dx.doi.org/10.1143/JJAP.44.L854
[6] M. Haruna, T. Fuji, M. Ohmi and N. Hayashi, “In Vivo
Dynamic Imaging of Arterioles of Human Fingers Using Optical Coherence Tomography at 1.3 mm,” Japanese Journal of Applied Physics, Vol. 45, No. 33, 2006, pp. L891-L893. http://dx.doi.org/10.1143/JJAP.45.L891
[image:4.595.58.284.514.640.2]and Veins of Human Fingers,” Applied Physics Express, Vol. 1, No. 5, 2008, Article ID: 058001.
http://dx.doi.org/10.1143/APEX.1.058001
[8] M. Ohmi, M. Tanigawa, A. Yamada, Y. Ueda and M. Haruna: “Dynamic Analysis of Internal and External Mental Sweating by Optical Coherence Tomography,”
Journal of Biomedical Optics, Vol. 14, No. 1, 2009, Arti-
cle ID: 014026. http://dx.doi.org/10.1117/1.3079808 [9] H. Saigusa, Y. Ueda, A. Yamada, M. Ohmi, M. Ohnishi,