Munich Personal RePEc Archive
Iowa’s Tax Incentive Programs Used by
Biofuel Producers Tax Credits Program
Evaluation Study
Jin, Zhong and Teahan, Brittany
The Iowa Department of Revenue
31 March 2009
Online at
https://mpra.ub.uni-muenchen.de/14795/
Iowa’s Tax Incentive Programs Used by Biofuel Producers
Tax Credits Program Evaluation Study
March 2009
By Zhong Jin Brittany Teahan
Preface
During the 2005 Legislative Session the Iowa Department of Revenue received an appropriation to establish the Tax Credits Tracking and Analysis Program to track tax credit awards and claims. In addition, the Department was directed to perform periodic evaluations of tax credit programs. The evaluation of the State’s Tax Incentive Programs Used by Biofuel Producers represents the fourth of these studies.
As part of the evaluation, an advisory committee was convened to provide input and advice on the study’s scope and analysis. We wish to thank the members of the panel: Dr. Dan Otto of Iowa State University, Lihong Lu McPhail of Iowa State University, Monte Shaw of the Iowa Renewable Fuels Association, Dawn Carlson of the Petroleum Marketers and Convenience Stores of Iowa, Tim Johnson of the Iowa Farm Bureau Federation, Lane Palmer and Amy Johnson from the Iowa Department of Economic Development, and Dale Thede of the Iowa Department of Revenue. The assistance of an advisory committee implies no responsibility on members for the final product. The Department would also like to thank Dr. Chad Hart of Iowa State University for helpful comments on the economic analysis section of the study.
This study and other evaluations of Iowa tax credits can be found on the Tax Credits Tracking and Analysis Program Web page on the Iowa Department of Revenue Web site located at:
1
Table of Contents
Executive Summary... 3
Comments from the Tax Credits Evaluation Study Advisory Committee Meeting... 5
I. Introduction... 6
A. Ethanol Industry Background... 6
B. Biodiesel Industry Background ... 7
C. Ethanol Production Process ... 7
D. Biodiesel Production Process... 9
E. Transportation Implications... 9
II. Iowa Tax Incentive Programs Used by Biofuel Producers... 9
A. Tax Incentive Program Requirements... 10
B. Tax Incentive Program Benefits... 11
C. Tax Credit Claim Provisions ... 11
III. Biofuel Producers Tax Credits Across the U.S... 11
IV. Literature Review ... 13
V. Motivation for Public Support of Biofuel Production ... 14
VI. Biofuel Production in Iowa and Neighboring States ... 15
VII. Biofuel Producers Tax Credit Awards ... 15
VIII. Biofuel Producers Tax Credit Claims ... 16
A. Sales and Use Tax Refund Claims ... 16
B. Investment Tax Credit Claims... 16
IX. Ownership Structure of Biofuel Production Facilities ... 17
X. Beneficiaries of the Biofuel Industry in Iowa ... 17
A. The Farm Sector ... 18
B. Direct Employment ... 19
C. Local Communities... 20
D. Local Communities: Impact on Retail Sales... 22
XI. Future of the Biofuel Industry in Iowa ... 23
XII. Conclusion ... 23
References ... 25
Tables and Figures... 29
Figure 1. U.S. and Iowa Ethanol Production Capacity... 30
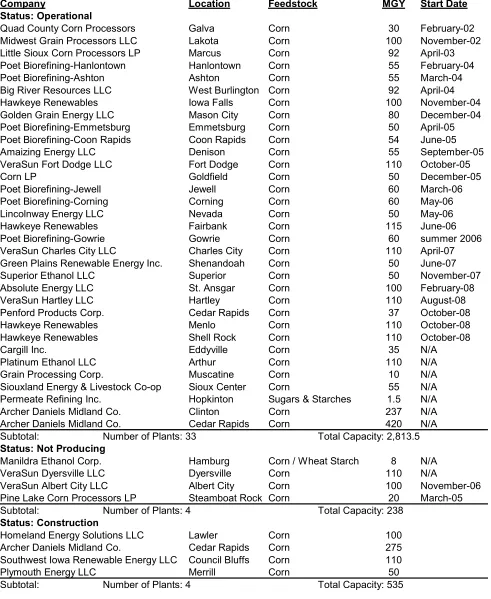
Table 1. Iowa Ethanol Plants ... 31
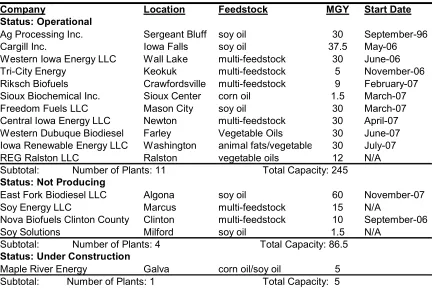
Table 2. Iowa Biodiesel Plants... 32
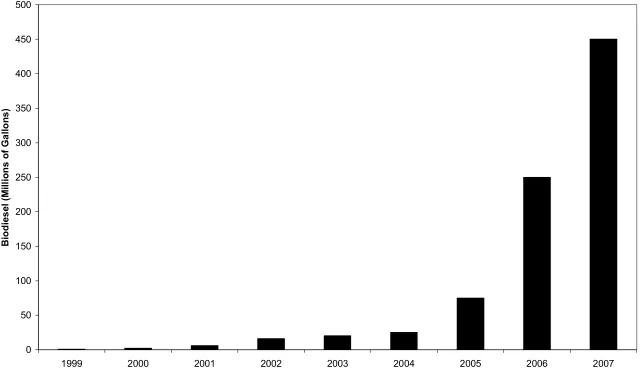
Figure 2. U.S. Biodiesel Production Capacity... 33
Figure 3. Biofuel Production Facilities and Railroads in Iowa ... 34
Figure 4. Quintiles of 2007 Iowa Corn Production by County ... 35
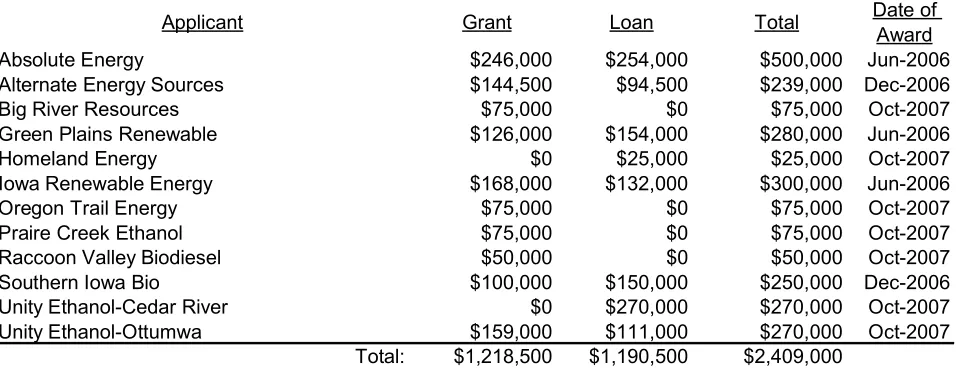
Table 3. Railroad Revolving Loan and Grant Program Awards to Biofuel Producers ... 36
Table 4. Tax Incentive Program Requirements ... 37
Figure 5. Iowa Counties and Cities with Certified Enterprise Zones) ... 38
Table 5. Tax Incentive Program Benefits ... 39
Table 6. HQJCP Capital Investment and Job Creation Program Requirements and Benefits ... 40
Table 7. Summary of Biofuel Production Tax Credits and Incentives by State ... 41
Table 8. Biofuel Investment Tax Credits by State... 42
Table 9. Biofuel Production Tax Credits by State... 43
Table 10. Ethanol Production by State... 44
Table 11. General Investment Tax Credits by Top Ethanol Producing States ... 45
Figure 6. Ethanol Production Capacity and Corn Production by State... 46
Table 12. Biodiesel Production by State ... 47
Table 13. Biofuel Producers Funding Sources ... 48
Table 14. Biofuel Producers Tax Credit Awards by Program... 49
2
Table 16. Sales and Use Tax Refunds by Biodiesel Producers... 50
Table 17. 2006 Investment Tax Credit Claims by Program ... 50
Figure 7. Illustration of Ownership Structure of a Multi-layered Pass-through Entity ... 51
Table 18. Ownership Statistics for Biofuel Producers Organized as a Limited Liability Company... 52
Figure 8.Location of Iowa Residential Investors in Western Dubuque Biodiesel Investors ... 53
Table 19: Estimate of the Reduced Ethanol Production Capacity’s Impact on Corn Price... 54
Table 20: Estimate of the Reduced Corn Price’s Impact on Land Rents and Land Value... 54
Table 21: Corn Farming Output and Input Costs... 55
Figure 9. Seed, Fertilizer and Chemical Expenses for Corn and Soybean Farmers 2002 to 2007 . 56 Figure 10. Selected Expenses for Cattle Farmers 2002 to 2007 ... 57
Figure 11. Dry Mill Ethanol Industry Direct Employment ... 58
Figure 12. Biodiesel Industry Direct Employment... 59
Table 22. Median Real Household Income in Iowa and Treatment Towns... 60
Table 23. Treatment Towns and Selected Control Towns... 60
Figure 13. Map of Selected Towns ... 61
Table 24. Summary Statistics Treatment vs. Control Group at Individual Level in 2003... 62
Table 25. Summary Statistics Treatment vs. Control Group at Town Level in 2003 ... 62
Table 26. Explaining Variation in Real Household Income Between 2003 and 2006... 63
Table 27. Explaining Variation In Real Household Income Between 2003 and 2006... 64
Table 28. Businesses by Category... 65
Table 29. Explaining Variation in Retail Sales at the Town Level across Control and Treatment Groups between 2003 and 2006... 66
Figure 14. Map of Change in Retail Sales by County ... 67
Appendix A Notes on Tax Treatment by Ownership Structure ... 68
Appendix B Technical Report of the Economic Analysis on Corn Price... 69
First Stage: Estimate the Tax Credits’ Impacts on Investments and Nameplate Capacity ... 69
Second Stage: Estimate the Production Capacity’s Impacts on the Corn Price... 71
Land Rent and Land Value ... 74
Table B1. Publicly Listed Corn-Based Ethanol Producers in U.S. ... 75
Table B2. Regression Testing the Adjusted-q Model... 75
Table B3. Estimated Affected Nameplate Capacity (Million Gallons per Year ... 76
Table B4. Estimated Operating Profit Margin for Ethanol Producers ... 76
Table B5. Corn Supply and Demand from 2004 to 2007 (million Bushel) ... 76
3 Executive Summary
Iowa offers several tax incentive programs that have been utilized by biofuel producers. The tax credit programs include the Enterprise Zone Program (EZ), the New Jobs and Income Program (NJIP), the New Capital Investment Program (NCIP), and the High Quality Job Creation Program (HQJCP). The NJIP and NCIP were replaced by HQJCP on July 1, 2005, but claims under NJIP and NCIP contracts can still be made. The EZ, NJIP, and HQJCP allow biofuel producers to claim a ten percent Investment Tax Credit. The NCIP provides a five percent Investment Tax Credit. All four programs offer a sales and use tax refund and a supplemental Research Activities Tax Credit. The EZ and NJIP also provide a supplemental Iowa Industrial New Job Training Program (260E) withholding tax credit. All four programs were not established specifically to support the biofuel industry but rather to help the State of Iowa promote general business investments.
The major findings of the study are:
Tax Incentives for Biofuel Producers Across the United States
• Most states, including Iowa, have general Investment Tax Credits aimed at promoting business investments, including investment in the biofuels industry.
• Twelve states, including South Dakota and Nebraska, have specific investment programs to promote investments in biofuel plants in their states. Iowa does not have such programs.
• Twenty-three states, including South Dakota, Minnesota, Nebraska, and Missouri, provide
programs to biofuel producers based on their actual output of ethanol or biodiesel. Iowa does not have such programs.
Biofuel Production in Iowa and Neighboring States
• Ethanol production is heavily concentrated in the Midwest. Iowa is the leading ethanol producer in the nation in terms of production capacity accounting for nearly 3 billion gallons per year or 24.9 percent of U.S. nameplate capacity1.
• Iowa is second to Texas in terms of biodiesel production capacity with 245 million gallons per year (MGY), or 10.1 percent of U.S. production capacity.
Biofuel Producers’ Tax Credit Awards and Claims
• More than $405 million in tax credits have been awarded to 55 ethanol projects through December 2008. The majority of the tax credits, $274 million, have been awarded under the EZ and HQJCP programs. Ethanol projects account for 54.8 percent of all tax credits awarded through the Iowa Department of Economic Development Business Job Creation programs.
• More than $43 million in tax credits have been awarded to 16 biodiesel projects through December 2008. Likewise, the majority of the tax credits have been awarded under EZ and HQJCP.
Biodiesel projects account for 5.8 percent of all tax credits awarded through the Iowa Department of Economic Development Business Job Creation programs.
• The amount of credits claimed thus far is less than the amount awarded. In 2006, nearly $4 million in Investment Tax Credits were claimed by biofuel producers, mostly through NJIP.
1Nameplate capacity refers to the minimum production rate an owner or operator should expect. Many plants
4
• For sales and use tax refunds, $3.8 million was claimed by ethanol producers between 2003 and 2008. Biodiesel producers claimed $1.7 million in sales and use tax refunds between 2006 and 2008.
Ownership Structure
• Sixty-one companies have invested in 71 biofuel production projects that have been awarded State tax credits in Iowa through July 1, 2008. 51 of the 71 projects are owned by pass-through entities.
• Of the 28 biofuel project owners set up as pass-through entities, for which data is available, nearly 90 percent of the investors are Iowa residents. More than 80 percent of the shares are owned by individual Iowa investors. Iowans with farm income own approximately one-third of all shares.
Evaluating Beneficiaries of Biofuel Producers’ Tax Incentives
• A 50 MGY ethanol plant employs an average of 38 workers while a 100 MGY plant employs an average of 52 workers. Employees earn an average annual salary of approximately $52,000.
• State tax credits may have induced as much as 25 percent of Iowa’s ethanol production capacity.
• A portion of the increase in corn prices experienced in recent years (3 cents in 2005, 9 cents in 2006, and 17 cents in 2007) can be attributed to increased ethanol production capacity induced by tax credits. This increase in the price of corn led to an increase in farm income at the state level of $64.9 million in 2005, $184.5 million in 2006, and $402.4 million in 2007, while the value of corn produced in Iowa was $6.8 billion in 2006 and $10.7 billion in 2007.
• It is estimated that increased ethanol production capacity increased the average farmland prices by $66.57 (2.3 percent) in 2005, $136.73 (4.3 percent) in 2006, and $253.4 (6.5 percent) in 2007. This translates into total agricultural land value increases of $2.1 billion, $4.3 billion, and $8.0 billion over the same periods.
• At the same time, increased corn demand has led to increased farming input costs. The average farmland rent increase due to the tax credits was $2.37 per acre in 2005, $7.11 per acre in 2006, and $13.43 per acre in 2007.
• It is estimated that the operation of an ethanol plant in a town increases the average real
household income of its residents by $822. There does not appear to be a very strong correlation between counties that had an ethanol plant constructed between 2003 and 2006 and change in retail sales.
Future of Biofuels
• Second generation feedstocks are expected to supplement grain in the future. However,
5
Comments from the Tax Credits Evaluation Study Advisory Committee Meeting Monday, March 16, 2009, 10:00-11:30 am
The following is a summary of several issues raised by advisory committee members regarding the final draft of the Iowa’s Tax Incentive Programs Used by Biofuel Producers Tax Credits Evaluation Study.
Committee members offered additional insight into the current situation of the biofuels industry. Due to unfavorable economic and market conditions several plants across the U.S. and a few plants in Iowa have been forced to shut down while many others are producing well below potential output capacity. The Iowa Renewable Fuels Association (IRFA) estimates that 400 million of Iowa’s 3 billion gallons of ethanol production capacity, 13.3 percent, is currently off-line. The situation is worse in the biodiesel industry with 200 million gallons of Iowa’s 315 million gallons of biodiesel capacity, 63.5 percent, estimated to be off-line. However, the IRFA notes that some plants will produce biodiesel intermittently based on orders. IRFA does not know of any biofuel projects that plan to begin
construction this year. Further, some projects have suspended construction due to market conditions. The IRFA believes that the current troubles in the industry are only temporary and recalls that in 1995 a drought forced many plants to shut-down but the industry continued to grow and prosper in
subsequent years.
The future of the biofuels industry was also discussed at the meeting. IRFA projects that new feedstocks, such as corn stover, switchgrass and algae, will become economically feasible within eight to ten years. However, IRFA notes that these feedstocks will be an addition, as opposed to a replacement, to traditional feedstocks. Traditional feedstocks will remain prominent in the industry due to continual technological advances that make producing biofuels from these sources more efficient.
The Iowa Farm Bureau was represented at this meeting and agreed with the current situation and future outlook outlined by the IRFA.
6 I. Introduction
The objectives of this study are to evaluate the impact of tax incentive programs encouraging business investment on the development of the biofuels industry in Iowa, to identify the cost of tax credits provided to biofuels producers, to identify those beneficiaries, both direct and indirect, of the tax incentives, and to examine the economic impacts to the beneficiaries. The study begins with a brief look at the history of the biofuels industry and its resource needs. The study then describes the tax incentive programs available to biofuel producers in Iowa and compares these to credits and other incentives available across the country. Next, the analysis moves to award and claim data,
presenting details on the amount of credits awarded and claimed by year and program. The analysis then turns to a discussion of the beneficiaries and economic impacts of biofuel production in Iowa. Finally, there is an evaluation of tax credits and a look ahead to the future of the biofuels industry. A. Ethanol Industry Background
The U.S. ethanol industry has evolved since its start in the 1970s. The industry was originally
dominated by many small, farmer-owned plants peaking at 163 in 1984 (Morris, 2005). Ethanol plants served as a way for farmers to add value to their crops. Oil prices increased sharply from 1978 to 1979, creating demand for ethanol and allowing the product to be competitive in the motor fuel market. By the mid 1980s oil prices had fallen back and in 1990 only 50 ethanol plants remained (RFA, 2008).
During the 1990s and 2000s, demand for ethanol recovered helped by a sustained rise in gasoline prices and the federal renewable fuels mandate.2 The number of operating ethanol plants also increased dramatically from 54 in January 2000 to 182 in January 2009. In response to the high profitability of ethanol plants in 2006, the number of plants under construction and/or expansion more than doubled from 31 in January 2006 to 76 in January 2007 (RFA, 2008).
Ethanol plants have increased in size over the past decade. In 1999 the average ethanol biorefinery across the U.S. had a nameplate capacity of approximately 35 MGY. This number steadily climbed to 55 MGY by mid 2008 (RFA, 2008). Newly constructed ethanol plants are likely to be 100 MGY
biorefineries. Additionally, the average size of new plants constructed in Iowa has increased since 2002 reflecting the national trend.
Ethanol biorefineries are clustered in the corn producing states. Raw corn weighs more than ethanol and its co-products. Consequently, the location of ethanol plants is supply-oriented to reduce
transportation costs. Iowa, as the top corn producing state for the last 14 years, is also the top ethanol producing state. The Iowa ethanol industry experienced a similar explosion in number of plants and in production capacity (see Table 1). As of January 2009, of the 182 producing plants in the U.S., 33 (18.1 percent) are located in Iowa, accounting for 2,814 (24.9 percent) of the 11,273 million gallons per year (MGY) of nameplate capacity (see Figure 1).
In January 2009, four Iowa ethanol plants, with a total capacity of 238 MGY, are currently not
producing (Ethanol Producer Magazine, 2008). Pine Lake Processors in Steamboat Rock was forced to shut down in December to avoid operating losses which the plant attributed to high corn prices on futures contracts written during the summer and a decrease in ethanol prices mirroring the recent decline in gasoline prices (Chicago Tribune, 2008). Due to shrinking profit margins, high corn and energy prices, and the tight credit market, firms are canceling planned projects.
The increased use of ethanol within Iowa mirrors the increase in production. In 1979, 650 Iowa retail gas stations sold gasohol, a gasoline mixed with a minimum of ten percent ethanol, compared with
2 The federal Renewable Fuel Standards mandate that the amount of renewable fuel blended into gasoline
7
2,052 in May 2008 (Iowa Corn Promotion Board, 2008; IDR, 2008). Following Governor Branstad’s 1988 mandate that all State vehicles use ethanol blended fuel, 31 percent of fuel sales contained ethanol. Ethanol blended fuel’s market share surpassed 50 percent in August 2000. As of December 2008, gasohol sales accounted for 75.2 percent of all gasoline sales. The share of gasohol sales in Iowa has been between 70 and 75 percent for the past two years. Despite the substantial demand for ethanol in Iowa, the state exports most of the ethanol it produces.
B. Biodiesel Industry Background
Iowa’s current operating production capacity is 245 MGY (10.1 percent) of the nations’ 2,423 MGY of biodiesel (Biodiesel Producer Magazine, 2008). It is important to note that actual production can substantially differ from the maximum production capacity which is referred to above. In fact, due to unfavorable economic conditions the capacity utilized currently by producers is very low. In the 12 month period beginning October 1, 2006 only 450 million gallons were produced nationally which is less than 20 percent of the total production capacity over these twelve months (National Biodiesel Board, 2008).
As of January 2009, eleven of the 139 (7.9 percent) operating U.S. biodiesel plants are located within the State (see Table 2). Biodiesel plants are scattered throughout the nation as they can use various feedstocks such as oil derived from corn or soybean as well as animal fats and other wastes. The dramatic rise in U.S. biodiesel production mirrors that of U.S. ethanol production as the nation focuses on renewable fuels (see Figure 2).
The average size of biodiesel refineries is much smaller than ethanol refineries. The largest of the producing biodiesel facilities in Iowa is Cargill Inc. in Iowa Falls with a production capacity of 37 MGY (Biodiesel Producer Magazine, 2008). Thirty million gallon capacity plants are the most common size of biodiesel refineries in Iowa. Despite the ability to produce biodiesel from a variety of feedstocks, the majority of Iowa refineries use animal fats due to the high cost of soybean oil. However, plants adjacent to soybean crushing facilities use soybean oil.
The primary market for U.S. biodiesel is currently in Europe where a combination of mandates and primarily diesel fueled automobiles drive demand for the product. Of the 450 million gallons of biodiesel produced in the U.S. in 2007, an estimated 300 million gallons of U.S. biodiesel was exported to Europe (Brasher, 2008). The two-thirds of U.S. biodiesel production that is exported to Europe accounts for 15 to 20 percent of all European biodiesel sales (Brasher, 2008). The U.S. government has established increasing Federal biodiesel usage mandates that will help create domestic demand for biodiesel beginning with 500 million gallons in 2009 and reaching one billion gallons a year by 2012. Further, the European Union launched an investigation into the United States’ “dumping” of biodiesel in Europe in the summer of 2008. As a result of the investigation it is likely that the European Union will impose duties on biodiesel imported from the U.S.
C. Ethanol Production Process
There are two primary ways to produce ethanol, either through a wet mill or dry grind process. There are a few major differences between the two processes. Wet-milling requires more capital and energy and yields more valuable co-products such as oil, corn gluten meal, and corn gluten feed (Bothast, 2004). Dry mill plants have lower capital costs and focus on making profits primarily through the sale of ethanol and the co-product distiller’s dry grains (DDG) (Bothast, 2004). DDGs can be sold to farmers as animal feed, and in addition, captured carbon dioxide can be sold to the beverage industry (Iowa Corn Promotion Board, 2008).
8
mandates that were favorable to biofuels, which assured producers there would be demand for their product. Virtually all of the new plants being constructed today are dry mill plants and subsequently the proportion of dry mill plants continues to increase, surpassing two-thirds of total plants in 2004 (Bothast, 2004). Dry mill plants produce 2.8 gallons of ethanol per bushel of corn compared to 2.6 gallons per bushel for wet mill plants (Bothast, 2004). In recent years, large (100 MGY) dry mill plants have been the dominant type for new construction. Although dry mill plants focus on the sale of ethanol for their revenue, the sale of co-products such as dry and wet distiller’s grain is essential for firm profitability.
The USDA has published guidelines for a community when evaluating the resource requirements needed to operate an ethanol plant. These guidelines encourage potential communities to consider transportation, labor, land, financial resource availability, and the economic and environmental impact the plant will have on the local community before proceeding with the project. Typically, ethanol plants truck in local corn and then export ethanol by rail. Rail access is critical to an ethanol plant’s operations and thus many ethanol plants have received grant money from the Iowa Department of Transportation (IDOT) to construct or improve existing railways (see Figure 3).
Key inputs into the production of corn ethanol include corn and labor. At a dry-mill plant, one bushel of corn can produce 2.8 gallons of ethanol and 18 pounds of DDGS. The amount of corn required per gallon of ethanol produced is invariant to the amount of ethanol being produced. A 100 million gallon a year ethanol plant uses 42.9 million bushels of corn annually (Tiffany and others, 2008). Thus, a producer’s profit margin is highly sensitive to the price of corn. Specifically, if the price of corn
increased by $1 from its June 2008 price of $6.45 per bushel, the breakeven price of ethanol (holding all other input costs constant) would increase 14.2 percent from $2.45 to $2.80 per gallon (Tiffany, 2008). The price of corn increased steadily from $1.75 per bushel in January 2005 to $6.45 per bushel in June 2008 and is expected to remain strong (Tiffany, 2008). In January 2009 with corn futures for March delivery just over four dollars a bushel, profit margins for ethanol plants were still tight (WSJ, 2009).
To put a plant’s demand for corn into perspective consider the amount of corn produced per county in Iowa. In 2007, corn harvested in Iowa counties ranged from 4.2 to 59.3 million bushels with an
average of 23.9 million bushels (see Figure 4). Therefore, on average, a 100 MGY plant will consume almost all of the corn harvested in a two county area. The total amount of corn produced in Iowa in 2007 was 2.37 billion bushels (NASS, 2008). In 2006, some estimates show that if all planned ethanol plants in Iowa were to begin production, in addition to those already producing in the State, Iowa would have to become a corn importer. However, these estimates used all planned projects of which some will never open because a region cannot sustain several plants.
Virtually all Iowa ethanol refineries are dry mill plants that use corn as their feedstock. Other sources of feedstock for ethanol production are being researched to produce advanced biofuels. Researchers hope to transition from grain based feedstocks to cellulosic. Potential sources include miscanthus, switch grass, sugarcane, corn stover, and microbes. Brazil, the world’s second leading ethanol producer, after the United States, uses sugarcane as its feedstock. Second generation feedstocks promise to alleviate the food versus fuel debate as some of these new feedstocks can be grown on less fertile land that is not suitable for growing corn. Additionally, these feedstocks have
9 D. Biodiesel Production Process
Biodiesel can be produced from a variety of feedstocks with soy oil and animal fats being the most common. The single largest factor affecting soy biodiesel production costs is the feedstock which accounts for 88 percent of the cost (Haas, 2006). This strong dependence on the cost of soybeans has negatively affected many producers as soybean prices remain high. High soybean prices result in high variable costs, consequently many firms are operating below production capacity and others have reached or are nearing the point at which they cannot cover variable costs and must shut down. A 30 MGY biodiesel plant uses 58.5 million pounds of degummed soy per year and employs
approximately 27 people at an average hourly wage of $16.70 (Haas, 2006; IDED).
The sellable co-product from the production of biodiesel is glycerol. Glycerol is an industrial chemical used as a preservative in foods, beverages, and in pharmaceutical formulations, such as cough syrup, tooth paste, and soaps. The market for glycerol has become saturated as biodiesel production
continues to increase, further decreasing biodiesel producers’ profits. E. Transportation Implications
As previously mentioned, ethanol production is concentrated in the Midwest while strong demand for the product can be found on the coasts. Iowa produces nearly 25 percent of the nation’s ethanol but only consumes 4 percent (Low and Isserman, 2009). California consumes the largest share of ethanol nationally at 21 percent. Thus the product must be shipped long distances with the three shipping options being train, truck and barge3. Rail is the most efficient way for the majority of producers to ship their product. Savings, compared to shipping by truck, are estimated to be $2.5 million per year for a 50 MGY plant (IDOT). Annually, a 50 million gallon a year ethanol plant estimates using 2,950 car loads each carrying 100 tons to ship its products, ethanol and DDGS; traveling 2.2 million miles by rail. As a result, rail access is essential to the operations of a biorefinery. Of the 143 million gallons of biodiesel produced in Iowa last year, 84 million gallons were shipped by rail and the remaining 58.6 million by truck.
The Iowa Department of Transportation has awarded grants and loans to biofuel producers through the Rail Revolving Loan and Grant Program for the construction or improvement of railway
infrastructure. Awards have been announced on three occasions with the first occurring in June 2006 and the most recent awards being announced in October 2007. Grants through this program have totaled $1.2 million with an additional $1.2 million being awarded as loans (see Table 3). It should be noted however, that not all rail projects receiving funds have proceeded.
II. Iowa Tax Incentive Programs Used by Biofuel Producers
Iowa does not offer any tax credits specifically for the production of biofuels, but the State does offer tax incentive programs to induce investments by businesses that produce biofuels. These programs are administered by the Iowa Department of Economic Development (DED) with the goal of
increasing investment in businesses, the number of high-quality jobs, and economic activity in the state. These include the Enterprise Zone Program (EZ), the New Jobs and Income Program (NJIP), the New Capital Investment Program (NCIP), and the High Quality Job Creation Program (HQJCP). The Enterprise Zone Program was created in 1997 to encourage investment in distressed areas around the state. The New Jobs and Income Program was created in 1994 to encourage capital investment and job creation within the state. The New Capital Investment Program was created in 2003 to encourage capital investment within the state. In 2005, the High Quality Job Creation Program was created to replace NJIP and NCIP as a tool for encouraging capital investment and job creation within the state. Requirements, benefits, and claim information for these programs are discussed below.
3 The existing pipeline structure is not conducive for the shipment of ethanol and it is more feasible and efficient
10 A. Tax Incentive Program Requirements
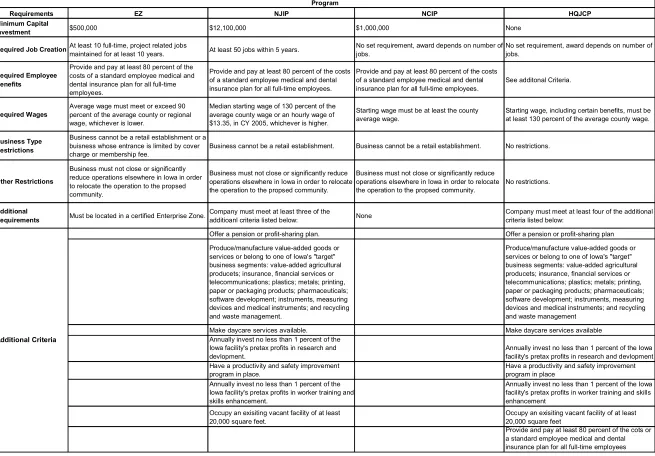
The four major tax incentive programs, EZ, NJIP, NCIP, and HQJCP, have similar general
requirements (see Table 4). The Enterprise Zone Program requires a minimum capital investment of $500,000, NJIP had a minimum capital investment requirement of $12.1 million in Calendar Year 2005, and NCIP had a minimum capital investment requirement of $1 million. HQJCP does not have a minimum capital investment requirement but the award a business is eligible to receive is
dependent on the amount of qualifying capital investment. Qualifying capital investment refers to capital investment in real property including the purchase price of land, existing buildings and
structures, site preparation, improvements to real property, building construction, and long-term lease costs, and investments in depreciable assets.
The number of jobs created by a business also affects its eligibility for tax incentives. Businesses in an Enterprise Zone must create at least ten full-time, project related jobs and maintain them for at least ten years. To be eligible for tax credits under NJIP a business must create 50 new jobs within five years. Neither NCIP nor HQJCP have minimum job creation numbers; however, for each, the amount of Investment Tax Credit awarded varies depending on the number of jobs created. In addition to job creation numbers, all four programs have a minimum average wage requirement based on the county average wage. For EZ, a company must pay an average wage that meets or exceeds 90 percent of the average county or regional wage, whichever is lower. To qualify for awards under NJIP, a business must pay a median starting wage of 130 percent of the average county wage or an hourly wage of $13.35 in calendar year 2005, whichever is higher. Under NCIP, the starting wage must be at least the county average wage. For HQJCP, starting wages, including certain benefits, must be at least 130 percent of the average county wage. EZ, NJIP, and NCIP require a business to provide and pay at least 80 percent of the costs of a standard employee medical and dental insurance plan for all full-time employees. EZ, NJIP and NCIP also have additional
restrictions4.
The Enterprise Zone program has an additional geographic requirement; firms must locate in a designated Enterprise Zone (see Figure 5). NJIP and HQJCP also have additional criteria which a business must meet three of for NJIP and four of for HQJCP. The additional criteria under both programs are:
• Offer a pension or profit-sharing plan
• Produce and/or manufacture value-added goods or services or belong to one of the Iowa’s “target” business segments which are: value added agricultural products; insurance, financial services or telecommunications; plastics; metals; printing, paper or packaging products; pharmaceuticals; software development; instruments, measuring devices and medical instruments; and recycling and waste management
• Make daycare services available
• Annually invest at least one percent of the Iowa facilities’ pretax profits in research and development
• Annually invest at least one percent of the Iowa facilities’ pretax profits in worker training and skills enhancement
• Have a productivity and safety improvement program in place
• Occupy an existing vacant facility of at least 20,000 square feet
4EZ, NJIP, and NCIP restrict award eligibility to non-retail establishments. Additionally, EZ does not award tax
11
In addition to the above criteria, HQJCP also has an additional criterion which is available to provide or pay at least 80 percent of the costs of a standard employee medical and dental insurance plan for all full-time employees.
B. Tax Incentive Program Benefits
The exact value of the award depends on the amount of capital investment and number of jobs proposed to be created as well as the business’ needs. This is particularly true for HQJCP (for more specifics see Table 6). All four tax incentive programs offer a refund of sales and use taxes paid to contractors or subcontractors during construction, a supplemental Research Activities Tax Credit, and an Investment Tax Credit. EZ, NJIP and HQJCP also offer local property tax exemptions on the value added to the property. EZ and NJIP allow eligible businesses who already have a Iowa Industrial New Jobs (260E) agreement in place to claim a supplemental 260E Withholding Tax Credit for new
employees.5
C. Tax Credit Claim Provisions
For the Investment Tax Credit and the supplemental Research Activities Tax Credit, credits awarded to pass-through entities must be claimed by the entity’s owners based on the share of the entity’s income distributed to each owner. Each award is given a unique tax credit certificate issued by the DED containing a certificate number, the taxpayer’s name, address, tax identification number, and the amount of tax credits. The tax credit certificate must be attached to the taxpayer’s tax return for the year in which it is used. In addition, taxpayers with claims to these credits must file, starting with tax year 2006, the IA 148 Tax Credits Schedule. Awarded credits may not be sold or traded.
In all cases where these tax credits are available the following refundability provisions apply. The local property tax exemption and the supplemental 260E are not refundable. The Investment Tax Credit is generally not refundable except for value-added agricultural or biotechnology projects,
subject to the successful completion of the project and the aggregate cap of $4 million per fiscal year. Any nonrefundable credit in excess of tax liability may be carried forward for up to seven years. The sales tax refund and the supplemental Research Activities Tax Credit are refundable.
III. Biofuel Producers Tax Credits Across the U.S.
The federal government and 25 of the 50 states currently have some type of public funding program to support biofuel producers. Seventeen of these 25 states have established tax credit programs (see Table 7). Other incentives include grants, tax exemptions, tax deductions, rebates, and mandates. The federal government also has tax incentives to promote both fixed investment and production of biofuels.
There are two kinds of tax incentive programs for biofuels production: investment incentives and production incentives. The first category encourages investors to make capital investment in biofuel facilities, including production, storage, distribution, or delivery facilities and equipment. The tax credit programs in this category allow taxpayers to receive credits on their fixed asset investments and claim these credits against their income tax or property tax liabilities. Currently, there is no federal tax incentive to promote the fixed investment in biofuel production facilities. Thirteen states provide such financial incentives to biofuel production investment. Eight of the thirteen states offer tax credits for investment in infrastructure and equipment (see Table 8). Most states’ tax credit rates are below 50 percent. Florida, as an outlier, offers a 75 percent credit for fixed investment in production and distribution facilities which can be claimed against sales and use tax.
5260E is a job training agreement between a business and a community college. The supplemental 260E can
12
One of Iowa’s six neighbors, Nebraska, currently provides a tax credit, the Biodiesel Production Investment Tax Credit, specifically for investment in biodiesel production facilities. The eligible facilities must produce B100 and be at least 51 percent owned by Nebraska individuals or entities. The tax credit rate is 30 percent of the investment in any eligible production facility and capped at $250,000 per facility. The average cost to construct a biodiesel facility is approximately $48 million (DED). South Dakota has a tax refund for contractors' excise taxes and sales and use taxes paid for the construction of a new agricultural processing facility with a project cost higher than $4.5 million. The second category offers production tax credits directly related to output. The more biofuels
produced, the more credits awarded, until any credit caps are reached. The federal program offers small ethanol and biodiesel producers a tax credit of $0.10 per gallon produced up to 15 million gallons (see Table 9). To be eligible, a producer must make less than 60 million gallons of biodiesel or ethanol per year. Before 2005, a small ethanol producer was defined as a producer making less than 30 million gallons per year.
Twenty-three states offer incentives to biofuel producers to increase their output. Fourteen of the 23 states also provide tax credit programs to support biofuel production, but Iowa is not among them. Credits are usually awarded on a per gallon basis, ranging from $0.01 per gallon in Virginia to $1.00 per gallon in Indiana and Kentucky. A majority of these programs are capped.
Of Iowa’s neighbors, Nebraska, Minnesota and South Dakota are the three states with production tax incentives. Minnesota and South Dakota offer a $0.20 per gallon tax credit to ethanol producers. Nebraska offers a $0.18 per gallon tax credit. Minnesota has an annual cap of $3 million for any individual producer. South Dakota has an annual cap of $7 million statewide. Although Missouri does not have a production tax credit, it has both ethanol and biodiesel production incentives supported by a state fund. Its ethanol production incentive pays $0.20 per gallon for the first 12.5 million gallons and $0.05 for the second 12.5 million gallons by a single producer. Its biodiesel production incentive pays $0.30 per gallon for the first 15 million gallons produced (by a single producer) and $0.10 per gallon for the next 15 million gallons produced.
As noted above, the tax credits received by Iowa biofuel producers are through tax incentive
programs designed to support any qualified business investment and job creation in Iowa. Therefore, the business investment and job creation related tax incentives in other states need to be examined and compared with Iowa’s programs. To make the comparison more relevant to Iowa’s biofuel production, only the top seven ethanol producing states and Iowa’s neighbor states are considered. According to the Ethanol Producer Magazine, Iowa and five of its six neighboring states, (Nebraska, Illinois, South Dakota, Minnesota, and Wisconsin) are among the top seven ethanol producing states (see Table 10). Indiana is the only one in the top seven producing states not adjacent to Iowa. Five of the top seven ethanol producing states have Investment Tax Credit programs. While each program is unique there are some similarities (see Table 11). All five states have some Enterprise Zone or special zone programs, which are aimed to direct investment to specific communities. The other similarity is that most states award tax credits based on the additional economic activity induced by the investors. The usual measurements for the additional economic activitiy include the minimum investment criteria, the number of new jobs, and the average wage of new jobs.
13
enterprise zone program only offers credits for increased wages of local employees in private
companies in the enterprise zone. Nebraska has programs specially aimed to promote investments in rural areas. For Wisconsin, both investment and the new jobs are awarded with the tax credits. IV. Literature Review
The economic literature on ethanol is broad, although little discusses the interaction of state tax incentives and the ethanol industry. Hofstrand (2008) outlined several beneficiaries of corn ethanol production. He found that ethanol producers, corn farmers, farming input suppliers, and farmland owners are among the major groups benefiting from the ethanol production boom. In this study, local communities are also considered as another beneficiary group because the communities benefit from the increased economic activity of the ethanol plants operating in their neighborhood.
The state tax incentive programs, such as EZ, NJIP, NCIP, and HQJCP used in Iowa to support biofuel producers include Investment Tax Credits. Little work has been done to directly measure the impacts of Investment Tax Credits, like those provided under EZ, NJIP, NCIP and HQJCP, on ethanol producers. However, there are numerous studies focusing on the effectiveness of Investment Tax Credits on general business activities. One group of papers estimated the Investment Tax Credit’s impact on promoting capital investments using Tobin’s q model. Tobin’s q, widely used as a measure of capital investment, provides a ratio of a company’s market value to the replacement value of its assets.6,7 The q ratio is related to the investment rate, which is the speed at which investors increase their investments. Using a tax-adjusted q ratio, researchers have focused on the impacts of taxes and depreciation allowances on the investment decision (Auerbach and Hassett (1992), Calomiris and Hubbard (1993), Cummins, Hasett and Hubbard (1994), Bond and Cummins (2000), Goolsbee (2000), and Desai and Goolsbee (2004)). The tax-adjusted q is the q ratio adjusted for depreciation allowances and Investment Tax Credits.8 These works found that investment tax incentives promote more capital investment, but the magnitude varied across industries and periods. To examine the Investment Tax Credit’s impact on Iowa ethanol producers, the Desai and Goolsbee (2004) model is applied to estimate tax-adjusted q ratios for ethanol projects built in Iowa. It is hypothesized that these Investment Tax Credits have had a significant impact on attracting more investment to the ethanol industry, which in turn has increased the nameplate capacity of ethanol production facilities in Iowa.
Economic benefit analysis of the ethanol industry on the agriculture sector has only been developed recently. For major suppliers like corn farmers and farmland owners, increased ethanol production capacity causes increased demand for corn and farmland. Some papers that address the long-term equilibrium in corn and ethanol markets include Elobeid and others (2007), Tokgoz and others (2007), and Baker and others (2008). For short-term market equilibrium, McPhail and Babcock (2008)
provides a structural equation model that links the corn, gasoline, and ethanol markets. Their model is able to forecast the short-run impacts of energy policy changes or market shocks on the price of
6 Tobin’s q is a measure of firm performance. It equals the ratio of a firm’s market value (as measured by the
value of its outstanding stock and debt) to the replacement cost of the firm’s assets. A ratio greater than one means the firm’s profits exceed what is necessary to remain in business and generally indicates the firm benefits from some source of monopoly power, such as barriers to entry. Sometimes a ratio in excess of one denotes an inability to determine a replacement value for all assets, particularly intangibles. James Tobin (1969) first presented this measure.
7 For a better understanding of the Tobin’s q ratio, see Hayashi (1982), Fazzari, Hubbard, and Petersen (1988),
Bernanke, Bohn, and Reiss (1988), Bernanke and Gertler (1989), Clark (1993), Oliner, Rudebusch, and Sichel (1995), Gilchrist and Himmelberg (1995), Erickson and Whited (2000), Erickson and Whited (2006), Cumins, Hasset, and Oliner (2006), and Philippon (2008)
8
14
corn. They estimated that the three major federal ethanol policies which are the renewable fuels mandate, the blender tax credits, and the tariff on imported ethanol increase average corn prices by 14.5 percent. Du, Hennessy, and Edwards (2007) estimated that cash rents increase by $79 for a $1 increase in the corn price in the short-run. They also found that the ethanol plants impact the local farmland rental market mainly through the national commodity price.
There are a few papers estimating the spill-over effects that ethanol plants have on local communities. Swenson and Eathington (2006) found that local economic benefits are greater with a higher
percentage of local ownership. A 2006 study conducted by the Missouri Department of Economic Development also supports the finding that local ownership of an ethanol plant results in greater regional benefits from the plant. Specifically, new personal income to Missouri residents was estimated to be sixty-five cents greater, per dollar invested, if the plants are exclusively owned by residents compared to plants solely owned by nonresidents. This same study by the Missouri Department of Economic Development also found that for every dollar invested in the biofuels
industry, net general state revenues increase by forty-five cents, residents’ personal income increases by $18.40, and economic activity within the state increases by $20.29.
Several papers have attempted to estimate the number of direct and indirect jobs created by the ethanol industry. There is a wide range of estimates for the number of indirect jobs created by the biofuels industry. On the high side, a 2008 report prepared by Urbanchuk for the Renewable Fuels Association (RFA) found that a 50 MGY plant creates 40 direct jobs and 578 indirect jobs and a 100 MGY plant creates 50 direct jobs and 1,087 indirect jobs. On the low end Swenson (2006) found that a 50 MGY plant creates 35 direct jobs and just 75 indirect jobs. The discrepancy is due to differences in assumptions made and consequently the estimated multiplier used. The actual number is likely modest and closer to Swenson’s estimate.
Some studies have questioned the cost effectiveness of tax credits given to the biofuels industry to achieve the perceived goals of lowering greenhouse gas emissions and reducing the nation’s dependence on foreign oil. A 2008 report by Metcalf concluded that, “the cost of reducing carbon dioxide emissions through this subsidy exceeded $1,700 per ton of carbon dioxide avoided in 2006 and the cost of reducing oil consumption over $85 per barrel” (Metcalf, 2008). Further, an update on U.S. biofuel subsidies by Earth Track Inc. in 2007 found that giving tax credits to the industry is an expensive way to achieve the above goals (Koplow, 2007).
V. Motivation for Public Support of Biofuel Production
There are numerous quantifiable direct and indirect benefits of biofuel production in Iowa. The
potential of the plants to revitalize rural communities is among them. With many perceived benefits to plant location within a community, states must make substantial offers to attract investors to construct a biofuel plant in a specific area as other states are also competing for the plant. The construction of a plant stimulates economic activity in the area by bringing in outside contractors and creating jobs and demand for local goods and services. After the initial construction phase, communities benefit from the jobs required for operating the plant. These all lead to an increase in retail sales within the community. The local benefits of ethanol plants will be further analyzed in Section X.
Additionally, ethanol and biodiesel production creates strong demand for corn and soybeans, which increases the prices of the commodities, resulting in higher farm income. Also higher commodity prices result in higher land values and rental rates, which benefit land owners but not farm renters. These benefits transcend county lines and aid all corn and soybean farmers. This impact is also analyzed further in Section X.
15
Jim Nichols, a former Minnesota state agriculture commissioner said, “There was a time when these [subsidies] were needed, but I think that time has past.” (Star Tribune, 2006) Also, market saturation is increasingly an issue as demand is limited by such factors as a lack of flex-fuel vehicles and a limit of a 10% ethanol blend (E10).
Although beyond the scope of this paper, there has been public support of ethanol because of its presumed environmental benefits. Also, as world demand for oil continues to increase and global supply remains tight, the price of oil will remain high further warranting investment in alternative sources of fuel.
VI. Biofuel Production in Iowa and Neighboring States
Iowa is the top ethanol producing state in terms of both current operating production capacity and current plus under construction/planned capacity. The top five ethanol producing states, in terms of current operating production capacity and their share of U.S. ethanol production, are Iowa (24.9 percent), Nebraska (12.8 percent), Illinois (9.3 percent), South Dakota (8.7 percent) and Minnesota (7.4 percent) (see Table 10). There are 25 states currently producing ethanol (Ethanol Producer Magazine, 2009). The top five states produce 63.1 percent of U.S. ethanol. The total amount of ethanol produced by the top ten states is just short of 84.7 percent. The strong supply orientation of the industry can be seen as it is heavily concentrated in the corn producing states of the Midwest. Further, a linear relationship exists between a state’s total ethanol production capacity and the amount of corn produced in that state (see Figure 6).
Iowa is second to Texas in biodiesel in terms of current operating production capacity with 245 MGY, or 10.1 percent of U.S. production. Texas (14.5 percent), Illinois (7.8 percent), Missouri (6.3 percent) and Washington (5.8 percent) round out the top five states. The top five states produce 44.5 percent of U.S. biodiesel. This share grows to 67.7 percent when the top ten biodiesel producing states are included. There is a greater variety of less centrally located feedstocks available to produce biodiesel than there are for ethanol. Thus, 39 states are currently producing biodiesel and the national
production capacity is not geographically clustered (see Table 12). VII. Biofuel Producers Tax Credit Awards
Both DED and DOT offer financial support to the biofuels industry in Iowa. Both State agencies have provided the Department of Revenue (IDR) with public information on financial awards made to
biofuel projects. The information includes the company name, location, production capacity, projected employment, capital structure, incentive program type, and the amount of award for each program. DED also provided IDR with some information on the type and amount of financial support offered by local governments. These local incentive programs include property tax abatements, local bonds and grants, local Tax Increment Financing (TIF), and city loans.
As of December 2008, there were 71 ethanol and biodiesel projects that had entered into contracts with the State of Iowa to receive tax credits. Regarding only tax credits, the State awarded $449 million in total and $6.3 million on average to each project (see Table 13). As a comparison, the average amount of private investment in a biofuel production facility is about $101 million. Therefore, for every public dollar committed, $15.50 of private money has been invested in Iowa.
Of the 71 biofuel production projects receiving public financial support, 55 are ethanol facilities and 16 are biodiesel facilities. In total the Iowa ethanol industry was awarded $411.9 million of public
funding, including $405.8 million in State tax credits. The biodiesel industry has been offered $49.3 million of public money, including $43.2 million in State tax credits. The average capital investment in ethanol projects is $122 million compared to $29 million for biodiesel projects. Not surprisingly,
16
Table 14 shows tax credit awards by program. EZ and HQJC are the two major programs used by the State to provide public financial support for the biofuel industries. EZ provided $104.2 million and HQJC provided $169.6 million in public support.
Among biofuel projects, ethanol projects on average received substantially larger awards across tax credit programs. For EZ, ethanol projects were offered $5.8 million on average and biodiesel projects received $3.9 million on average. For HQJCP, ethanol projects were awarded $8.1 million on
average and biodiesel plants were awarded an average amount of $1.3 million.
Investment Tax Credits and sales and use tax refunds are the two largest components in the tax incentive programs supporting biofuel producers. The Investment Tax Credits can be claimed against corporate income, individual income, franchise and insurance tax liabilities. The sales and use tax refunds reduce state sales and use taxes and local option taxes paid by contractors or subcontractors during construction.
Also, it should be noted that, according to the Iowa Renewable Fuels Association, as many as 17 projects that have received awards may not proceed with their construction plans.
VIII. Biofuel Producers Tax Credit Claims
Biofuel producers are eligible for both sales and use tax refunds and Investment Tax Credits as benefits of the tax incentive programs previously described. Sales and use tax refund claims are made by the producer after the tax has already been paid. In contrast, Investment Tax Credits are claimed against income tax liability. When C-corp buisness structure, the business can claim the tax credit against its corporate income tax liability. Those tax credits that can passthrough to
shareholders are claimed by the individual investors on individual income tax returns. The amount of tax credits that can be claimed by an individual shareholder is directly proportional to the fraction of the company that the taxpayer owns.
A. Sales and Use Tax Refund Claims
The first sales and use tax refund issued to an ethanol producer was in 2003 under NJIP. There have been a total of 29 claims by 15 unique ethanol producers amounting to $3.83 million (see Table 15). In 2006 the first sales and use tax refund was issued to a biodiesel producer under the Enterprise Zone Program. Since then, there have been a total of seven sales and use tax refunds issued to four unique producers for a total of $1.72 million (see Table 16).
B. Investment Tax Credit Claims
17
number with the credit. In these cases, it is impossible to determine what credit the taxpayer is claiming.
IX. Ownership Structure of Biofuel Production Facilities
Based on the information available through July 1st, 2008, sixty-one companies have invested in 71 biofuel production projects that have been awarded State tax credits in Iowa. Eleven projects are owned by eight C-corporations. Fifty-one projects are owned by limited liability companies (LLCs). There is also one limited partnership (LP), two cooperatives, and two S-corporations9.
Using IDR data, shareholder information for 28 of the 51 LLCs was collected including some pass-through entities. For a few biofuel producers, some of their pass-pass-through entity shareholders (1st level) are owned by other pass-through entities (2nd level). In extreme cases, there are five ‘levels’ of pass-through entities in producers’ shareholder structures (see Figure 7). Only underlying
shareholders are included in the analysis after examining every ownership level. The individual income tax dataset was also used to identify investors with farm income.
Table 18 shows summary statistics of the ownership structure in these 28 LLC producers. The
average number of underlying investors is 367. The median number of investors is 167, which implies that a small number of producers have an extraordinarily large number of investors. The company with the largest number of shareholders has 1,533 underlying owners. Furthermore, most
shareholders are Iowans, including individuals and corporations, and Iowans also own the majority of the companies. On average, there are 316 Iowa resident shareholders in every company and they own 89 percent of the company. The median number of shareholders who are Iowans is 54, much lower than the average number, but the median percentage of the company owned by Iowans is higher, at 99 percent. Most of the investors are individuals. Of the 367 owners per producer on average, 346 are individual investors, and they own 81 percent of the company.
Because the biofuels industry is one of the most important markets for corn and soybeans, farmers’ stakes in biofuel producers were also examined. On average, 169 of the 367 owners of a biofuel company have farm income and they have a 31 percent stake in the company. On median terms, 75 of the 167 owners of a biofuel company have farm income and they own 38 percent of the company. Investors in biofuel plants are likely to live within a 100 mile radius of the plant. The geographic distribution of investors with and without farm income is indistinguishable as both types of investors are clustered around the plant. Likewise, the tendency of investors to live near the plant is
independent of whether it is an ethanol or biodiesel facility (see Figure 8). X. Beneficiaries of the Biofuel Industry in Iowa
The profits from investing in ethanol production filter through the various layers of beneficiaries starting with the ethanol producers and ending with the land owners. Initially ethanol producers, helped by strong demand for their product as a replacement for MTBE10 and low corn prices, saw large profits. Until late 2006 there was a surplus of corn and limited ethanol production capacity. In late 2006 the supply of corn became limited due to ethanol production and the price was bid up. This shifted the profits to the corn producers. In response to the high price of their product, farmers
expanded corn production which increased demand for inputs such as fertilizer, chemicals, and seed. This shifted profits to the agribusinesses supplying these inputs. Eventually, these companies will respond with higher prices for their products and produce key inputs until profits are zero. When this happens, the profits of the corn ethanol industry will shift to the final limiting resource, land and land
9
See appendix A for definition of business organization type and their respective tax treatment.
10Methyl Tertiary Butyl Ether (MTBE) was used as a fuel oxygenate that has been linked to water
18
owners. If technological advancements in other alternative fuels replace the need for ethanol a similar scenario will play out with producers being the first losers and so on (Hofstrand, 2008). This section provides an analysis of the beneficiaries of the corn ethanol industry in Iowa.
A. The Farm Sector
Part of the rationale for providing tax credits, and other forms of public assistance, to the Iowa ethanol industry is that the benefits derived from the development of this industry flow through to farmers and by extension to their suppliers and to their surrounding communities. Farmers have invested some of this increase in income in new equipment as seen by large increases in depreciation expenses. Between 2006 and 2007, depreciation expenses for corn and soybean farmers increased 45.3 percent. This has benefited firms who supply farm equipment as farmers purchase large farm equipment such as tractors.
Gross farm income for corn and soybean farmers increased 17 percent from 2006 to 2007, the previous five year high for year over year growth was 11 percent from both 2002 to 2003 and 2003 to 2004. Cattle (8 percent), dairy (13 percent) and hog farmers (9 percent) all experienced more modest increases in gross income from 2006 to 2007. High commodity prices increase land values. To this end, cash rental rates increased 9.1 percent (county average) from 2006 to 2007 nearly three times the pervious five year high of 3.5 percent from 2002 to 2003.
The direct impact on increased corn prices from the additional ethanol production induced by state tax credits provided to ethanol producers is analyzed using a two-stage model. The first stage uses an adaptation of Tobin’s q to estimate the impact of tax credits on the amount of investment and the ethanol production capacity in Iowa. The second stage employs a model developed by McPhail and Babcock (2008) to estimate the impact of ethanol production capacity on corn prices and farmland value.
The technical details of the models are presented in Appendix B. Estimates from the first stage suggest that if there had not been any tax credits awarded to the ethanol producers, the capital investment would have been reduced by $2.11 billion, which is 38.4 percent of the $5.48 billion of the total investment made by producers in Iowa. More specifically, for 2005 and prior years, it is
estimated that the tax credits increased the investment by $645.9 million, or 44.6 percent of the investment made during the period. The 2006 tax credit induced investment was $600.9 million (40.5 percent) of total 2006 investment. The 2007 tax credit induced investment was $858.5 million (37.7 percent) of total 2007 investment.
Without the tax credits, the nameplate capacity of the Iowa ethanol industry would be smaller. The increase in nameplate capacity would have been reduced by an estimated 307 million gallons in 2005, 300 million gallons in 2006, and 332 gallons in 2007. The cumulative capacity loss would have been 307 million gallons in 2005, 607 million gallons in 2006, and 939 million gallons in 2007. By
comparison, the total capacity of ethanol production was 13,608 million gallons in the nation and 3,534 million gallons in Iowa by the spring of 2008, according to the Nebraska Energy Office
(December, 2008). Therefore, the state tax credits may have induced as much as 25 percent of Iowa ethanol production capacity.
The demand for corn is positively correlated with ethanol production capacity and would thus be lower if production capacity were lower. Consequently, the corn price would have been reduced because of the lower demand. In the second stage, the impacts on corn prices are estimated.
19
Tobin’s q model. The non-credit corn prices are the simulated corn prices using the reduced demand for corn from ethanol producers. Without the State tax credits, the corn price per bushel would have been 3 cents lower in 2005, 9 cents lower in 2006, and 17 cents lower in 2007. Assuming that Iowa farmers still produced the same amount of corn, the corn value difference measures the impacts on farmers’ revenue from the demand for corn due to ethanol production. The State tax credits
increased farm corn production revenue by $64.9 million in 2005, $184.5 million in 2006, and $402.4 million in 2007. By comparison, Iowa corn production revenue was $4.3 billion in 2005, $6.8 billion in 2006, and $11.4 billion in 2007.
Although farmers have seen an increase in income, a direct result of increased corn and soybean prices from the additional demand for the products attributable to biofuels, there has also been an increase in farm expenses, most notably farmland rents, seed, fertilizer and chemicals (see Figure 9). Using the estimated impacts on corn prices due to the State tax credits, the impacts on Iowa farmland cash rental rates and farmland prices are calculated. Du, Hennessy, and Edwards (2007) found that cash rents go up by $79 per acre of cropland for a $1 per bushel increase in corn price.
Using the annual three-month London Interbank Offered Rate (LIBOR) as the interest rate, the affected farmland prices due to the changed farmland rents are presented in Table 20. Land cash rents would have been reduced by $2.37 per acre in 2005, $7.11 per acre in 2006, and $13.43 per acre in 2007, because the lack of State tax credits to ethanol plants would have led to lower corn prices. The estimated Iowa land cash rents would have caused average farmland value per acre to fall by $66.57 (2.3 percent) in 2005, $136.73 (4.3 percent) in 2006, and $253.4 (6.5 percent) in 2007. Total agriculture land value in Iowa would have been reduced by $2.1 billion (2.3 percent), $4.3 billion (4.3 percent), and $8.0 billion (6.5 percent) from 2005 to 2007.
The United States Department of Agriculture (USDA) reported that in 2007 national farm production expenditures surpassed previous record highs due primarily to high fuel prices (USDA, 2008). Table 21 presents the U.S. corn farming production value and input costs from 2001 to 2007. It shows that the benefits of increased corn prices have been partially transferred to farm input suppliers. High fuel prices led to increased costs for transportation, fertilizer, chemicals, and fuel. From 2006 to 2007, the amount of farm expenses categorized as seed for corn and soybean farmers increased 31 percent; far higher than in any of the previous five years. Even more, fertilizer expenses grew 42 percent in the same time period; the previous high year over year change was 18 percent growth from 2004 to 2005. Chemical expenses increased 30 percent from 2006 to 2007, which is much higher than the high of 11 percent from 2002 to 2003. Likewise, livestock farmers have experienced a sharp increase in feed expenses as they use corn for animal feed (see Figure 10). Cattle and cattle feedlot farmers’ profits have been squeezed by a 34 and 40 percent increase, respectively, in feed expenses from 2006 to 2007. Feed expenses for hog and pig farmers increased 21 percent over the same period. B. Direct Employment
As the biofuels industry has grown in Iowa, direct employment by ethanol facilities has also increased (see Figure 11). Employment by Iowa dry mill ethanol producers peaked in December 2007 at 1,156 employees11. The largest increase in employment occurred between 2006 and 2007. This coincides
with the ethanol explosion when many more plants went into production. Biorefineries also demonstrate increasing returns to labor. Doubling output from 50 MGY to 100 MGY requires increasing labor by approximately 37 percent, from an average of 38 employees to 52.
The average wage of employees in the ethanol industry in the first quarter of 2008 was $52,944.
11 Note that this number only includes employees at dry mill ethanol plants and thus understates total
20
Direct employment in the Iowa biodiesel industry has also increased substantially since 2005 as more producers began operations (see Figure 12). Employment in the biodiesel industry peaked in July 2007 at 267 employees. In the first quarter of 2008, the average annual wage earned by employees at biodiesel plants was $51,965.
C. Local Communities: Impact on Household Income
Ethanol plants provide direct and indirect benefits to local communities through job creation and increased economic activity within the community. These factors could potentially raise household income for residents. Between 2003 and 2006, nine ethanol plants were constructed in Iowa. Over the same period real household income increased in those nine towns much more than all of Iowa (see Table 22). To determine if this increase is attributable to the construction and operation of ethanol plants, average household income before and after a plant was constructed can be compared. However, factors other than the construction of the plant, such as general economic growth in the state, may explain the increase in real household income. Thus, to determine if ethanol plants can explain income growth it is necessary to compare the change in household income of taxpayers in towns where an ethanol plant was constructed, referred to as the treatment group, to the change in household income of similar taxpayers who live in towns in which an ethanol plant was not constructed, referred to as the control group12.
First, it is necessary to identify the two groups. Using data from individual tax returns in tax years 2003 and 2006, the treatment group is constructed with all taxpayers reporting the name of the nine towns with ethanol plants (see Table 23). Two methods were used to construct the control group of taxpayers. The first chose the control by matching on an individual basis, while the second matched on a town level.
Under the first approach, the treatment group and eligible control group were limited to residents who lived in the same town in both 2003 and 200613. This was done to control for the possibility that
people moved in and/or out of a town in response to an ethanol plant being constructed and also to control for unobserved differences between individuals within the same groups in both years. The demographics of the population is not homogenous throughout the state, conversely it varies by region. Thus, the state is divided into four geographic regions Northeast, Northwest, Southeast and Southwest (see Figure 13). Residents living in the southwest quadrant of the state were excluded from the potential control group because there were no ethanol plants constructed in this region between 2003 and 2006, thus no taxpayers in the treatment group live in that quadrant. Individual taxpayers living in towns categorized as the treatment group were matched to taxpayers in the potential control group (all taxpayers who did not move between 2003 and 2006 and excluding residents in the southwest quadrant of the state) using the propensity score matching method to form the control group14.
Under the second approach, the control group was formed by matching each town in the treatment to a similar town without an ethanol plant, based on the following observable characteristics: population density, state quadrant, number of housing units, percent of taxpayers who itemize deductions,
12 This technique is referred to as a difference-in-difference model. See Card and Krueger 1994. 13
This approach also resulted in the exclusion of taxpayers who were the primary earner in 2003 but the
secondary earner in 2006 and vice versa as well as those residents who did not file a tax return in either 2003 or 2006.
14 Propensity score matching is a statistical technique used in non-experimental situations to correct for