http://dx.doi.org/10.4236/jpee.2016.45001
How to cite this paper: Dermawan, E., Almanda, D., Zahro, L., Ramadhan, A.I. and Diniardi, E. (2016) Analysis Magnetiza-tion Current of Harmonic Phenomena and Power Factor as Indicators of Core SaturaMagnetiza-tion at Transformer 3-Phase. Journal of Power and Energy Engineering, 4, 1-6. http://dx.doi.org/10.4236/jpee.2016.45001
Analysis Magnetization Current of Harmonic
Phenomena and Power Factor as Indicators
of Core Saturation at Transformer 3-Phase
Erwin Dermawan1, Deni Almanda1, Laelatus Zahro1, Anwar Ilmar Ramadhan2*,
Ery Diniardi2
1Electrical Engineering Department, Faculty of Engineering, Universitas Muhammadiyah Jakarta, Jakarta Indonesia
2Mechanical Engineering Department, Faculty of Engineering, Universitas Muhammadiyah Jakarta, Jakarta, Indonesia
Received 4 March 2016; accepted 7 May 2016; published 10 May 2016
Copyright © 2016 by authors and Scientific Research Publishing Inc.
This work is licensed under the Creative Commons Attribution International License (CC BY).
http://creativecommons.org/licenses/by/4.0/
Abstract
Saturation is a condition in which the magnets are fully transformer cores and generate maximum magnetic flux. Some parts affect the resilience and create distortions that can harm the heart. Core saturation can also increase the temperature and magnetization current transformer. In this study, we proposed a measurement method to obtain the necessary parameters to calculate a re-liable indicator of the state of the transformer core saturation. The main effects of nonlinear flow in the transformer core are saturation, eddy current and hysteresis. In saturation, the core trans-former is as a source of generating harmonic currents, some of which will flow directly to the pri-mary and secondary windings. The method is based on the magnetization current, the phenome-non of harmonics and power factor is evaluated by measuring the no-load current at three-phase transformer, with a high magnetic flux density imposed. Measurements were taken at each phase of the transformer core. The transformer is connected to a variable voltage variable frequency (VVVF) as a voltage source and the investigation carried out at various flux densities. The results showed that the magnetization current and harmonic phenomena increased significantly when the high magnetic flux density and vice versa injected with power factor declined sharply. This phenomenon can be used as an indication of saturation of the 3-phase transformer core.
Keywords
Core Saturation, Magnetization Current, Harmonic
1. Introduction
Construction of three-phase transformer is basically a single-phase transformer that is arranged into three pieces in the iron core. A transformer consists of a coil and an iron core. Usually there are two coils, namely the pri-mary coil and the secondary coil. The two coils is not related physically but connected by a magnetic field [1].
By the standards of IEC (International Electro technical Commissioning) 1000.4 - 11, they’re classified into harmonic interference waveform distortion [2][3]. In this phenomenon changes the waveform of the wave base. Harmonics are sinusoidal voltage or current wave having a frequency which is the product of the integer (integ-er) of the fundamental frequency, wherein the supply system is designed to operate (typically 50 or 60 Hz). Basically harmonics are symptom formation of waves at different frequencies. It is called frequency harmonics arising from the original waveform, while integer multiplier fundamental frequency is called harmonics se-quence number. Here is an example of a comparison of the basic waveform and harmonic wave [4][5].
The level of disability in harmonics often expressed with Total Harmonic Distortion (THD), Total Harmonic Distortion, used as a gauge to see how much influence the overall presence of harmonics has to the sine signal. Because it is so large and varied effects of harmonics on equipment and systems are technical and economical, it is necessary to standardize the harmonics. Standards governing the harmonic distortion are the IEEE 512-1992 standard, this standard set of harmonics allowable limits (Table 1) [6].
Saturation is a condition in which the magnets are fully transformer cores and generate maximum magnetic flux. This usually happens if the transformer is not big enough for the application. While some parts affect the resilience and create distortions that can harm the heart. Core saturation can also increase the temperature and magnetization current transformer. In saturation, as the transformer core and current harmonics generation sources, some of it will flow directly to the primary and secondary windings. Results of previous studies show that the harmonic content increases significantly when the current no-load and high magnetic flux density in-jects. Today many transformers are widely disturbed by harmonics. Harmonic components have caused losses in the transformer which allows fails to operate.
2. Research Method
2.1. Material ResearchSpecifications transformer is used as the test material is as follows [8]: The manufacturer: PT. Trafoindo Prima Perkasa
Type: Indoor Power (s): 630 kVA Number of phase: 3 phase Impedance (Z): 4% Cooling System: ONAN Primary voltage: 20 KV Secondary Voltage: 400/230 V
[image:2.595.144.491.571.720.2]Core material: laminate M4 grain-oriented electrical steel (H1-Carlite) Thickness of laminate: 0.27 mm thickness
Table 1. IEEE Standard 512-1992, harmonic current limitation [7].
Maximum Harmonic Current Distortion in Percent of IL
Individual Harmonic Order (Odd Harmonics)
ISC/L <11 11 ≤ h < 17 17 ≤ h < 23 23 ≤ h < 35 35 ≤ h TDD
<20* 4.0 2.0 1.5 0.6 0.3 5.0
20 < 50 7.0 3.5 2.5 1.0 0.5 8.0
50 < 100 10.0 4.5 4.0 1.5 0.7 12.0
100 < 1000 12.0 5.5 5.0 2.0 1.0 15.0
2.2. Measuring Instrument
Measurements were made with the simplest tool in measuring current and voltage that is ampere meter and voltmeter. Ampere meter used to measure the current value of the magnetization in the transformer. While the volt meter is used to measure the value of the voltage on the transformer. VVVF used as a voltage regulator and also the frequency at this time of measurement. Where the input voltage is connected with the core and frequen-cies connected to the secondary side of the transformer in Figure 1.
2.3. Circuit Testing
Testing is done by measuring the transformer core, where the ampere meter is connected to the input voltage and variable frequency (VVVF). On the secondary side of the transformer and on the primary side is connected to the VVVF and volt meter. Transformer testing lowered the ratio of 1.1. Measurements were performed with dif-ferent flux density, which is done by varying the input voltage while the frequency is kept constant (fixed). Measurements were taken at each phase that is phase R, S, T, so that the measurement results has equal value or balanced on each phase. The series of measurements carried out as Figure 2.
2.4. Collect of Data
From the measurement results obtained: I1=0.00362 A,I2 =0.0139 A, , I19=1.622 A, then Irms is as follows:
2 , 1
2 2 2 2 2
1 2 3 4 19
2 2 2
0.00362 0.0139 1.6
2.69
22 136 A
rms h h rms
I I
I I I I I
∞ =
=
= + + + + +
= +
=
+ +
∑
(1)
[image:3.595.209.418.417.518.2]From the calculation Irms = 2.69136 A, the total harmonic current distortion (THDi) is as follows:
Figure 1. Sanwa PC 720 M digital multimeter and variable voltage variable frequency (VVVF) [1].
[image:3.595.143.490.543.708.2]2 , 2 2 2 2 THDi 100% 100% 0.0362 100% 2.69136 0.13% h rms h rms rms I I I I ∞ = = × = = × = ×
∑
(2) 1 1 100% 1 0.13% 1 100% 0.99 dist P THDi F + = + = = (3)3. Results and Discussion
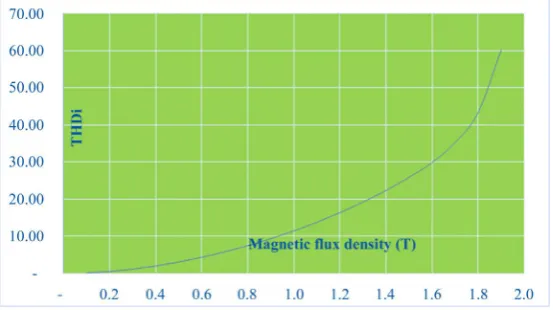
The phenomenon of harmonics in this case distorted total harmonic currents (THD) and the magnetization cur-rent (Io) of the transformer in the magnetic flux density that varies at a frequency of 50 Hz shown in Table 2.
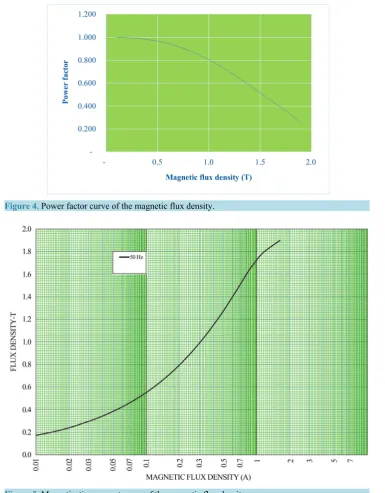
The relationship between the magnetization current and total harmonic current distortion (THDi) of the mag-netic flux density at a frequency of 50 Hz is shown in Figure 3 and Figure 4. While the curve of the power fac-tor of the magnetic flux density is shown in Figure 5.
The evaluation results magnetization current (Io), total harmonic current distortion (THDi) and power factor are shown in Table 2. Stimulation magnetization current Io on the flux density B = 1.7 T (i.e., Io = 0.95 A) almost doubled compared to 1.5 T (Io = 0.698). Meanwhile, THDi increases when the transformer that is charged with a magnetic flux density is higher. On the condition of flux density of 1.5 T and 1.7 T waveform is not sinusoidal currents that occur, as happened in Figure 5. While the flux density of 0.1 - 1.4 T shape of the current waveform is sinusoidal or perfect. This indicates that the flow has been distorted. Characterized by the core saturation cur-rent waveform is not sinusoidal or irregular.
[image:4.595.176.453.540.695.2]Increased THD is very significant when a flux density of 1.5 T density change-1.9 T. This indicates that the core of transformer laminations experiencing burnout. Figure 3 and Figure 4 also shows that the pattern of Io and THDi the density flux density is almost the same with the B-H curve of a magnetic material. Besides satura-tion characterized by the value of the magnetic flux THD at 1.5 T with a value 25.93%. Where the value of THD
Figure 4. Power factor curve of the magnetic flux density.
Figure 5. Magnetization current curve of the magnetic flux density.
allowable standards for electrical appliances maximum is 25% (IEEE 519-1992). As mentioned in Equation (7), the power factor is inversely proportional to THDi. This phenomenon is shown in Table 2 or Figure 4 It is clear that the power factor decreases significantly when a changing magnetic flux density of 1.5 T to 1.9 T. This can also be an indication that core transformer laminations have been experiencing burnout.
4. Conclusions
1) Analysis of the test data show a high magnetic flux density contributing more to the magnetization current, the phenomenon of high harmonics and power factor is low on the magnetic flux density that occurs in the nor-mal operation of the actual transformer which is 1.5 Tesla or 1.7 Tesla.
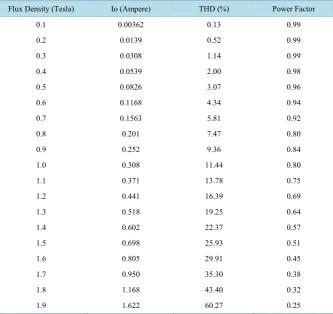
Table 2. The calculation result THDi and power factor on the flux density that varies.
Flux Density (Tesla) Io (Ampere) THD (%) Power Factor
0.1 0.00362 0.13 0.99
0.2 0.0139 0.52 0.99
0.3 0.0308 1.14 0.99
0.4 0.0539 2.00 0.98
0.5 0.0826 3.07 0.96
0.6 0.1168 4.34 0.94
0.7 0.1563 5.81 0.92
0.8 0.201 7.47 0.80
0.9 0.252 9.36 0.84
1.0 0.308 11.44 0.80
1.1 0.371 13.78 0.75
1.2 0.441 16.39 0.69
1.3 0.518 19.25 0.64
1.4 0.602 22.37 0.57
1.5 0.698 25.93 0.51
1.6 0.805 29.91 0.45
1.7 0.950 35.30 0.38
1.8 1.168 43.40 0.32
1.9 1.622 60.27 0.25
same as the curve B - H of the magnetic material (shown in the image above).
3) THDi of the transformer. When the 1.5 Tesla magnetic flux exceeds the standard IEEE 519-1992 i.e. 25% of the capacity of the transformer, then the transformer experiencing saturation condition is characterized by the onset of heat on the transformer.
4) This phenomenon can be used as an indicator to show that a 1.5 Tesla transformer core material has led to saturation.
References
[1] Zuhal (1992) Dasar Teknik Tenaga Listrik dan Elektronika Daya. Jakarta. [2] Dugan, R. (1996) Electrical Power System Quality. Marcell Deker, New York.
[3] Daut, S.H. and Toib, S. (2013) Magnetizing Current, Harmonic Content and Power Factor as the Indicators of Trans-former Core Saturation. Journal of Clean Energy Technologies, 1, No. 4.
[4] Jamaah, A. (2013) Pengaruh Distorsi Harmonik Terhadap Penurunan Kapasitas Daya Trafo Distribusi 3 Fasa 400 kVA di Politeknik Negeri Semarang. Jurnal Politeknik Negeri Semarang, 2, No 1.
[5] Gusnita, N. (2005) Analisis Harmonik pada Sistem Distribusi. Tesis, UGM, Yogyakarta.
[6] IEEE Std 519-1992 (1992) IEEE Recommended Practice and Requirement for Harmonic. Control Power System. [7] IEC (International Electrotechnical Commisioning). 1000, 4-11.
![Table 1. IEEE Standard 512-1992, harmonic current limitation [7].](https://thumb-us.123doks.com/thumbv2/123dok_us/7943790.751128/2.595.144.491.571.720/table-ieee-standard-harmonic-current-limitation.webp)
![Figure 1. Sanwa PC 720 M digital multimeter and variable voltage variable frequency (VVVF) [1]](https://thumb-us.123doks.com/thumbv2/123dok_us/7943790.751128/3.595.143.490.543.708/figure-sanwa-digital-multimeter-variable-voltage-variable-frequency.webp)