Community Smart Grid Utilizing Dynamic Demand
Response and Tidal Power for Grid Stabilization
Anna Demeo1,2*, Michael L. Peterson2
1College of the Atlantic, Bar Harbor, USA; 2Department of Mechanical Engineering, University of Maine, Orono, USA.
Email: *[email protected]
Received July 15th, 2013; revised August 15th, 2013; accepted August 22nd, 2013
Copyright © 2013 Anna Demeo, Michael L. Peterson. This is an open access article distributed under the Creative Commons Attribu- tion License, which permits unrestricted use, distribution, and reproduction in any medium, provided the original work is properly cited.
ABSTRACT
Conventional electricity generation is one of the largest contributors to climate change. Renewable energy sources are a promising part of the solution but uncertainty combined with a lack of controllability prevents renewable sources of power from being direct substitutes of conventional energy sources. This shift towards a higher penetration of renew- able energy into the electric grid can be realized with the implementation of a more sophisticated smart grid, which uses dynamic demand response to alter demand on following generation. Research on renewable energy penetration of the grid predominately focuses on wind and solar power resources but demand cannot always match availability from these sources and therefore greatly increases the need for energy storage. Tidal power differs from solar and wind. It’s a pre- dictably renewable resource which makes it extremely valuable even on a relatively small scale. Introduction of tidal power in a high penetration micro-grid can serve to stabilize the grid and reduce the amount of storage required. Widely different time scale for wind, solar and tidal power availability results in low cross correlations and therefore increases stability. This research describes an incremental approach to migrating a grid-tie island towards the formation of a smart-micro grid. The system will include a high penetration of three distributed generation systems, wind, solar and tidal and utilize commercially available energy storage and a smart-home management controller. Dynamic demand response through load balancing is implemented to minimize interactions with the electric grid. A second component of this work is to determine the optimum tidal generation capacity for the micro grid such that needed storage capacity from batteries or the utility grid is minimized.
Keywords: Smart Grid; Tidal Power; Renewable Energy; Micro Grid
1. Introduction
Integrating renewable energy into the electric grid is a promising area of research in the widespread effort to ad- dress climate change. Conventional electricity generation is one of the largest contributors to climate change due to the production of greenhouse gasses [1]. Renewable en- ergy sources cannot be directly substituted for conventio- nal energy sources due to their uncontrollable and inter- mittent nature [2]. The conventional electricity grid func- tions on a generation following load principle, which en- tails controlling power plants to match varying power consumption [3]. Incorporating a higher penetration of renewable energy sources into the grid will require a pa- radigm shift to a load following generation model in which demand side management actively controls loads to off-
set variations in power production. This shift can only be realized with implementation of a more sophisticated elec- tric grid.
Smart-grid is an umbrella term used to describe the te- chnological upgrade of the grid or micro-grids to signifi- cantly increase penetration of renewable energy sources [4]. A smart-grid will dynamically monitor and control demand based on power production and consumption, known as dynamic demand response (DDR) [5]. Load balancing capacity, which is the available amount of dis- patchable loads for DDR, grid energy storage and dis- tributed renewable generation are the key components of a smart micro grid. Benefits of a smart-grid include in- creased penetration of renewable sources of power and an overall reduction in power consumption on the consu- mer side, which ultimately increases efficiency and grid security, lowers cost, and reduces carbon emissions.
Uncertainty combined with a lack of controllability prevents renewable sources of power from being direct substitutes for conventional energy sources. Research on renewable energy penetration of the grid predominately focuses on wind and solar power resources and the asso- ciated need to control demand through a smart grid net- work [6]. In addition to the inability to precisely charac- terize wind and solar power production, the reality that demand cannot always match availability from these sourc- es greatly increases the need for energy storage.
Tidal power differs from solar and wind in that it is a predictable renewable resource. Although typically tidal sites do not offer as large of a supply as offshore wind [7], the predictability of the resource is extremely valu- able as the introduction of tidal power, for small, geogra- phically appropriate micro-grids, into a high penetration micro-grid can serve to stabilize the grid and reduce the amount of storage required. By further aggregating rene- wable power generation and providing a predictable in- put, variability and uncertainty are also reduced. Widely different time scale for wind, solar and tidal power avai- lability results in low cross correlations and therefore in- creases stability.
Island communities may be able to most immediately benefit from the development of smart micro-grids with predominately renewable energy penetration. Both grid- tie and autonomous islands experience high and fluctuat- ing energy costs due to losses from underwater power ca- bles in the first instance and fuel purchase and transpor- tation costs for generators in the latter. These costs are a strong incentive for island communities to integrate local energy sources. Geographically islands tend to provide an opportunity for a variety of renewable power sources including wind, tidal, wave and solar production. More- over, many island communities operate at a scale that is suitable for smart-grid development with commercially available storage and smart-home technology.
This paper describes an incremental approach to mi- grating a grid-tie island towards the formation of a smart- micro grid. The system will include a high penetration of three distributed generation systems, utilize commercial- ly available energy storage and a smart-home management controller. The primary objectives of this paper are to:
1. Determine optimum tidal generation capacity based on demand-supply balance of energy consumption and solar and wind power generation. Utilize tidal power for grid stabilization such that needed storage capacity from batteries or the utility grid is minimized.
2. Detail a non-autonomous smart-grid configuration using off the shelf storage and control equipment and off the shelf home automation management software to im- plement dynamic load balancing to minimize interaction with the utility grid. This will result in reduced power loss in the underwater cable, lower costs and increased
efficiency. Utilize this non-autonomous smart micro-grid to aid in the refinement of an autonomous solution through monitoring of real-time power magnitude and direction at the utility grid source.
2. Site
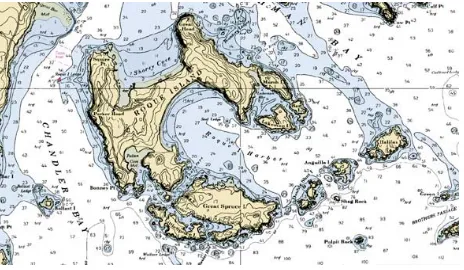
Roque Island is a privately owned, 1300-acre island off the coast of Maine. Fifteen acres of cleared land on the southeast shore hosts six homes and a small, year round farm comprised of two large barns and several out build- ings for horses and livestock for food production six staff members live year round on the island in three of the houses. The remaining three houses are occupied from May through October by members of the family trust that owns the island. Population of the island averages 30 du- ring the peak usage months of July, August and Septem-ber. Average energy use for the island is 38 MWh per year. The island is connected to the mainland grid through an 1800 m underwater power cable. The primary energy consumption on the farm is from the water pumping sys- tem and heating and refrigeration in the main farmhouse. The water is pumped to a central cistern then piped through- out the island. The farmhouse is 7655 square feet with an attached greenhouse. In addition to housing seasonal wor- kers and being the main gathering place with a large com- munal kitchen, the farmhouse holds multiple freezers and a walk in refrigerator for food storage. Figure 1 shows a
[image:2.595.309.541.584.719.2]map of the island with tidal wind and solar marked. The limited lifespan of the underwater power cable con- necting Rouque to the main utility is the impetus for mi- grating the island community to a self-sustaining grid. An extended timeline allows an incremental approach to be taken. First, energy conservation and efficiency meas- ures reduced overall electricity demand. Second, circuit level energy monitoring equipment was used to identify high demand sources such as a broken well pump. Atten- tion to these loads further reduced island wide demand. Third, investment in sources of renewable energy to off- set electricity demand provided 4.2 kW-installed capacity
of initial solar generation. An added 5.8 kW installed capacity is scheduled for September 2013. Additionally a wind power assessment concluded that a 10 kW system would be both economically and logistically feasible. Finally mechanisms to remotely and dynamically control a finite number of loads were installed.
These initial steps were used as a basis for design of the most efficient smart grid possible.
Subsequent steps of the work are detailed in this paper and include sizing the minimum tidal generation needed and comparing that need against the available resources as well as implementing control mechanisms for load ba- lancing. Both efforts further reducing the required battery storage.
3. System Design
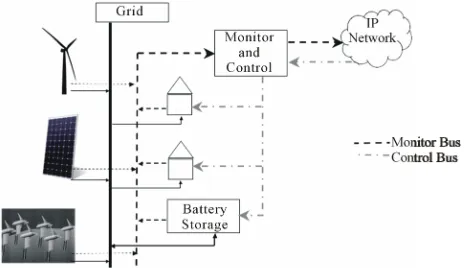
The smart grid system is comprised of renewable energy supply, battery storage, a smart controller, DDR, and a grid tie connection as shown in Figure 2. The smart con-
troller monitors demand and renewable power production then dynamically increases and decreases demand via a select number of dispatchable loads and battery storage. The main utility grid provides and absorbs energy when necessary until 100% renewable energy penetration can be achieved. Losses in the under water cable and low po- wer resale rates are incentives to utilize all locally gener- ated power as well as to limit purchasing power from the electric grid.
[image:3.595.57.289.565.699.2]Aggregating solar and wind energy resources with small tidal power generation significantly improves and simplifies the smart micro grid. The remaining power fluctuations are sufficiently small to be buffered with a limited battery storage unit acting both as spinning re- serves and excess absorption. Battery storage provides flexibility to a micro grid as it allows time shifting be- tween generation and consumption [8]. As a result, DDR can operate on an extended time series, bypassing many of the signal correction and conditioning issues [9] that
Figure 2. The Roque system is comprised of renewable en- ergy supply, battery storage, a smart controller, load bal- ancing capabilities, and a grid tie connection.
accompany fast fluctuations of power caused by turning on and off loads.
The first order system analysis model is calculated us- ing site-specific time series load and resource data. Cir- cuit level power monitoring equipment (Savant Energy Monitor, Savant Systems LLC, Hyannis, MA) provides two years worth of high-resolution energy data for build- ings on the island. Total island demand is monitored on a five second time scale and is 104 kWh per day on aver- age. Energy use on the island peaks from July through September, with a maximum monthly deviation in ener- gy use across a year of 1800 kWh on average.
The Roque micro-grid is designed with 10 kW installed capacity of both solar and wind power. Solar resource data are collected from an onsite small solar rooftop ar- ray (YL240P-29b, Yingli, China). Wind power data is calculated based on actual wind speed data from an ane- mometer at hub height located in close proximity to the proposed turbine site. The micro-grid design is based on distributed solar, wind and tidal generation systems ag- gregated for renewable energy penetration approaching one hundred percent.
The system is designed to limit battery storage to twelve 12-volt 100 AH batteries providing 14,400-watt hours of storage or one eighth of the island daily energy consumption. A full day worth of battery storage would greatly reduce error and increase stability but the size, cost and logistics of transporting and maintaining that much storage is significant. The energy storage efficien- cy with the inverter is 90%. A battery charge controller is used to efficiently charge batteries and control fluctua- tions in power draw and charging cycles. The system is configured such that the battery is charged exclusively by renewable energy sources at no greater than the maxi- mum charge rate. The state of charge (SOC) is instru- mental to the smart controller in determining load bal- ancing.
4. Tidal
The first objective of this work is to quantify the tidal po- wer generation for a non-autonomous Roque Island mi- cro-grid. The results of this investigation will determine if the proposed tidal site on the northeast side of the is- land is sufficient to make investment worthwhile. A tidal resource estimate was determined by weighing average monthly energy demand with proposed solar and wind generation. Analysis is absent of supply from the main utility grid as a further objective is to minimize that in- put.
Figure 3. The monthly demand is not significantly greater than the supply of wind and solar but the timing of renew- ables is inconsistent.
Maximum net energy demand (demand minus supply) is 46.8% while minimum is −36%, indicating an excess of power. Monthly averages for high solar and wind pe- netration grids are insufficient for managing resources absent of significant energy storage due to intermittency in the supply. Day resolution of supply and demand more accurately reflects the requirements of grid management.
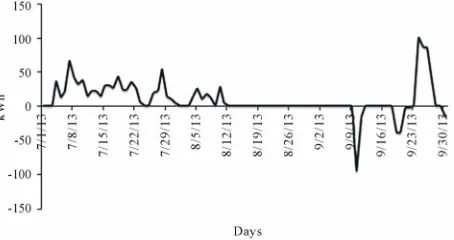
Figure 4 shows daily net energy fluctuations from +127
kWh to −58 kWh for the example month of January 2012, a typical month.
The net difference between average energy demand and energy production from solar and wind results in a median offset from zero of 34.6 kWh as shown in Figure 5. Given a capacity factor of 30% [10] this translates to a
125 kW peak capacity tidal installation. A tidal resource generation of this magnitude would center the demand- supply variability at the optimum match point and move the demand side management requirements towards the load balancing capacity of the system.
Initial rough estimates indicate that a 5 kW system is significantly smaller than is feasible for tidal power gen-eration on the northwest side of the island. The proposed site is 1600 M across, has an average depth of 40’ and a maximum flow of 2 knots. Tidal generators achieve po- wer densities of approximately 8 W/m2 at flow speeds of 2 knots [11]. This corresponds to a tidal generation re- source of 0.33 MW. This resource is comparable to a si- milar site in Kennebec, Maine, which as about same depth and current speeds. That Kennebec site was analy- zed as part of a North American tidal in-stream energy conversion feasibility study and found using very con- servative assumptions to have a resource base of 0.4 MW [12].
5. Simulation Model
A simulation of a smart grid for Roque Island was con-
[image:4.595.308.541.87.210.2]Figure 4. Daily net energy fluctuations for January, a typi- cal month, vary from a maximum of 127 kWh of unmet load to 58 kWh of excess renewable energy supply.
Figure 5. Average monthly net energy without tidal has a median offset from zero of 36.4 kWh. A tidal resource of that size reduces the size of battery storage needed.
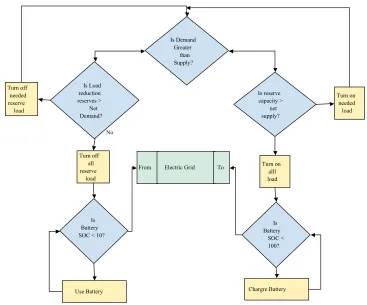
structed using Simulink (version 8.0, Mathworks, Natick MA). The model block diagram is shown in Figure 6.
The model focuses on the largest seasonal supply-demand mismatch periods. Power generation from wind, solar and tidal systems is compared with island electricity de- mand, to predict the net surplus or shortfall of renewable energy generation. That output interfaces with battery storage and adjustable load balancing capacity to ulti- mately provide the amount of excess power or shortfall in power that will be sent to or taken from the electric grid. This information will establish a baseline for the system that can be further improved through increased load management, conservation measures, or adjustments in battery storage and renewable energy supply. For ex- ample, pumped water storage, as a means of absorbing excess power, is advantageous given that water pumping is a significant demand on the system.
[image:4.595.309.541.259.378.2]The system employs a proportional integral (PI) con- troller scheme based on the battery SOC and charge rate to determine optimum demand reductions necessary to meet unrealized supply and maintain battery storage lev- els. Similarly, the system gradually increases demand to capture any surplus of supply for the distributed genera- tors. Loads are dynamically brought on or off line based on a gradual approach to the set point. Figure 7 illustrat-
es a flow chart for the controller. Demand not matched tween power cycles. For example a chest freezer may be
set to turn on if the internal temperature is greater than Tx
and turn off if it is less than Ty with a minimum hold
[image:5.595.89.512.203.380.2]time of Z minutes. The large thermal mass of a freezer, infrequent opening and storing of food and large energy usage makes these freezers a useful DDR load. Additio- nal demand side management can come from pumping water to the central cistern only during peak generation times.
Figure 6. Simulink model for Roque smart grid: power generation from wind, solar and tidal systems is compared with island electricity demand, to predict the net surplus or shortfall of renewable energy generation.
Turn off needed reserve load
Is Load reduction reserves >
Net Demand?
No
Use Battery
Is reserve capacity >
net supply?
Chargre Battery
Turn on needed load Is Demand
Greater than Supply?
Turn off all reserve
load
Is Battery SOC < 10?
Turn on alll load
Is Battery
SOC < 100? From Electric Grid To
[image:5.595.113.480.417.722.2]by load balancing capacity or provided by the battery sto- rage unit is drawn from the grid. Likewise, excess supply, with maximum demand and maximum battery SOC, is absorbed by the grid. This design allows for slower tran- sitions between charging and discharging phases using the battery storage as the system damper. The smart con- troller continuously monitors the magnitude and direc- tion of power at the utility grid penetration point. The system attempts to offset any power through DDR and battery storage.
6. Simulation Results
By fixing all but one input of the system, the smart grid simulation is used to determine the amount of power sent to and from the electric grid as well as the charge and discharge cycles of the battery based on the variation of a single input. In this manner, multiple scenarios can be tested prior to deployment of renewable energy genera- tion. Two sets of simulations were done for this work. First the size of the tidal generation was varied while all other inputs were fixed. Next, the optimum tidal genera- tor size of those simulated was fixed into the model while the size of the load balancing capacity for dynamic demand response of loads was varied.
6.1. Tidal
[image:6.595.313.535.427.537.2]Several tidal turbine sizes were simulated for the micro grid. Smaller generators are modeled for lower cut-in speeds producing a lower power output over longer por- tion of the tidal flow period, while larger turbines are modeled for higher cut-in speeds, resulting in a higher power output but for a shorter portion of a tidal cycle. The simulations are run with a one-hour time scale then summed per day for a three-month period. Inputs to the system include battery storage capacity of 14.4 kWh, so- lar and wind generation each with an installed capacity of 10 kW and the initial anticipated hourly load capacity for the island, 2000 W of hourly load balancing capacity.
Table 1 summarizes the percent of excess generation and
unmet load for these tidal turbines.
Table 1. % grid interaction based on tidal generator.
Tidal size Power generation per cycle energy to grid % renewable % load covered by electric grid
0 0 0 11.6
4 kW 65% 3.3 3.2
6 kW 65% 6.5 1.3
10 kW 65% 13.9 0.3
12 kW 65% 18.6 0.1
30 kW 25% 64.3 0.0
64 kW 25% 81.0 0.0
Without tidal power generation to augment solar and wind power generation, a relatively large amount of po- wer is needed from the grid. Such a scenario would re- quire more than doubling the battery capacity in the sys- tem in order to keep the grid interaction below 5%. As a baseline, Figure 8 shows the power drawn from the elec-
[image:6.595.312.538.575.690.2]tric grid when the island renewable energy portfolio is absent of tidal power. For this scenario a maximum of 11.6% of power is taken from the grid to make up for shortfalls in production.
Table 1 shows that the 4 kW tidal generator provides
the lowest grid interaction. The daily grid interactions for this turbine and the 30 kW turbine are graphed in Figure 9. Positive values represent power taken from the grid
while negative values indicate power sent to the grid. The 4 kW tidal generator requires that the micro grid only take 3.3% of its power from the electric grid and send 3.2% of the total renewable energy generation back to the grid. The 30 kW tidal generator eliminates grid de- pendence but increases the amount of renewable energy generation sent back to the electric grid to 64%. This ex- cess power could be potential income for an island with a suitable underwater cable. However, given the cost of ti- dal energy and transmission losses it is unlikely that the system would justify the additional capital investment. The objective for Roque is to move to war eliminating the cable rather than replacing it, which would be requir- ed with this larger tidal generator.
[image:6.595.56.287.606.736.2]Figure 8. Absent of tidal power the micro grid requires 11.6% of power to come from the main electric grid.
6.2. Dynamic Demand Response
Since the 4 kW tidal generator that provides a modest po- wer output over a longer time provides the lowest grid interaction for the given micro grid configuration, this choice is fixed for the dynamic demand response model- ing to determine the optimum load balancing capacity.
As a baseline, a simulation was run for power interac- tions with the grid absent of load balancing. These results are shown in Figure 10. A maximum of 12.3% of power
is taken from the grid to make up for shortfalls in pro- duction while 2.6% of renewable energy generation is sent back to the grid for the same seasonal period. Hourly power fluctuations to and from the grid peak just over 6000 W, which is consistent with the predicted net sur- plus based on demand, generation sources and battery ca- pacity.
Initial estimates for hourly load balancing capacity for the island is 2000 W. Simulations were run for 2000 W and 3000 W. The results are shown in Figure 11.
[image:7.595.61.288.407.527.2]Simulation using the hourly load balancing capacity for the island of 2000 W requires the micro grid to take 3.2% of its power from the electric grid and send 3.3% of the total renewable energy generation back to the grid. An increase of load balancing capacity to 3000 W reduc- es the power needed from the electric grid to 0.6% and
[image:7.595.58.288.589.709.2]Figure 10. Power interactions with the grid absent of load balancing results in a maximum of 12.3% power taken from the grid while 2.6% of renewable energy generation is sent back to the grid.
Figure 11. Power interactions with the electric grid for hourly load balancing capacities of 2000 W and 3000 W.
the power sent to the grid to 2.5%. These results along with no load balancing are listed in Table 2.
Dynamic demand response will alter load patterns as heating and cooling is bundled around high supply time periods. Combined with the freezers and water pumping the high percentage of dynamic demand response is real- istic for this system. Monitoring of the interface point for the main electric grid will provide real power consump- tion and direction data with a five minute resolution. This monitoring data, fed back into the simulation model to analyze shifts in system power peaks and individual loads, will assist in optimizing load balancing capacity and incrementally reduce the time scale for load manipu- lation.
7. Conclusion
Renewable energy driven micro-grids that can include a tidal power generator of modest size can greatly improve the stability of the grid. If a reasonable portion of the load is interruptible and centrally controlled, the aggre- gation of intermittent renewable resources of solar and wind with a predictable renewable generator can provide the basis for an independent stable grid. The Roque Is-land grid is a living laboratory where demand has been managed with passive monitoring of energy usage on the island [13]. After first reducing demand, performance of small-scale mature renewable technologies like photovol- taics has been evaluated. Controlling the island demand by interrupting loads is operational. The goal of a nearly independent 100% renewable micro-grid now appears to be possible based on models, which include small input from a reliable renewable energy source, tidal energy.
The model results support further investment in the evaluation of the tidal resource by installing flow meters and initiating cost assessment. While tidal energy is a re- latively immature technology [14], it is clear that a rela- tively small tidal resource can have a significant impact on grid stability.
[image:7.595.307.538.669.737.2]The portion of the load, which must be centrally con-trolled to minimize interaction with the utility grid, is re- latively large even for this small grid with comparatively large interruptible loads. The scalability of the results is not clear for applications where interruptible loads such as pumping water to a cistern or cooling large freezers is a smaller portion of energy usage. However when con-
Table 2. % grid interaction based on load balancing capac- ity.
Load balancing % power taken from the grid % renewable energy to grid
0 12.3% 2.6%
2000 W 3.2% 3.3%
sidered on a community scale including heating, cooling, water treatment and other capital intensive energy usage may make a sufficiently large portion of the load inter- ruptible. Regardless of the scale of the general applica- bility of the approach, the combination of more stable re- newable energy sources and demand control has the po- tential to stabilize outlying portions of the grid with high cost to serve. For Roque Island, the benefits are immedi- ate with a reduction in loss over the connecting cable for both purchased and excess power resulting in power cost reductions.
Scaling this work for mainland communities allows community scale smart-grids with high renewable energy penetration to utilize the electric grid as backup storage. This would be an opportunity for green communities to continue experiment with grid related concepts while ha- ving a positive impact on the community through explo- ration of economically promising technologies. Accessi- bility to small scale tidal generation or river hydro-elec- tric resources for these communities will greatly improve the stability of their micro-grid, reduce non-renewable energy usage and increase overall grid stability. While extensive modeling would be required to determine if the impact is significant, it may even be possible to pair re- newable energy sources in this manner with certain types of customers in order to impact overall grid stability for high renewable penetration grids.
8. Acknowledgements
The Maine Space Grant Consortium provided funding for the Roque micro grid research via their Two-Year Re- search and Higher Education Program. Roque manager, Bruce Patterson, and his entire staff were generous and hospitable in providing us access to the island. The sup- port of the board of trustees for this research is greatly appreciated. Over the course of these projects we have benefited from discussion, advice, and support from: Randy Goodhue, Dave Feldman, Sig Eschholz, Michael Shook and Robert Parker.
REFERENCES
[1] S. Solomon, D. Oun, M. Manning, M. Chen, M. Marquee and Intergovernmental Panel on Climate Change, “Cli- mate Change 2007: The Physical Science Basis. Contri- bution of Working Group I to the Fourth Assessment,” Re- port of the Intergovernmental Panel on Climate Change, Cambridge University Press, Cambridge, 2007.
[2] G. M. Shafiullah, A. M. Oo, A. S. Ali and P. Wolfs, “Smart Grid for a Sustainable Future,” 2013.
[3] E. Hart, E. Stoutenburg and M. Jacobson, “The Potential of Intermittent Renewables to Meet Electric Power De- mand: Current Methods and Emerging Analytical Tech- niques,” Proceedings of the IEEE,Vol. 100, No. 2, 2012,
pp. 322-334.
http://dx.doi.org/10.1109/JPROC.2011.2144951
[4] D. Holmberg, “Demand Response and Standards,” BACnet® Today & the Smart Grid—A Supplement to Ashrae Jour- nal, November 2011, pp. 823-828.
[5] A. Scaglia, C. Brocca, G. Torri and VialeSarca, “A Model for the Design and Development of Smart Micro Grids,” 21 WEC World Energy Congress di Montréal in Canada, 2010.
[6] E. Hart, E. Stoutenburg and M. Jacobson, “The Potential of Intermittent Renewables to Meet Electric Power De- mand: Current Methods and Emerging Analytical Techni- ques,” Proceedings of the IEEE, Vol. 100, No. 2, 2012,
pp. 322-334.
http://dx.doi.org/10.1109/JPROC.2011.2144951 [7] Ocean Energy Council, “Tidal Energy,” 2012.
http://www.oceanenergycouncil.com/index.php/Tidal-Ene rgy/Tidal-Energy.html
[8] R. Lassester, “Microgrids and Distributed Generation,”
Journal of Energy Engineering, American Society of Civil
Engineers, Vol. 133, No. 3, 2007, pp. 144-149.
http://dx.doi.org/10.1061/(ASCE)0733-9402(2007)133:3( 144)
[9] Y. Yin, X. Luo, S. Guo, Z. Zhou and J. Wang, “A Battery Charging Control Strategy for Renewable Energy Gene- ration Systems,” IAENGProceedings of the World Con-
gress on Engineering, Vol. 1, 2008, pp. 2-4.
[10] M. Palodichuk, B. Polagye and J. Thomson, “Resource Mapping at Tidal Energy Sites,” 2013.
[11] D. MacKay and D. Cambridge, “United Kingdom: UIT,” 2009. www.withouthotair.com/
[12] G. Hagerman, B. Polagye, R. Bedard and M. Previsic, “Methodology for Estimating Tidal Current Energy Re- sources and Power Production by Tidal In-stream Energy Conversion (TISEC) Devices. EPRI North American Ti- dal in Stream Power Feasibility Demonstration Project,” 2006.
[13] A. Demeo and M. Peterson, “Island Community Smart Grid Utilizing Dynamic Demand Response and Tidal Po- wer for Grid Stabilization. Smart Grid and Renewable Energy,” 2013.