Munich Personal RePEc Archive
Probabilistic game approaches for
network cost allocation
bhakar, Rohit and sriram, V.s. and padhy, Narayana prasad
and gupta, Hari om
20 January 2010
Online at
https://mpra.ub.uni-muenchen.de/29003/
Probabilistic Game Approaches
for Network Cost Allocation
Rohit Bhakar, V. S. Sriram, Narayana Prasad Padhy
, Senior Member, IEEE
, and
Hari Om Gupta
, Senior Member, IEEE
Abstract—In a restructured power market, the network cost is to be allocated between multiple players utilizing the system in varying capacities. Cooperative game approaches based on Shapley value and Nucleolus provide stable models for embedded cost allocation of power networks. Varying network usage neces-sitates the introduction of probabilistic approaches to cooperative games. This paper proposes a variety of probabilistic cooperative game approaches. These have variably been modeled based upon the probability of existence of players, the probability of existence of coalitions, and the probability of players joining a particular coalition along with their joining in a particular sequence. Appli-cation of these approaches to power networks reflects the system usage in a more justified way. Consistent and stable results qualify the application of probabilistic cooperative game approaches for cost allocation of power networks.
Index Terms—Cooperative games, embedded cost allocation, probabilistic games, transmission pricing.
I. INTRODUCTION
A
S the power industry undergoes a restructuring process, competitive open market policies and unbundling of utilities into separate generation, transmission, and distribu-tion companies is in vogue. The restructuring process intends to establish mechanisms to optimize existing resources and guarantee the necessary investments to satisfy future electricity demands at reasonable rates. Transmission and distribution businesses, due to large fixed costs of the network, follow the principle of “economics of scale” and, thus, work in a monop-olistic environment. Hence, regulation is adopted to introduce the proxy effect of competition.An important aspect that reflects competitive policy in any electricity market design is its network pricing model. With the growing complexity of networks and increased number of transactions occurring due to deregulation, development of a fair pricing model has become a contentious issue. Embedded cost of power networks forms a large part as compared to their incremental costs, and hence, needs to be allocated by stable methods. To finance the embedded costs of networks, major thrust has been to devise methods to allocate this cost on the
Manuscript received January 30, 2009; revised April 14, 2009. First published November 24, 2009; current version published January 20, 2010. The work of R. Bhakar was supported by QIP Scheme of AICTE, Government of India. Paper No. TPWRS-00068-2009.
R. Bhakar is with the Electrical Engineering Department, Malaviya National Institute of Technology, Jaipur 302017, India (e-mail: [email protected]). V. S. Sriram is with the Department of Electrical and Computer Engineering, Texas A&M University, College Station, TX 77843 USA (e-mail: srirvs@gmail. com).
N. P. Padhy and H. O. Gupta are with the Department of Electrical En-gineering, Indian Institute of Technology Roorkee, Roorkee, India (e-mail: [email protected]; [email protected]).
Digital Object Identifier 10.1109/TPWRS.2009.2032189
basis of individual network usage patterns [1], [2]. The tra-ditional MW-Mile method is based on the transacted power flow on transmission lines in a network. Among the various usage-based methods, it is difficult to identify the method based on the fairest criterion. These methods may not necessarily pro-vide a stable solution. Fair and stable solutions are necessary to avoid any interest for players to secede the system, that other-wise would lead to an overall un-optimal situation.
Upcoming market situation would have multiple utilities using the network; this situation can be better represented as a game with loads and generators being players in the game. This has induced the application of cooperative game theory for network embedded cost allocation. In a game-theoretic approach, users make rational decisions in a competitive situa-tion, wherein each participant aims at reaching an outcome that is as advantageous to him to the maximum possible extent [3]. Nucleolus and Shapley value (SV) solution concepts have been applied for network embedded cost allocation among the users and provide a stable solution to all participants. Tsukamoto and Iyoda [4] introduced the concept of cooperative game theory for fixed cost allocation to wheeling transactions. Yuet al.[5] presented a Nucleolus and SV-based method for transmission embedded cost allocation for line capacity use. Tan and Lie [6] applied SV for transmission cost allocation. Zolezzi and Rudnick [7] allocated cost of an existing or expanding network based on Nucleolus and SV models. Yuet al.[8] allocated the capacity-use and reliability-based transmission embedded cost using Nucleolus and SV concept. Stamtsis and Erlich [9] found SV formulation to be preferable for fixed cost allocation of power system when the allocation lies inside the core of the game. Bjorndalet al.[10] presented a method for computing the nucleolus of a cooperative game by which usage-based methods may be combined to produce allocations. In an effort to measure the value of playing a particular role in an -person game, Dubey and Weber [11], [12] have described in detail the probabilistic value for games using SV and Banzhaf value.
Despite that the cooperative game-theoretic approaches have been applied for the cost allocation of power networks, the in-herent probabilistic nature of players has not been taken into account. Individual loads and generations keep on varying with time, and some of them may not be connected to the system at all for some duration. It is unrealistic to assume equal usage of net-work by the loads and generators having equal peak capacities. Thus, there is a need to assess the value of playing a particular role in a game, so as to determine an equitable allocation of cost among the players. This also helps in evaluating the future cost to be suffered for using a system. The probability factor for such a cost allocation can be ascertained by accounting for different practical considerations.
The paper develops novel probabilistic models based on Nu-cleolus and SV. These are applied to the power network cost
52 IEEE TRANSACTIONS ON POWER SYSTEMS, VOL. 25, NO. 1, FEBRUARY 2010
allocation problem. The approaches are able to distinguish be-tween players merely connected to the system and those actually using it. Thus, instead of reflecting indicative peak usage only, the models reflect actual network usage and energy usage, which is economically more justified. This provides a fair cost alloca-tion approach to the users as compared to that from non-proba-bilistic models. Also, it helps to understand how the choice of a way to measure game values affects the stability of allocations obtained from the various cooperative -person game models.
II. COOPERATIVEGAMETHEORYCONCEPTS
There are numerous methods for cost allocation among the players of transferable utility cooperative games that allow side payments to be made among the players. The present work is broadly based on the two solution concepts of Shapley value and Nucleolus. These, along with their probabilistic variations, have been described briefly hence.
Let denote the set of all players in a game, being equivalent to . A coalition of players is de-fined as a subset of , that coordinate together. Null set denotes an empty coalition whereas set reflects the grand coalition. The collection of coalitions in is denoted by . The set of coalitions are mutually exclusive and excluding in nature. The game on is a real valued function :
that assigns a worth to each coalition and satisfies . Characteristic value gives the maximum cost incurred by the coalition by coordination or cooperation between its mem-bers, irrespective of what other players and coalitions do [8].
The application of cooperative game theory is to suggest an optimal or a fair allocation of cost among its different players. Cost allocation is represented in terms of a pay-off vector such that for the grand coalition, . For allocation to be optimal and fair to all the players, the following three conditions, namely, individual, group, and global rationalities, need to be satisfied [7]:
(1) (2) (3) (4)
Any pay-off vector satisfying the individual and global ratio-nality conditions is called an imputation, whereas any imputa-tion that satisfies group raimputa-tionality also is said to lie in the core of the game. Individual rationality requires that no player pays more than the cost it would have to pay if the system is designed for his individual use, whereas group rationality ensures that the cost paid by any group is limited to the cost for the group acting alone. Global rationality assumes that the sum of cost to all the
players will be equal to that for the grand coalition.
As cost allocation for any possible combination is less than the sum of individual allocations, all players are incentivized to stay in the coalition, leaving no interest for any player to secede. This makes the solution from such approaches stable. If any of the rationalities is not satisfied, then the cost allocation to a player may not be proportional to its marginal cost. This reflects subsidization, and may create tendencies to disrupt the existing coalitions and form new ones.
A. Probabilistic Values for Games
Let be a probabilistic distribution function over the group of coalitions not containing . gives the prob-abilistic value of the game [11], [12]:
(5)
In this game, participation by can be viewed as consisting merely of joining some coalition , and having to contribute for his marginal contribution to the coalition. If, for each , is the subjective probability that he joins the coalition , then is his expected cost allocation from the game. Both SV and Banzhaf values are instances of probabilistic values.
B. Shapley Value Approach
SV is an a priori value that each entity contributes to the grand coalition in a game with a particular characteristic func-tion [5]. To obtain this, all possible permutafunc-tions are considered. Depending on the order of entry of each player, his net contri-bution to the grand coalition is obtained. Considering all such orders of the players to be equally likely, average of these con-tributions gives SV allocation.
SV, denoted by for a player , assigns to the player a share of the joint cost which is in proportion to the marginal contribution of this player to the grand coalition:
(6) where
coalition excluding ;
coalition obtained by including ; number of entities in the coalition ; total number of players in the game;
characteristic value associated with coalition . First part of the expression (6) gives the probability of a par-ticular player joining that coalition across all orders and the dif-ference part gives the marginal contribution that any particular player makes to the coalition by his joining. SV arises from the belief that the coalition that he joins is equally probable to be of any size ; this is represented as
(7) for all , where .
SV assigns an -vector allocation for every -person game. This value provides an equitable cost allocation wherein the defining property of an allocation is its efficiency, i.e., the sum of individual allocations does not exceed the allocation attained through cooperation of all the players [11], [12]. SV may or may not lie within the core.
C. Nucleolus Approach
Fig. 1. Various cost allocation game algorithm.
A measure of inequality of an imputation for a coalition is defined as the excess
(8)
This excess gives an indication of the amount by which a coalition surpasses its maximum potential in the imputa-tion [8]. Since core is defined as the set of imputations such that , an imputation in this case lies within the core if and only if all the excesses are negative or zero. Coali-tion that objects most to the suggested pay-off vector is the one with the largest excess and, hence, represents its dissatisfac-tion. To obtain Nucleolus, dissatisfaction for every coalition is minimized until the solution becomes fair and acceptable to all the coalitions and individual players. Initially, the largest dis-satisfaction is evaluated and reduced, and thereafter, the next largest dissatisfaction is taken up. This can be solved as a solu-tion of a set of linear programming problems [14].
III. MODELING OFPROPOSEDPROBABILISTICAPPROACHES
The approaches are broadly based on the existence probability of players and coalitions. Existence probability of any player is the probability of that particular player to exist in the up-state in a system. Existence probability of any coalition is the product of existence probabilities of all the players in that coalition. In this paper, four new formulations, viz., probabilistic SV, probabilistic Nucleolus, generalized SV, and Banzhaf value, have been mod-eled for cost allocation. Algorithm for all these approaches is pre-sented in Fig. 1, that will be explained in Section IV. For these approaches, participationofplayers in the game, after considering the probabilities, are scaled to obtain 100% cost allocation. Also, a predefined split in overall cost allocation between the genera-tors and loads is preserved.
A. Probabilistic SV and Probabilistic Nucleolus Approaches
Existence probability of a coalition is defined as the product of existence probabilities of all players in that coalition:
[image:4.594.54.274.65.272.2](9)
Fig. 2. Simple example.
For evaluating probabilistic SV and probabilistic Nucleolus allocations, the characteristic values are evaluated by multi-plying power flow in a line by existence probability of the particular coalition causing that power flow. The so evaluated characteristic values are called the probabilistic characteristic values. After evaluating the probabilistic characteristic values, SV and Nucleolus approaches, as explained in Section II, are used to evaluate the percentage allocations for the line. The so evaluated SV and Nucleolus allocations are termed as probabilistic SV and probabilistic Nucleolus.
Probabilistic SV approach takes into account multiple prob-abilities, first being the existence probability of a coalition and second being the inherent probability of a player joining a coali-tion, as explained in (6). However, probabilistic Nucleolus ap-proach takes into account only the existence probability of a coalition, as remaining calculations are based on dissatisfaction of each coalition.
B. Generalized SV Approach
Generalized SV is a weighted sum of marginal cost arising from the fact that the probability of a player joining a coalition
be calculated as
(10) where are the players already existing in the coalition be-fore the player joins it. The method believes that all orders of players are not equally likely to occur, and thus, their contribu-tion must depend on the existence probabilities of the various players [15].
C. Banzhaf Value Approach
Banzhaf value also assigns an expected marginal allocation to the players. For any individual player , Banzhaf value arises from the subjective belief that a player is equally likely to join any coalition of the size , that is
for all [11], [12]. Thus, for a three-player game, the probability of any player joining a particular coalition is taken equally to be 0.25.
IV. METHODOLOGY
To understand the proposed probabilistic cooperative game models, a two-bus system with two loads and two genera-tors connected by a transmission line, as shown in Fig. 2, is taken for analysis [7]. The peak load and generation values
are ; ; ; and
.
54 IEEE TRANSACTIONS ON POWER SYSTEMS, VOL. 25, NO. 1, FEBRUARY 2010
TABLE I
LINEFLOWS FORVARIOUSCOALITIONS(INMEGAWATTS)
TABLE II
CAPACITY/LOADFACTORS OFPLAYERS
TABLE III
COALITIONEXISTENCEPROBABILITIES
and load factor of loads are assumed as shown in Table II. These factors reflect the probability of players to be in the up-state. A player collaborates and interacts during its up-state to join a game. Thus, these up-state probabilities are also their existence probabilities in the game. For any coalition, the product of ex-istence probabilities of individual players in the up-state (from Table II) gives its coalition existence probability as shown in Table III.
The problem is formulated to allocate the embedded costs of the network over the set of loads and generators connected to it. Loads and generators are represented as players in the game. Rationality considerations would incentivize all the players to join in and form the grand coalition. Thus, for each coalition between loads, all the possible coalitions between generators are taken. The game models discussed hence have been broadly outlined with the help of algorithms in Fig. 1.
Using the line flows in Table I, normal characteristic values for the load and generator cooperative games are obtained as dis-cussed hence. Two streams of calculations are conducted, one each for loads and generators. For the load stream, line flows are multiplied by 0.77 while for the generator stream, they are multiplied by 0.23 to reflect the line flows and hence the cost to be associated to the two types of players. The coefficients 0.77 and 0.23 represent the global split of costs between demand and generation in the system. This creates a new set of line flows. For each load coalition, summation of new line flows across all the generator coalitions provides the characteristic value for that specific case. Similarly, for each generator coalition, sum-mation of new line flows across all the load coalitions provides the specific characteristic value (in Table IV). Normal SV and normal Nucleolus cost allocations (in Table VII) are obtained from normal characteristic values of Table IV, on the basis of SV and Nucleolus calculations, rationalized to their overall al-location percentages.
The probabilistic characteristic values are obtained for the two streams of loads and generators as hence. Original line flows (in Table I) are multiplied by the corresponding existence probabilities (from Table III) of the coalition causing the flow. The resultant line flows are multiplied by 0.77 or 0.23 to obtain the line flows corresponding to the load and generator streams, respectively. For the load coalitions, summation of these new
TABLE IV
CHARACTERISTICFUNCTIONVALUES
TABLE V
MARGINALCOSTALLOCATIONS
TABLE VI PROBABILITYPRODUCTS
TABLE VII
PERCENTAGEALLOCATIONS FORSIMPLEEXAMPLE
line flows over all the generator coalitions gives its character-istic value. Similarly, for the generator coalitions, summation of new line flows over all the load coalitions gives its characteristic value. These values, as shown in Table IV, form the probabilistic characteristic values for the two streams. SV and Nucleolus cal-culations, based on these probabilistic characteristic values, re-sult in probabilistic SV and probabilistic Nucleolus cost alloca-tions (in Table VII).
To obtain generalized SV solution, the normal characteristic values (from Table IV) are used for calculating the marginal change in cost allocation, with the players joining the coalition across all orders. These marginal changes (in Table V) are multi-plied with the product of existence probabilities of those players who have joined the coalition. The coalition players are either all loads or all generators in the up-state, depending upon the cal-culation stream. The products of such probabilities are shown in Table VI.
The sum of products of marginal cost allocation and coalition joining probabilities, rationalized to their overall allocation per-centages, gives generalized SV cost allocations to the players (in Table VII). A calculation similar to that used for obtaining generalized SV is adopted for Banzhaf value solutions, but here the probability of players joining any coalition is taken to be equal, and thus 0.5, across all orders.
V. SIMULATIONS
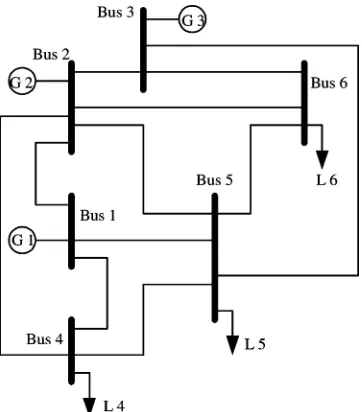
Fig. 3. Six-bus system network.
from [16] and additional assumed data required for optimal power flow (OPF) are provided in Tables VIII and IX. In order to optimize the overall system generation costs, OPF is performed for all these cases. OPF is performed assuming peak load on load buses, as peak load justifies the design of any transmission network. The quadratic cost function
in Table IX represents the cost of active power production by generators. Loads L4, L5, and L6 are assumed to be of 70 MWs each. Table X gives the capacity factor of generators and load factor of the loads connected to the system [17]. The ratio for global cost allocation in the system between generators and loads is assumed as 23%:77% [18].
MATPOWER [19] software is used to perform OPF for dif-ferent coalition combinations of the loads and generators. This provides the line flows for various coalitions. Taking into ac-count the multiple lines that exist in the system, calculations are performed for the complete system.
Load and generator characteristic values developed for the calculation of normal SV, normal Nucleolus, generalized SV, and Banzhaf value are as shown in Tables XI and XII. Similarly, for probabilistic SV and probabilistic Nucleolus approaches, the load and generator probabilistic characteristic values are as shown in Tables XIII and XIV.
SV and Nucleolus calculations based on characteristic values for normal SV/Nucleolus and probabilistic SV/Nucleolus ap-proaches are done using TuGames package [20], an extension of CooperativeGames, a Mathematica package. For generalized SV and Banzhaf value approaches, calculations are performed in EXCEL environment.
To compare the proposed approaches from existing ones in use, MW-Mile method has been used as the base approach. In this method, line cost is allocated to a player by obtaining change in power flow in the line due to that player. The product of change in line flow with the corresponding line length, summed over all the lines, results in overall cost allocation on the basis of MW-Mile method. This method, in a way, reflects peak loading on the system due to players.
VI. RESULTS ANDDISCUSSIONS
For all game-theoretic approaches, percentage cost allocation of individual line is calculated. The product of this allocation
with the line length, summed over all the lines, gives the cost allocation of the whole system to different players. For the com-plete network, cost allocation due to all the approaches under consideration are presented in Table XV.
Cooperative game theory offers multiple solution approaches. Nucleolus and SV differ marginally in their allocations due to the basic difference in their modeling. Nucleolus minimizes the maximum discontent among the players, while SV recognizes the marginal contribution of players when they join a coalition. Cost allocations from probabilistic methods differ from the tra-ditional game-theoretic approaches as they take into account the probabilistic nature of players. Probabilistic SV, generalized SV, and Banzhaf value allocation are variations of normal SV, whereas probabilistic Nucleolus is a variation of normal Nu-cleolus. As we understand, there is no unique solution that can be labeled as best; still it would be prudent to compare the so-lutions with previously used or referred soso-lutions. Allocations have been compared on the basis of two criteria: reflection of usage probabilities and stability.
Generators and loads have been grouped separately for com-parison purposes. As compared to normal SV, probabilistic SV offers a higher allocation to G2, lower to G1 but exceptionally very low to G3. The load probabilities get reflected as higher allocation for L4, a bit lower for L5, and yet, very low for L6 as compared to normal SV allocations. This shows a strong re-flection of the relative usage probability of generators and loads. In comparison to normal SV, generator allocations with gener-alized SV offer an increased allocation for G2, an increase to a lesser extent for G3, while a decrease for G1. Still, it increases largely for L4, decreases slightly for L5, and more drastically for L6, thus strongly reflecting the usage probability. The gen-erator group allocations from Banzhaf value strongly follow the probability pattern but the load group follows it in a weak way. Comparing probabilistic Nucleolus with normal Nucleolus, the allocations largely follow the usage probability pattern of the players involved.
Overall results indicate that generalized SV offers the strongest reflection of the relative usage probability of loads and generators. Almost similar trends are visible for proba-bilistic SV and probaproba-bilistic Nucleolus, despite that they do not follow the relative probabilities in an equally strong way.
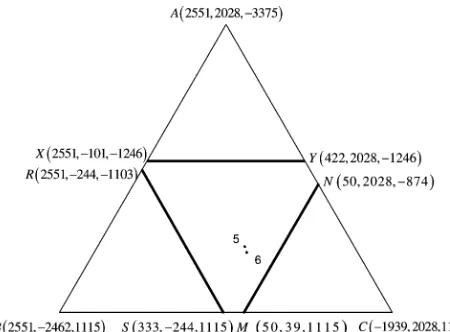
Further, to analyze the stability of results, characteristic values of the complete network are obtained by adding the product of original characteristic values with their corre-sponding line length over all the lines. Cases 1 and 2 in Table XVI correspond to the normal characteristic values for loads and generators, while cases 3 and 4 represent the probabilistic characteristic values for loads and generators, respectively. The imputations for the same, illustrated in barycentric coordinates, are represented by the larger triangles ABC in Figs. 4–7. In the same figures, the enclosed part of three bold lines reflects the core for these cases.
Allocations for the complete system are represented in Table XVII. The grand coalition values of load cases 1 and 3 (from Table XVI) are allocated among the load group players. Similarly, grand coalition values of generator casess 2 and 4 are allocated among the generator group players. The split is done among the load/generator group in the same ratio as indicated in Table XV for the corresponding methods.
56 IEEE TRANSACTIONS ON POWER SYSTEMS, VOL. 25, NO. 1, FEBRUARY 2010
TABLE VIII
LINEDATA OFSIX-BUSNETWORK
TABLE IX
GENERATORDATA OFSIX-BUSNETWORK
TABLE X
CAPACITY/LOADFACTORS OFPLAYERS
TABLE XI
NORMALCHARACTERISTICFUNCTIONVALUES FORLOADS
TABLE XII
NORMALCHARACTERISTICFUNCTIONVALUES FORGENERATORS
TABLE XIII
PROBABILISTICCHARACTERISTICFUNCTIONVALUES FORLOADS
TABLE XIV
PROBABILISTICCHARACTERISTICFUNCTIONVALUES FORGENERATORS
TABLE XV
COMPARATIVEPERCENTAGEALLOCATIONS FORSIX-BUSSYSTEM
them represent the allocations due to these methods, respec-tively. Figs. 6 and 7 represent the probabilistic characteristic values, as used for probabilistic SV and probabilistic Nucleolus approaches, whereas points 5 and 6 in them represent the allo-cations due to these methods, respectively.
Fig. 4. Load imputations and core for normal characteristic values.
Fig. 5. Generator imputations and core for normal characteristic values.
Fig. 6. Load imputations and core for probabilistic characteristic values.
their stronger stability. Similarly, imputation location for prob-abilistic SV, lying consistently away from the core limits, as compared to the imputation location for probabilistic Nucleolus, reflects its stronger stability among the two approaches. But, the small size of the core for both the probabilistic approaches (Figs. 6 and 7) indicates a not-so-strong stability as compared to the other models. Even normal SV and Banzhaf value allo-cations reflect a not-so-strong stability as compared to that of normal Nucleolus allocation.
Fig. 7. Generator imputations and core for probabilistic characteristic values.
TABLE XVI
CHARACTERISTICFUNCTIONVALUES FORCOMPLETESYSTEM
TABLE XVII
ALLOCATIONS FORCOMPLETESYSTEM
TABLE XVIII
STRENGTH OFMODELS
Evaluation of various models on the basis of their strength, as regards a particular criterion, is shown in Table XVIII. Overall comparison shows a weak reflection of usage probability by normal SV and normal Nucleolus. Generalized SV strongly re-flects usage probability, but falls weak on account of stability considerations. Banzhaf value offers an average reflection on both counts. Considering these facts, probabilistic SV and prob-abilistic Nucleolus are understood to offer better overall results.
VII. CONCLUSION
[image:8.594.47.272.454.620.2]58 IEEE TRANSACTIONS ON POWER SYSTEMS, VOL. 25, NO. 1, FEBRUARY 2010
problem. In this work, probabilistic approaches to the cooper-ative games have been modeled and their application to cost allocation has been realized.
Cost allocation of power networks from the traditional coop-erative game approaches is based on peak loading by the players. Actual network usage is reflected by introducing the capacity and load factor of players as their existence probabilities. The methods are used for prospect evaluation of individual players in a probabilistic environment. The results obtained reflect the player usage probabilities and are largely stable. Consistent re-sults validate these approaches and justify their implementa-tion. The resultant pricing structure would rightly incentivize the players to join a coalition at proper locations for overall cost optimization.
Probabilistic cooperative game models would find applica-tions, where presently, the cooperative game approaches are hin-dered due to their seemingly unfairness for not accounting the varying usages by the players.
ACKNOWLEDGMENT
The authors would like to thank Dr. Vishal Kumar, IET Luc-know, and anonymous reviewers for their valuable comments.
REFERENCES
[1] J. W. M. Lima, “Allocation of transmission fixed charges: An overview,”IEEE Trans. Power Syst., vol. 11, no. 3, pp. 1409–1418, Aug. 1996.
[2] Y. R. Sood, N. P. Padhy, and H. O. Gupta, “Wheeling of power under deregulated environment of power system—A bibliographical survey,”
IEEE Trans. Power Syst., vol. 17, no. 3, pp. 870–878, Aug. 2002. [3] H. P. Young, “Cost allocation,” inHandbook of Game Theory, R. J.
Au-mann and S. Hart, Eds. Amsterdam, The Netherlands: Elsevier Sci-ence, 1994, vol. 2, pp. 1193–1235.
[4] Y. Tsukamoto and I. Iyoda, “Allocation of fixed transmission cost to wheeling transactions by cooperative game theory,”IEEE Trans. Power Syst., vol. 11, no. 2, pp. 620–629, May 1996.
[5] C. W. Yu, A. K. David, and Y. K. Wong, “The use of game theory in transmission embedded cost allocation,” inProc. 5th Int. Conf. Ad-vances in Power Systems Control, Operation and Management, Hong Kong, 2000, pp. 139–143.
[6] X. Tan and T. T. Lie, “Application of the Shapley value on transmission cost allocation in the competitive power market environment,”Proc. Inst. Elect. Eng., Gen., Transm., Distrib., vol. 149, no. 1, pp. 15–20, Jan. 2002.
[7] J. M. Zolezzi and H. Rudnick, “Transmission cost allocation by coop-erative games and coalition formation,”IEEE Trans. Power Syst., vol. 17, no. 4, pp. 1008–1015, Nov. 2002.
[8] C. W. Yu, A. K. David, C. T. Tse, and C. Y. Chung, “Capacity-use and reliability based transmission embedded cost allocation with temporal considerations,”Int. J. Elect. Power Energy Syst., vol. 25, pp. 201–208, 2003.
[9] G. C. Stamtsis and I. Erlich, “Use of cooperative game theory in power system fixed-cost allocation,”Proc. Inst. Elect. Eng., Gen., Transm., Distrib., vol. 151, no. 3, pp. 401–406, May 2004.
[10] E. Bjorndal, G. C. Stamtsis, and I. Erlich, “Finding core solutions for power system fixed cost allocation,”Proc. Inst. Elect. Eng., Gen., Transm., Distrib., vol. 152, no. 2, pp. 173–179, Mar. 2005.
[11] R. J. Weber, “Probabilistic values for games,” inThe Shapley Value: Essays in Honor of Lloyd S. Shapley, L. S. Shapley and A. E. Roth, Eds. Cambridge, U.K.: Cambridge Univ. Press, 1988, pp. 101–120.
[12] P. Dubey and R. J. Weber, Probabilistic Values for Games, Cowles Foundation Disc. Papers 471, Cowles Foundation, Yale Univ., 1977. [Online]. Available: http://cowles.econ.yale.edu/P/cd/d04b/d0471.pdf. [13] D. Schmeidler, “The nucleolus of a characteristic function game,”
SIAM J. Appl. Math., vol. 17, no. 6, pp. 1163–1170, Nov. 1969. [14] L. Krus and P. Bronisz, “Cooperative game solution concepts to a cost
allocation problem,”Eur. J. Oper. Res., vol. 122, pp. 258–271, 2000. [15] I. Parrachino, A. Dinar, and F. Patrone, Cooperative Game Theory
and Its Application to Natural, Environmental, and Water Resource Is-sues: Application to Water Resources, World Bank Policy Research, Working Paper no. 4074 Nov. 2006. [Online]. Available: http://ssrn. com/abstract=946833.
[16] A. J. Wood and B. F. Wollenberg, Power Generation, Operation, and Control. Singapore: Wiley, 2003, p. 112.
[17] R. F. Ghajar and R. Billinton, “Economic costs of power interrup-tions: A consistent model and methodology,”Int. J. Elect. Power En-ergy Syst., vol. 28, no. 1, pp. 29–35, Jan. 2006.
[18] The Statement of the Use of System Charging Methodology, Issue 3, Revision 1, U.K., National Grid plc, 2007.
[19] MATPOWER Version 3.0b4. (2005, Jan.). A MATLAB Power System Simulation Package by PSERC. Ithaca, NY, Cornell Univ. [Online]. Available: http://www.pserc.cornell.edu/matpower/matpower.html. [20] H. I. Meinhardt, TuGames v1.1 beta, MATHEMATICA Package, 2004.
[Online]. Available: http://library.wolfram.com/infocenter/Math-Source/5709/.
Rohit Bhakarreceived the B.E. degree in electrical engineering from M.B.M. Engineering College, Jodhpur, India, and the M.Tech. degree in power system engineering from Malaviya National Institute of Technology (MNIT), Jaipur, India.
After a year with Rajasthan State Electricity Board, he joined MNIT in 1999 as an Assistant Professor. Presently on leave from MNIT, he is a research scholar at the Indian Institute of Technology Roorkee, Roorkee, India.
V. S. Sriramreceived the B.Tech. degree in electrical and electronics engi-neering from the Government Engiengi-neering College, Thrissur, India, and the M.Tech. degree in system engineering and operations research from Indian Insti-tute of Technology Roorkee, Roorkee, India. He is currently pursuing the Ph.D. degree at Texas A&M University, College Station.
Narayana Prasad Padhy(SM’09) was born in India. He received the Ph.D. degree in power systems engineering from Anna University, Chennai, India, in 1997.
He is working as a Professor in the Department of Electrical Engineering, In-dian Institute of Technology (IIT) Roorkee, Roorkee, India. During 2005–2006, he worked as a Research Fellow in the Department of Electronics and Elec-trical Engineering, University of Bath, Bath, U.K., under BOYSCAST Fellow-ship from the Government of India. Currently, he is on leave and working as a Research Fellow in the Department of Electrical and Computer Engineering, Ryerson University, Toronto, ON, Canada. His research interests are in power systems analysis, pricing, economics, and optimization.
Hari Om Gupta(SM’03) received the B.E. degree in electrical engineering from the Government Engineering College, Jabalpur, India, and the M.E. degree in systems engineering and operation research and the Ph.D. degree from the University of Roorkee, Roorkee, India.