http://dx.doi.org/10.4236/ojmsi.2016.42006
How to cite this paper: Zhang, Y.L., Zhang, S., Zhang, X.X. and Li, Z.P. (2016) The Optimal Investment Strategy Based on the DEA Model. Open Journal of Modelling and Simulation, 4, 46-54. http://dx.doi.org/10.4236/ojmsi.2016.42006
The Optimal Investment Strategy Based on
the DEA Model
Yulei Zhang, Shuai Zhang, Xinxin Zhang, Zhenping Li
* School of information, Beijing Wuzi University, Beijing, ChinaReceived 20 March 2016; accepted 23 April 2016; published 26 April 2016
Copyright © 2016 by authors and Scientific Research Publishing Inc.
This work is licensed under the Creative Commons Attribution International License (CC BY). http://creativecommons.org/licenses/by/4.0/
Abstract
The Goodgrant Foundation is a charitable organization that wants to improve education perfor-mance of undergraduates attending colleges and universities in the US. So the foundation plans to contribute a total of US 50 million for a suitable team of schools per year under the condition of avoiding repeated other large grant organizations’ investment. The DEA (Data Estimate Analysis) model is developed to determine an optimal investment strategy for the Goodgrant Foundation. In this paper, two questions were solved: how to choose a suitable team of schools and how to allo-cate the investment. Before the establishment of the model, the EXCEL software is used to prepro-cess data. Then the DEA model which includes two models in the paper is developed. For the first question, the CCR model is established to rank schools which used efficiency from DEAP 2.1. For the second question, the resource allocation model is established to allocate investment amount by weights of allocation from MATLAB software. Accordingly, the optimal investment strategy is received for the Goodgrant Foundation. Through the analysis above, 23 from 293 schools are se-lected to invest. Then the schools are ranked and the investment of US 50 million for 23 schools is allocated.
Keywords
The DEA Model, Optimal Investment Strategy, DEAP 2.1 Software
1. Introduction
closely related to the development of country. So many charitable organizations dedicate to donations to im-prove educational performance.
Zhang and Guo [1] proposed a new model to measure the relative efficiency of the assessed DMU (Decision Making Unit) through analyzing its disadvantages based on DEA model and compare the DMUs’ efficiency rates and give their order. Li and Zuo [2] established the optimal investment bilevel programming models of prior development colleges as well as that of indiscriminate investment in all colleges and given the optimal in-vestment scheme of both upper and lower level. Cai [3] introduced the higher education evaluation model of in-vestment benefit based on DEA, collected a university’s data according to the time series and conducted empir-ical research investment benefit from 2001 to 2009. Ma [4] analyzed Inner Mongolian University’s scientific and technological input-output efficiency quantitatively applying generalized data envelopment analysis method. Gan [5] built input-output index of the Graduate School, screened index based on the factor analysis and DEA methods to analysis panel data. Juan [6] proposed a series of DEA models to accommodate settings where non- homogenous sub-units operate in parallel network structures with intermediate measures or links. Chang [7] de-veloped a new type of DEA model referred to as intertemporal DEA model that can be used to fully measure a firm’s efficiency by explicitly considering its key inputs and outputs involving the past-present-future time span. Fuentes [8] analyzed the productivity growth of the SUMA tax offices located in Spain evolved between 2004 and 2006 by using Malmquist Index based on Data Envelopment Analysis (DEA) models. Merkert [9] applied two-stage Data Envelopment Analysis (DEA) models to estimate a single efficiency measure that combines the potentially conflicting indicators of perceived service quality and profitable for the airport context. Li [10] re- estimate the TFEE (Total-Factor Energy Efficiency) using an improved DEA model, which combines the super- efficiency and sequential DEA models to avoid “discriminating power problem” and “technical regress”, and then used it to calculated the TEI (target for energy intensity). Adel [11] proposed an alternative DEA model for centrally imposed resource or output reduction across the references set and determined the amount of input and output reduction needed for each DMU to increase the efficiency score of all the DMUs.
The Goodgrant Foundation is a charitable organization that wants to improve educational performance of un-dergraduates attending colleges and universities in the US. So the Foundation plans to contribute 50 million money for a suitable team of schools per year under the condition of avoiding repeated other large grant organi-zations’ investment.
To do this, two questions are solved for the Goodgrant Foundation: how to choose a suitable team of schools and how to allocate the investment. In order to solve the two questions, the DEA model is established to deter-mine an optimal investment strategy, including the selection of schools and determination of investment amount. In this process, DEAP software and MATLAB software are used to solve the questions we face.
2. The DEA Model
2.1. Assumptions
Before solving the questions above, some assumptions are made as follows:
1) Since the period of education investment return is long, only one cycle is considered.
2) Assume that the paper does not consider the school’s ownership such as Public, Private nonprofit and Pri-vate for-profit is not considered.
3) Assume that the wages of students after graduation directly reflected in the return on investment. 4) Assume that the school’s all indicators are static.
2.2. The Essential Definitions
Let us consider a set of DWUs,
{
DWUj: j=1, 2,,n}
, where DWUj consumes multiple positive inputs ( 1, 2, , )ij
x i= m to produce multiple positive outputs yrj(r=1, 2,, )s . Suppose that inputs and outputs for j
DMU are denoted by
(
1,
2,
,
)
T j j j mj
x
=
x
x
x
and ( 1 , 2 , , )Tj j j sj
y = y y y , and xj >0 , yj >0 for 1, 2, ,
j= n. DMU0 =DMUj0 is the evaluated unit, whose input vector and output vector are respectively recorded as x0 =xj0 and y0 =yj0. Let ( ,1 2, , )T
m
v= v v v , where v ii( =1, 2,, )m is the weight with regard to the ith input and ( , , , )T
2.3. The CCR Model
DEA (Data Environment Analysis) [12] is a nonparametric technique for measuring the relative efficiencies of a set of decision-making units (DMUs) which consume multiple inputs to produce multiple outputs. Nowadays, DEA has become increasingly popular for efficiency analysis in practical viewpoint of management, economics, especially the education. So it is meaningful and necessary to apply DEA model in this question.
There exist various DEA models with different economic meanings. The CCR model is chosen in this paper, CCR model which measures the efficiency is the first model of DEA displayed as follows.
0 1 0 0 1 1 1 max
1, 1, 2, , . .
, 0, 1, 2, , ; 1, 2, ,
s r r r m i i i s r rj r m i ij i i r u y h v x u y j n s t v x
v u i m r s
= = = = = ≤ = ≥ = =
∑
∑
∑
∑
(1) where0 0, 0 0.
r rj ij i
y =y x =x (2) Due to the fractional programming model, the model is reformed into a linear programming model to solve as follows. 0 1 1 1 0 1 max
0, 1, 2, ,
. 1
, 0, 1, 2, , ; 1, 2, ,
s
r r P r
s m r rj i ij r i m i i i r i y V
y w x j n
s t w x
w i m r s
µ µ µ = = = = = − ≤ = = ≥ = =
∑
∑
∑
∑
(3) where 0 1 1 m i i i r r i i t v x tu w tv µ = = = = ∑
(4)The fractional programming and linear programming are equivalent [13]. The dual problem of Equation (3) is as follows.
0 0 0 1 0 1 min . .
0, 1, 2, ,
, 0 D n j j j n j j j j V
x s x
Both Equation (3) and Equation (5) have the optimal solution, and the optimal value VD =VP ≤1 [13]. If the optimal solutions are λ0=
(
λ λ10, 20,,λn0)
T,s0−,s0+,θ0, some conclusions are obtained as follows: 1) If the optimal value of Equation (5) is θ =0 1 and s0−=0,s0+ =0,0
j
DMU is DEA efficiency. It means that the inputs and outputs of each DMUreach the optimal state.
2) If the optimal value of Equation (5) is θ =0 1, DMUj0 is weak efficiency.
3) If the optimal value of Equation (5) is θ <0 1, DMUj0 is under have no efficiency. It regard as the inputs and outputs of each DMU does not reach the proper ratio.
2.4. The Resource Allocation Model
According to the CCR model, an equivalent change is made on the first equation of the model [14].
1 1
s m
k k
r rk k r rk
r r
u y θ v x
= =
=
∑
∑
(6)For the DMUk, right hand side of the equation is denoted as follows:
1
, 1, 2, ,
m k k k r rk
r
T θ v x k n =
=
∑
= (7)where k represents the kth DMU, Tk represents the overall size of the kth DMUand it is equal to the product of the scale and efficiency. So we can construct each of DMUin the allocation plan as follows:
1 2
1 1 1
, , , n
n n n k k k k k k
T T T
T T T
= = =
∑ ∑
∑
(8)
3. DEA Model to the Goodgrant’s Investment Strategy
3.1. Data Preprocessing
Because the formats of the data are various and missing values are different, the data should be preprocessed to avoid inaccuracy and instability caused by redundant data in the data mining. Firstly, the irrelevant or redundant data are deleted to make dimensionality reduced. For example, the name of schools are omitted, the schools’ official website and other characters data are not considered. Secondly, the reasonable data are used to deal with missing values. For example, the plural are used to fill the scalar data such as the index “LACALE “in the data and the mean value of no missing values is used to fill the numerical data.
To be clear, the EXCEL software is used to manipulate the data by the approaches we discussed above. Fi-nally, some appropriate inputs and outputs are chosen. Through the data preprocessing and simple analysis, eight key factors are chosen: 6 inputs and 2 outputs. The DMUs are denoted as schools. After the data prepro-cessing, the number of schools decreased from 293 to 23. The inputs and outputs considered are asTable 1.
3.2. Establishment of the CCR Model and Resource Allocation Model
The CCR model is as follows:
0 23 0 0 1 23 0 1 min . .
0, 1, 2, , 23
, 0 D j j j j j j j V
x s x
The allocation model is as follows:
1
, 1, 2, , 23
m k k k r rk
r
T θ v x k =
=
∑
= (10)23
1 2
23 23 23
1 1 1
, , ,
k k k k k k
T T T
T T T
= = =
∑ ∑
∑
(11)
According to our analysis, the variables in the model are n=23,m=6,s=2, and then use some software to solve the model.
3.3. Solving the Case
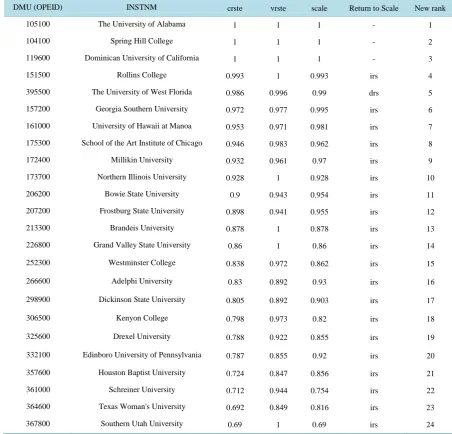
1) School ranking. The software DEAP 2.1 is used to implement CCR case of DEA. Owing to the data, the efficiency scores are got according to the DEA model. Then the schools are ranked according to the efficiency scores. So the schools are sorted by “crste” in the below chart. The degression of scale benefits show investment will not increase efficiency. So schools that are in the condition of scale benefit degression are deleted. Finally, the schools based on the overall efficiency are re-ranked. And the results are listed asTable 2.
2) Allocation of investment. Firstly, v=
(
v v1, 2,,vm)
T is got from solving the CCR model, where(
1, 2, ,)
i
v i= m is the weight with regard to the ith input. Then the EXCEL is used to obtain the weights of allocation, allocate investment amount for schools we identified. The results are asTable 3.
3.4. Results
After a series of analysis, the optimal investment strategy is obtained. The efficiency of schools is measured with the DEA model, and the efficiency scores are used to rank schools. Then, the investment amount is allo-cated based on the rank and weights of allocation solved by DEA model. So the Goodgrant Foundation can make optimal strategy for future educational investment.
4. Sensitivity Analysis
If the efficiency remains unchanged, but the inputs increase (∆xl), how much should the outputs of the DMU increase (∆yl)? To formulate the question, the inverse DEA model is established to carry on the sensitivity analysis. The inverse DEA model is as follows:
Table 1. Inputs and outputs.
Inputs
LOCALE (Locale of institution)
SAT_AVG (Average SAT equivalent score of students admitted)
UGDS (Enrollment of undergraduate degree-seeking students)
NPT4_PUB (Average net price for Title IV institutions (public institutions))
NPT4_PRIV (Average net price for Title IV institutions (private for-profit and nonprofit institutions))
PCTPELL (Percentage of undergraduates receiving pellgrants)
Outputs
md_earn_wne_p10 (Median earnings of students working and not enrolled 10 years after entry)
Table 2. The efficiency and rank.
DMU (OPEID) INSTNM crste vrste scale Return to Scale New rank
105100 The University of Alabama 1 1 1 - 1
104100 Spring Hill College 1 1 1 - 2
119600 Dominican University of California 1 1 1 - 3
151500 Rollins College 0.993 1 0.993 irs 4
395500 The University of West Florida 0.986 0.996 0.99 drs 5
157200 Georgia Southern University 0.972 0.977 0.995 irs 6
161000 University of Hawaii at Manoa 0.953 0.971 0.981 irs 7
175300 School of the Art Institute of Chicago 0.946 0.983 0.962 irs 8
172400 Millikin University 0.932 0.961 0.97 irs 9
173700 Northern Illinois University 0.928 1 0.928 irs 10
206200 Bowie State University 0.9 0.943 0.954 irs 11
207200 Frostburg State University 0.898 0.941 0.955 irs 12
213300 Brandeis University 0.878 1 0.878 irs 13
226800 Grand Valley State University 0.86 1 0.86 irs 14
252300 Westminster College 0.838 0.972 0.862 irs 15
266600 Adelphi University 0.83 0.892 0.93 irs 16
298900 Dickinson State University 0.805 0.892 0.903 irs 17
306500 Kenyon College 0.798 0.973 0.82 irs 18
325600 Drexel University 0.788 0.922 0.855 irs 19
332100 Edinboro University of Pennsylvania 0.787 0.855 0.92 irs 20
357600 Houston Baptist University 0.724 0.847 0.856 irs 21
361000 Schreiner University 0.712 0.944 0.754 irs 22
364600 Texas Woman's University 0.692 0.849 0.816 irs 23
367800 Southern Utah University 0.69 1 0.69 irs 24
Notes: crste is the Overall efficiency; vrste is the True technical efficiency; scale is the Scale efficiency; rts is the Scale Report, irs is increase, - is constant; drs is decrease.
Table 3.The school investment table.
OPEID efficiency weight investment
105100 1 0.004152 $207,600
104100 1 0.004152 $207,600
119600 1 0.004152 $207,600
151500 0.99 0.0041229 $206,145
157200 0.97 0.0040358 $201,790
161000 0.95 0.0039569 $197,845
[image:6.595.89.537.576.722.2]Continued
172400 0.93 0.0038697 $193,485
173700 0.93 0.0038531 $192,655
206200 0.9 0.0037368 $186,840
207200 0.9 0.0037285 $186,425
213300 0.88 0.0036455 $182,275
226800 0.86 0.0035707 $178,535
252300 0.84 0.0034794 $173,97
266600 0.83 0.0034462 $172,310
298900 0.81 0.0033424 $167,120
306500 0.8 0.0033133 $165,665
325600 0.79 0.0032718 $163,590
332100 0.79 0.0032676 $163,380
357600 0.72 0.0030061 $150,305
361000 0.71 0.0029562 $147,810
364600 0.69 0.0028732 $143,660
367800 0.69 0.0028649 $143,245
(
)
(
)
(
)
(
)
(
)
1
1
1
T 1 2
T 1 2
max
0, 1, 2, , . .
0, 0 , 0, 0
, , , , 1, 2, ,
, , , , 1, 2, ,
s l k k k
n
l l k k l l l
k n
l l k k l l
k
k
l l
k k k k
m
k k k k
s a y
x x x s x x
y y y s y y
k n
s t
x s s
x x x x k n
y y y y k n
λ λ θ
λ λ
λ
λ θ
=
− =
+ =
+ −
∆
+ ∆ + + = + ∆
+ ∆ + − = + ∆
≥ =
∆ ≥ ≤ ≤ ≥ ≥
= =
= =
∑
∑
∑
(12)
Then we can select ak
(
k=1, 2,,s)
according to the specific circumstances.5. Conclusions
To deal with the investment strategy problem for the Goodgrant Foundation, the DEA model is used to deter-mine an optimal investment strategy in this paper. And two questions are solved about how to choose a suitable team of schools and how to allocate the investment. The CCR model is used to rank schools which use efficien-cy from DEAP 2.1 in order to solve the first question. Then, the resource allocation model is established to allo-cate investment. Finally, the optimal investment strategy is obtained for Goodgrant Foundation.
Acknowledgements
This work was supported by the National Natural Science Foundation of China (71540028, F012408), and Ma-jor Research Project of Beijing Wuzi University. Beijing Key Laboratory (NO: BZ0211), Beijing Intelligent Lo-gistics System Collaborative Innovation Center.
References
[1] Zhang, J. and Guo, Y. (2004) A Comprehensive DEA Model Based on Advantages and Disadvantages Analysis. Jour- nal of Southwest China Normal University (Natural Science Edition), 29, 358-360.
[2] Li, X. and Zuo, L. (2004) High Education Optimal Investment Bilevel Programming Models on Strategy of Prior De-velopment. Journal of Shandong University, 39, 35-46. (In Chinese)
[3] Cai, X. (2011) Evaluation of an Investment Benefit of Higher Education Based on DEA Model. Academic Dissertation, Harbin Engineering University. (In Chinese)
[4] Ma, Z. (2014) Analysis on Scientific and Technological Input-Output Efficiency of Inner Mongolian University Based on DEA Model. Academic Dissertation, Mongolian University, 93, 11-34. (In Chinese)
[5] Gan, C. (2014) Study of Input-Output Efficiency Evaluation of Universities—As an Example to Graduate Universities. Academic Dissertation, Southwest Jiaotong University. (In Chinese)
[6] Du, J. (2015) DEA for Non-Homogenous Parallel Networks. Omega, 56, 122-132.
http://dx.doi.org/10.1016/j.omega.2014.10.001
[7] Chang, T. (2015) Past-Present-Future Intertemporal DEA Models. Journal of the Operational Research Society, 66, 16-32. http://dx.doi.org/10.1057/jors.2013.139
[8] Fuentes, R. (2015) Smoothed Bootstrap Malmquist Index Based on DEA Model to Compute Productivity of Tax Of-fices. Expert Systems with Applications, 42, 2442-2450. http://dx.doi.org/10.1016/j.eswa.2014.11.002
[9] Merkert, R. and Assaf, A. (2015) Using DEA Models to Jointly Estimate Service Quality Perception and Profitability- Evidence from International Airports. Transportation Research Part A, 75, 42-50.
http://dx.doi.org/10.1016/j.tra.2015.03.008
[10] Li, K. and Lin, B. (2015) The Improvement Gap in Energy Intensity: Analysis of China’s Thirty Provincial Regions Using the Improvement DEA Model. Energy, 84, 589-599. http://dx.doi.org/10.1016/j.energy.2015.03.021
[11] Adel, H. (2015) A Common-Weights DEA Model for Centralized Resource Reduction and Target Setting. Computer & Industrial Engineering, 79, 195-203. http://dx.doi.org/10.1016/j.cie.2014.10.024
[12] Ghobadi, S. and Jahangiri, S. (2015) Inverse DEA: Review, Extension and Application. International Journal of In-formation Technology & Decision Making, 14, 805-824. http://dx.doi.org/10.1142/S0219622014500370
[13] Wei, Q., Zhang, J. and Zhang, X. (2000) An Inverse DEA Model for Inputs/Outputs Estimate. European Journal of Operational Research, 121, 151-163. http://dx.doi.org/10.1016/S0377-2217(99)00007-7
Appendix
MATLAB Program
clear;formatshortg X = load('c:\x.txt'); Y = load('c:\y.txt');
n = size(X',1); m = size(X,1); s = size(Y,1); A = [-X' Y'];
b = zeros (n, 1);
LB = zeros(m + s, 1); UB = []; for i = 1:n;
f = [zeros (1, m) -Y(:,i)']; Aeq = [X(:,i)' zeros(1,s)]; beq = 1;
w(:,i) = LINPROG(f, A, b, Aeq, beq, LB, UB); E(i, i) = Y(:,i)'*w(m + 1:m + s,i);
end