Water temperature of Alpine
streams in response to
discharge and radiation
By
George Charles Pea
A thesis submitted for the degree of Master of Science
School of Environment and Life Sciences
University of Salford
UK
Abstract
Contents
Abstract i
List of tables iv
List of figures v
Acknowledgements ix
Declaration x
1 Introduction 1
1.1 Background . . . 1
1.2 Climate change in the Alps . . . 3
1.3 Glacier albedo . . . 5
1.3.1 Stream albedo . . . 5
1.4 Biological processes . . . 6
1.5 Chemical Processes . . . 7
1.6 Aim . . . 8
1.7 Thesis outline . . . 9
2 Controls on stream temperature 10 2.1 Introduction . . . 10
2.2 Stream temperature and flow regimes . . . 10
2.3 Energy inputs . . . 14
2.4 Predicting stream temperature . . . 15
2.5 Morphology of glacial rivers . . . 16
2.6 Overview . . . 17
2.7 Hypotheses and objectives . . . 17
3.2 Selection of study area . . . 19
3.3 Data acquisition . . . 21
3.4 Data analysis . . . 22
4 Results 23 4.1 Annual trends . . . 23
4.2 Diurnal variation . . . 43
5 Discussion 50 5.1 Seasonal trends . . . 50
5.2 Diurnal trends . . . 54
5.3 Stream morphology and topography . . . 55
5.4 Future implications . . . 56
6 Conclusion 61 6.1 Future regimes and further research . . . 62
List of Tables
3.1 Basin characteristics of the chosen study area, basin area (%) and basin glaciated (%). . . 20
4.1 Mean radiation (W m−2) in Zermatt for the period 2003-2012. 24 4.2 Monthly percentage of total radiation and discharge for the
year 2012. . . 24 4.3 Statistics of hourly discharge (m3s−1) of Massa for the period
2003-2012. . . 25 4.4 Statistics of hourly water temperature (◦C) of Massa for the
period 2003-2012. The minimum temperature has not been included due all the observed years experiencing minima of 0◦C . . . 26 4.5 Monthly minimum, maximum, range and standard deviation
of water temperature (◦C) for the months March- October 2012. 34 4.6 Annual total discharge (106 m3) for the years 2003-2012 and
the daily total of discharge from the day at which water tem-perature begins to decrease from the annual peak. With the percentage of the annual total added. . . 38 4.7 Total discharge (106m3) from the January 1 up until the day
List of Figures
1.1 Retreat of Gornergletscher. Bottom image 1880s, top 2014 (source: World View of Global Warming, 2015). . . 2 1.2 Annual temperature anomalies (◦C) between 1901 and 2004
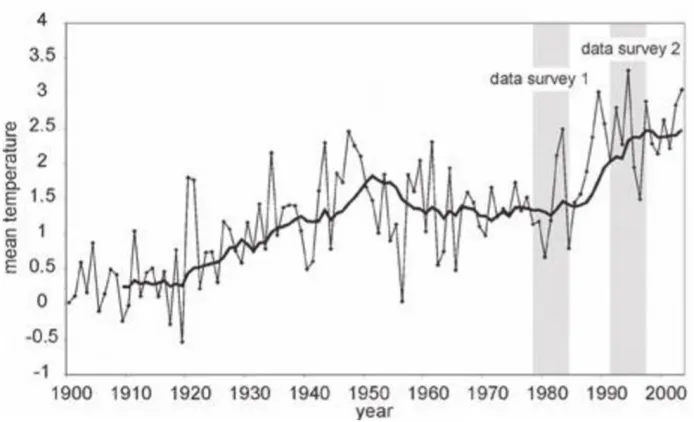
in Switzerland and the Northern Hemisphere (Rebetez and Reinhard, 2008). . . 4 1.3 Annual Swiss Alps mean air temperatures (◦C) for the period
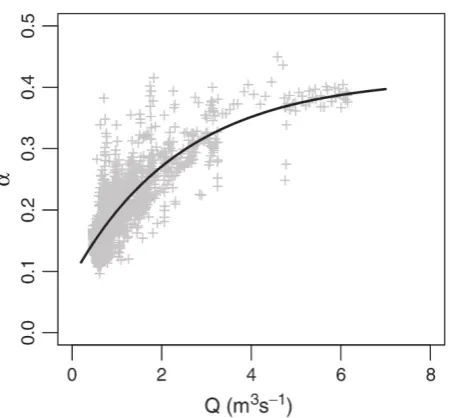
1900-2003 (Zemp et al., 2006). . . 4 1.4 Relationship between discharge (m3s−1) and albedo (α) in a
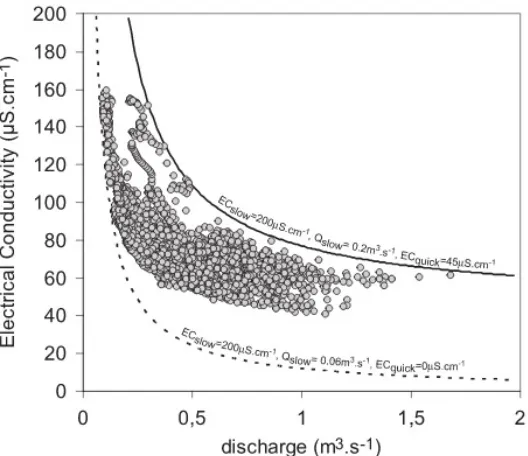
proglacial stream draining from Place Glacier, Canada (Han, 1997). . . 6 1.5 Relationship between electrical conductivity (uS/cm) and
dis-charge (m3s−1)in a proglacial Alpine stream (Dzikowski and Jobard, 2012). . . 8
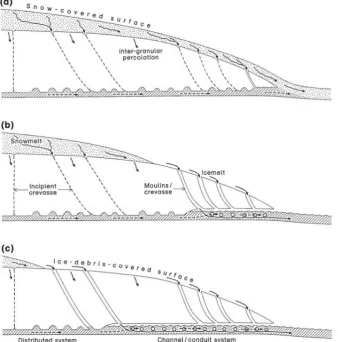
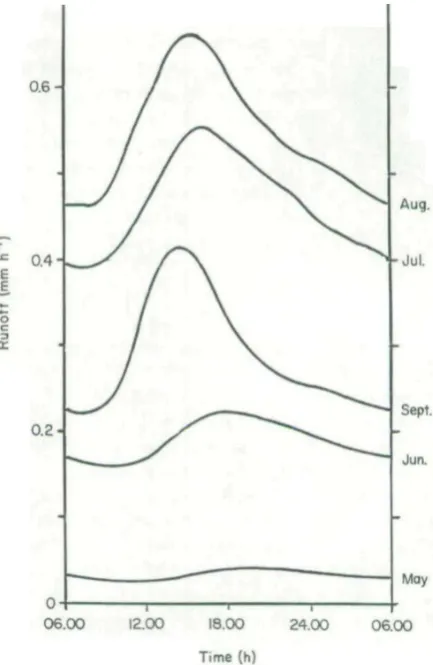
2.1 Development of subglacial drainage system (a) May-June, (b) July and (c) August-September (Brown, 2002). . . 12 2.2 Average diurnal runoff (mm h−1) curves for 5 months of a
glacial river in the Austrian Alps (Milner & Petts, 1994). . . . 13 2.3 Factors controlling stream temperature, black arrows
repre-senting associations with water exchanges (Moore et al., 2005). 15
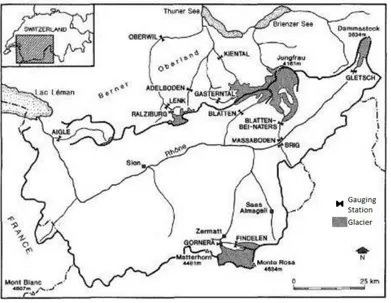
3.1 Map of Switzerland with Aletschgletscher basin and gauging locations. Zermatt also shown (Collins & Taylor, 1990). . . 21
4.1 Seasonal variation of discharge (m3s−1) as the black series and
water temperature (◦C) as the blue series of the Massa for the years 2003 (a) to 2012 (j). . . 32 4.2 Seven day average of Massa water temperature (x20 ◦C) in
blue, Zermatt radiation (W m−2) in red and discharge (m3s−1)
4.3 Daily average of hourly water temperature (◦C) in blue and discharge (m3s−1) in black for the Massa between the Julian
days 91 and 152, 2012. . . 35 4.4 Daily average of hourly shortwave radiation (W m−2) with
li-nes added to highlight the increase of radiation over the period between the Julian days 91 and 152, 2012. . . 36 4.5 Daily average of hourly water temperature (◦C) in blue and
discharge (m3s−1) in black between the Julian days 91 and
152, 2003-2012. . . 37 4.6 Daily average of hourly shortwave radiation (W m−2) between
the Julian days 91 and 152, 2003-2012. . . 38 4.7 Hourly variations of discharge (m3s−1) (black) and water
tem-perature (◦C) (blue) between the Julian days 285 and 298, 2012. . . 40 4.8 Hourly variations of radiation (W m2) (red) and water
tem-perature (◦C) (blue) between the Julian days 110 and 117, 2012. . . 41 4.9 Hourly variations of radiation (W m2) (red) and water
tem-perature (◦C) (blue) between the Julian days 150 and 158, 2012. . . 42 4.10 Hourly variations of discharge (m3s−1) between the Julian days
110 and 117, 2012. . . 42 4.11 Hourly variations of discharge (m3s−1) between the Julian days
150 and 158, 2012. . . 43 4.12 Hysteresis plots of the hourly diurnal variation of water
tem-perature (◦C) and discharge (m3s−1). Each graph at weekly
intervals between the dates 14 May and 4 June 2012. 14 May (A), 21 May (B), 28 May (C) and 4 June (D). . . 45 4.13 Diurnal variation of water temperature (◦C), discharge (m3s−1)
and shortwave radiation (W m−2), for 26 April 2012. . . . . . 47
4.14 Hysteresis plots of shortwave radiation (W m2) and water tem-perature (◦C) for the dates 26/04/2012 (a) and 03/07/2012 (b). Key times and arrows added to indicate temporal variation. 48 4.15 Hysteresis plot of diurnal variation of water temperature (◦C)
and discharge (m3s−1) for 14 May 2012 of the Massa, with the
direction of the series represented by the arrows. . . 49
5.2 Plot of the hourly discharge (m3s−1) and water temperature (◦C) for Massa 2012. . . 54 5.3 Satellite image of the upper reach of Massa demonstrating
areas of topographical shading 04/10/2009 (GoogleEarth, 2017). 56 5.4 Annual mean temperature (◦C) in Switzerland from 1864 to
2015. Shown are the mean values of the individual years (black) and the smoothed curve (red) (Meteosuisse, 2016). . . 57 5.5 Schematic diagram of the transient snowline movement
deter-mining the proportion of the basin that receives snowfall or rain (Collins, 1998). . . 58 5.6 Schematic diagram of the relationships between energy input,
water temperature and discharge in a river draining from an Alpine glacier (Collins, 2009). . . 59 5.7 Thought experiment to show how temperature increases through
Acknowledgements
Firstly I wish to express my deepest gratitude to the late Professor David N. Collins whom without it would not have been possible to complete my studies. His enthusiasm and dedication to the study of Alpine environments is what motivated me to remain at the University of Salford and continue my studies under his guidance. I am forever thankful for the memories and friendship shared with David.
Declaration
This is to certify that the copy of my thesis, which I have presented for consideration for my postgraduate degree embodies the results of my own course of research, has been composed by myself and has been seen by my supervisor before presentation.
1
Introduction
1.1
Background
Air temperature in the European Alps has risen by a mean annual total of 2◦C during the 20th century, which is approximately twice the warming rate of the northern hemisphere annual average (Gobiet et al., 2014). The primary impact of this increased warming is the retreat of Alpine glaciers; an estimated 50% of the original glacier volume has vanished since the end of the Little Ice Age in 1850 (Wegmann et al., 1998). This is of great concern as more than one-sixth of world’s population rely on glaciers/ seasonal snow packs for their fresh water supply (Barnett et al., 2005). Figure 1.1 shows an example of the extent to which Alpine glaciers have retreated between the 1880s and the present decade. The particular glacier in the example is Gornergletscher.
Knowledge concerning the impacts of climate change on Alpine hydrology and the dynamics of proglacial streams is key to the understanding of water quality and future implications of glacial retreat. High mountainous stre-ams are ideal study areas for the effects of climate change on water quality due to these systems having little to no human interference and reflect an almost complete natural river system. Water temperature is a major fac-tor of stream quality. Numerous physical, chemical and biological processes in aquatic systems are driven by temperature (Brown and Hannah, 2008). Stream temperature has a major control on aquatic habitat due to it’s influ-ence on species distributions, dissolved oxygen concentrations and the growth and also the development rate of organisms (Webb et al., 2008). Hari et al.,
tem-Figure 1.1: Retreat of Gornergletscher. Bottom image 1880s, top 2014 (source: World View of Global Warming, 2015).
perature in Alpine basins and the sharp decline of brown trout populations in Western European streams. Findings such as these show how crucial wa-ter temperature is on the quality of aquatic habitats. As well as a major water quality parameter, stream temperature is also a key indicator of the water source as each has specific thermal characteristics (Brown et al., 2006). Irrespective of discharge, meltwater exits the glacier around 1◦C; however, warming downstream is driven by energy input and flow. Proglacial streams have displayed fast responses to meteorological forcing making water suscep-tible to changes downstream (Magnusson et al., 2012) and radiation fluxes account for more than 70% of heat input. With the exception of shaded stre-ams radiation is the primary driver of summer water temperature variability and therefore stream albedo has the potential to be a significant influence on heat inputs. Shortwave radiation increases with altitude due to the reduction of clouds, ozone, aerosols and air molecules and as a result the Alps possess one of the highest UV radiation levels in Europe (Schmucki and Philipona, 2002).
flow in bouldered channels where water becomes increasingly aerated.
1.2
Climate change in the Alps
The Alps are highly sensitive to climatic warming in comparison to the rest of the Northern Hemisphere. Figure 2.1 compares the annual temperature anomalies in Switzerland and the northern hemisphere between 1901- 2004. Monthly mean temperatures were gathered from 12 weather stations in Swit-zerland and then homogenised (Rebetez and Reinhard, 2008). From 1980 there is a clear period of enhanced warming in both data sets however the Swiss series has an accelerated rate of increase. Gehrig-Fasel et al., (2007) highlighted this accelerated warming through the analysis of measurements from 24 MeteoSuisse weather stations situated between 1650-2450m, Figure 2.2 shows the annual mean temperatures (◦C) steadily increasing from 1900 through to 2003 the bold black line representing the 10 year mean. There are a variety of fluctuations during this period with a general pause from 1960-1980 before there is a steep increase. This thesis focuses on measurements acquired only between 2003-2012, this period is too short to display any long time temperature changes.
Figure 1.2: Annual temperature anomalies (◦C) between 1901 and 2004 in Switzerland and the Northern Hemisphere (Rebetez and Reinhard, 2008).
[image:15.595.117.464.430.641.2]1.3
Glacier albedo
Climatic warming in the Swiss Alps has resulted in a decrease of snow days (Ceppi et al., 2012; Marty, 2008; Scherrer et al., 2004). The amount of snowfall in the winter months determines the temperature and duration of the following spring and summer due to the SAF effect. Surface albedo within the basin increases with a higher amount of snowfall. If the previous winter was mild, experiencing reduced snowfall, water temperatures are expected to be lower in the following months. This occurs as the ablation season will begin earlier due to less snow reflecting incoming radiation and increasing the rate of glacier ice melt. Furthermore the higher and sooner the transient snowline rises the longer and larger area of ice and snow there is to melt therefore increasing runoff. Additionally as the snowline elevation increases the greater the area in which precipitation falls as rainfall increases (Collins, 1998; 2009).
1.3.1
Stream albedo
Figure 1.4: Relationship between discharge (m3s−1) and albedo (α) in a
proglacial stream draining from Place Glacier, Canada (Han, 1997).
1.4
Biological processes
Proglacial streams are a severe environment highly characterised by the se-diment load and water temperature. Steffan (1971) outlined that habitats in rivers sourced from glaciers are considerably different from other fresh water habitats and he therefore placed them in a distinct biotope termed kryal. Water temperature has the influence to render the river catchment a suit-able habitat for native species. The control temperature has on biological processes is immense, as it directly influences physiology, metabolic rates of aquatic species and the nutrient cycle process (Fisher, 1995). As previously discussed in section 1.1, there has been a noticeable correlation between the catchment of brown trout in Western European Alpine rivers and rising air temperatures in the late 20th century. Hari et al., (2006) discussed that due to water temperatures increasing, brown trout have declined as habitats are being pushed upstream to cooler climates; however this movement has been blocked by typical Swiss Alpine streams on average possessing 1-2 vertical barriers with drops of 15cm or more every 100m. This loss of habitat is a ma-jor contribution to their population decline and displays the fragile nature of aquatic habitats when water temperature changes (Hari et al., 2006).
micro-organisms such as bacteria dominated biofilms (Battin et al., 2001; Rott et al., 2006). These aquatic lifeforms also have a specific range of temperature that they can survive and so any change in this can restrict their habitat. Alpine proglacial stream discharge levels are directly influenced by the meteo-rological conditions, therefore with climate change the river thermal patterns will be altered affecting the sensitive biota (Poole and Berman, 2001). It is expected that with the retreat of glaciers in the long term, stream tempera-tures will increase the composition of particles in the stream and the nutrient cycle rate (Milner et al., 2010).
1.5
Chemical Processes
Proglacial streams have three principal water sources with their own chemi-cal and thermal characteristics. These sources include precipitation, ice/snow melt and groundwater. Glacier fed streams have high levels of suspended se-diment and solutes. Solute in the runoff is acquired from the atmosphere in the form of precipitation, dry deposition and from chemical weathering of subglacial and ice marginal rock (Bundi, 2009). Such reactions include sulphide oxidation and carbonation (Brown et al., 1994). Electrical con-ductivity is an efficient method of establishing the solute concentration of rivers, thus the system from which the particular discharge has originated. Discharge sourcing from groundwater flow has a higher temperature than glacier melt and is solute rich due to an increased residence time with the underlying geology (Singh and Hasnain, 2002). Snow-packs influence Alpine river basins to a high extent by controlling peak stream discharge in the early summer due to retainment of meltwater in the ablation zone. Runoff resulting from snow-pack melt has a generally low level of suspended sedi-ment and a low temperature. In contrast glacier/ ice melt hosts a large level of sediment yields which have been flushed out from newly exposed subgla-cial sediment (Bundi, 2009). The final source for Alpine proglasubgla-cial streams is precipitation. The chemical characteristics of this include a poor solute level and a high temperature.
concentration than snow and ice melt. Understanding water sources of Al-pine streams and rivers is key especially in regions such as Switzerland that depend on hydropower for much of their energy. High solute concentration can affect these dam systems by eroding components such as turbines and depositing sediment, disrupting the mechanical processes of the dams. Wil-liams et al., (2016) expressed the importance of understanding the solute concentration of rivers through models so as to predict the extent of ero-sion in the hydroelectricity dam component. This knowledge is critical when determining whether a catchment is viable for an efficient hydroelectricity scheme or not.
Figure 1.5: Relationship between electrical conductivity (uS/cm) and dis-charge (m3s−1)in a proglacial Alpine stream (Dzikowski and Jobard, 2012).
1.6
Aim
1.7
Thesis outline
This thesis is over six chapters. Chapter 1 comprises seven sections, the pri-mary focus of the chapter is the introduction and background of the current understanding. The chapter concludes by outlining the aim and hypothesises of the thesis.
2
Controls on stream
temperature
2.1
Introduction
This chapter will address the controls on stream temperature and the typi-cal thermal and flow regimes of an Alpine proglacial stream using research from previous studies. There are numerous factors that control stream tem-perature including albedo, meteorological parameters, stream morphology, level of discharge and water source. Flow regimes in glacierised basins are strongly controlled by the glacier therefore the process of the drainage system of Alpine glaciers has been explored.
2.2
Stream temperature and flow regimes
Stream temperature is a primary water quality parameter but the study of interaction between stream temperature and flow is limited (Constantz, 1998). In the Alps climate change is the main factor affecting water quality but not the only factor with land use evolution, deforestation and other hu-man activities also contributing to the degradation of water quality (Delplaprecipitation, groundwater exchanges, discharge and solar radiation. Alpine proglacial streams often possess stretches of water with large surface area to volume ratios and therefore reflect high diurnal variations in stream tempe-rature due to greater rate of penetration from solar radiation (Constantz, 1998). Large seasonal variations in stream temperature are also to be ex-pected due to the wide range of solar radiation and air temperature regimes that Alpine environments possess.
Flow regimes in glacierised catchments are strongly controlled by the glacier mass balance when basins are 20%+ glaciated. The generation of discharge from snow and ice melt generally is inverse to flow regimes of temperate flu-vial environments as maximum flow occurs in summer when precipitation is lowest (Brown, 2002; Fountain and Tangborn, 1985). The volume of water in the proglacial stream determines the length of time available for heat ex-changes as a higher volume of water increases velocity, which would therefore reduce interaction time a parcel of water has with the surrounding environ-ment (Brown et al., 2006). There is a great variation of discharge seasonally with lower levels in the winter months due to glacier accumulation and pre-cipitation in the form of snow in contrast to spring and summer with high discharge from the ablation period and precipitation falling as rain (Huss
et al., 2008). Groundwater possesses a higher temperature than meltwater and so increased groundwater contributions to Alpine streams result in hig-her water temperatures, particularly in the winter and early spring when meltwater contribution is low (Milner et al., 2009).
runs off almost immediately into the subglacial passages. Towards the end of summer, discharge decreases as the supply of subglacial and englacial water has been drained (Benn & Evans, 2014).
Figure 2.1: Development of subglacial drainage system (a) May-June, (b) July and (c) August-September (Brown, 2002).
Austrian Alps (Milner & Petts, 1994). This basin is 84% glaciated which is significantly higher than the basin selected for the area of study in this thesis; these curves display a clear transformation of runoff levels from May to August with little diurnal variation in May to a significant one in September. Daily discharge peaks often lag behind air temperature peaks by up to a few hours (in the later ablation season) due to the distance meltwater has to travel through the subglacial drainage system (shown in Figure 2.1). This lag time is extended in periods when the glacier is still covered with snow such as spring and the early months of summer as Figure 2.1(a) displays (Benn & Evans, 2014).
2.3
Energy inputs
For many mountain glaciers shortwave radiation flux is the main energy in-put for ablation (Wagnon et al., 1999). This is greater for glaciers that have been retreating for sometime with the exposure of side moraines which de-posit dust and debris on the glacial ice reducing the surface albedo, which is the case with most glaciers in the Alps (Oerlemans et al., 2009). Shortwave radiation drives the biological and physical processes at the earth’s surface while atmospheric components (aerosols, CO2, ozone, water vapour etc)
in-teract with solar shortwave radiation by scattering or attenuating depending on the concentration of gas and particulate matter in the atmosphere; such interactions result in atmospheric heating or re-radiated energy in the form of longwave radiation. Shortwave radiation peaks at solar noon in contrast to longwave radiation which remains relatively constant (Lowney, 2000).
Recent studies on glacierised basins have revealed the complex thermal beha-viour of proglacial streams (Brown et al., 2006; Cadbury et al., 2008; Webb
et al., 2008). Solar radiation is a crucial environmental factor in Alpine wa-ter due to the natural increase of ultraviolet radiation flux with elevation (Sommaruga, 2001). Figure 2.3 shows a schematic view of factors controlling stream temperature with the black arrows representing energy fluxes associ-ated with water exchanges (Moore et al., 2005). There is limited vegetation in the proglacial area to obstruct incoming solar radiation, then the only shading will be the topography or cloud cover. Topographical shading is a major influence on proglacial streams in the Alps due to the steep banks and narrow valleys that are typical in the region. Latitude also is a key factor in-fluencing shading as Canton Valais is situated at 46.1905◦ latitude therefore the angle of the sun is fairly acute. Water exits the portal of Aletschgletscher at <1◦C (Collins, 2009), as the water flows downstream from the terminus through the proglacial field it is heated by solar radiation. Heat transfer within river systems is complex, additional energy exchanges that influence proglacial stream temperature include: channel friction, groundwater flow, condensation, evaporation, bed heat conduction and air temperature (Cais-sie, 2006).
Glacier, Alaska in the summer of 2006 resulted in net shortwave radiation and stream bed friction occupying ca.70% of the total thermal input to the stream (Chikita et al., 2010).
Figure 2.3: Factors controlling stream temperature, black arrows represen-ting associations with water exchanges (Moore et al., 2005).
2.4
Predicting stream temperature
The use of models that predict or simulate stream temperatures is beco-ming increasingly important. There are two categories of water temperature models; statistical and deterministic. Statistical models are relatively simple and require minimal data inputs while deterministic models require numerous input data such as depth and velocity (Benyahya et al., 2007). An example of a simple energy balance equation is presented in Box 1 (Magnusson et al., 2012). The equation describes the downstream change of temperature 4
T(◦C) over a stream reach length L(m) and average width w(m). Q (W m
−2) is the heat flux across the stream surfacec (J kg−1 K−1) the specific heat
capacity of the water, p (kg m−3) the water density. 4 z (m) the change of
altitude from upstream reaches to downstream, gravitational acceleration g
(m s−2), stream discharge as q (m3s−1) and residual temperature change as
Box 1
4T(t)= Q(t)w(t)
q(t)
L cp +
g4z
c +4Tr(t)
This equation predicts how temperature will change on a stream reach as a result of surface heat transfer and frictional heating. Surface heat exchange cools and warms the stream at a rate proportional to the heat flux, the length of the stream and average width, and inversely proportional to dis-charge (Magnusson et al., 2012). Models predicting water temperature from glaciers with a negative mass balance are proving to be of greater impor-tance as thermal and flow regimes are expected to be altered (Collins et al., 2013).
2.5
Morphology of glacial rivers
Fluvial processes of glacier-fed streams are characterised heavily by mor-phology. Typically the proglacial stream channel is braided in the outwash plain due to the high sediment load flushed from the glacier and aggrada-tion; these channels migrate laterally across the valley floor (Milner & Petts, 1994). Hickin (1993) suggests that fluvial hydrosystems of glacial rivers have three stages of progression:
1. Highly unstable, braided form, steeply graded and possesses a high width to depth ratio;
2. Wandering type with irregular sinuous, laterally mobile, often with secondary channels separated by vegetated islands;
3. Relatively stable with a meandering single channel, high sinuosity and a reduced width to depth ratio.
greater in wide shallow streams and less in narrower, deep streams. There-fore stream bed friction will be more dominant in stages 1 and 2 (Milner & Petts, 1994).
2.6
Overview
Previous studies expressed the complexities of proglacial streams and the basin’s sensitivity to climatic warming (Cadbury et al., 2008; Collins, 2009; Webb et al., 2008). Shortwave radiation is the primary energy input of pro-glacial streams and is a controlling factor of runoff and water temperature however there is limited research on the diurnal and seasonal variation of water temperature; discharge and their responses to radiation fluctuations. Alpine glaciers are in a period of accelerated retreat in response to increasing air temperatures. Understanding the seasonal and annual thermal characte-ristics of Alpine proglacial streams is important. The Alps have displayed a significant response to climate change therefore the thermal regimes across the seasons and years are to be observed as the effects temperature has on the quality of water in terms of habitats and biota but also the dependency that the region has on glacial and snow-pack melt as a fresh water source for agriculture, industry, consumption and hydroelectric purposes.
2.7
Hypotheses and objectives
The objectives of the thesis are as follow;1. To analyse the diurnal, seasonal and annual variations of stream tem-perature and discharge in a year of high recorded shortwave radiation levels.
2. To identify the level of flow in which stream temperature decreases.
3. To assess the control shortwave radiation has on stream temperature.
4. To understand why water temperature decreases in late spring and early summer when radiation peaks.
The hypotheses for the thesis are listed below.
2. Discharge is the primary control on alpine stream temperature.
3
Methodology
3.1
Introduction
The primary control of stream temperature will be identified through radia-tion, water temperature and discharge measurements. It would be expected that as solar radiation levels peak during the ablation season, water tempe-rature would also peak. The ablation season shall be under close scrutiny in order to understand the transforming relationship between water tempera-ture and discharge as radiation rises.
3.2
Selection of study area
Table 3.1: Basin characteristics of the chosen study area, basin area (%) and basin glaciated (%).
River Basin area (km2) Basin glaciated (%)
Massa 195 65.9
the Alps have shown; such as the period of advance in the 1920s and 1980s (Jouvet et al., 2011).
The climatic conditions in the Matter valley have a continental character with low precipitation and high-radiation budgets (Randin et al., 2009). Average annual precipitation is only approximately 475 mm, which is one of the lowest in Switzerland. This low precipitation is due to the valley surrounded by high peaks that often exceed 4,000m a.s.l. in elevation (Hill, 2012). Canton Valais therefore is extremely reliant on glacial melt as a fresh water source thus studying the quality of this water and the forces controlling it is highly important.
The river Massa draining from Aletschgletscher is the primary focus of the study. Aletschgletscher is the largest glacier in the Alps with the basin measuring 195km2, 65.9% of which is glaciated. The gauging station in which
the water temperature and discharge measurements derive is situated 1458m a.s.l. (2.4km from the glacial portal), which is the lowest point of the basin that ranges up to Aletschhorn at 4194m a.s.l. The mean annual runoff (1957-2005) of the basin is 2.112m (Collins, 2008). The river is approximately 7km long and passes through the Massa gorge and onwards into the Rhone.
The basin areas (km2) and total glaciated area of the basin (%) for the study
Figure 3.1: Map of Switzerland with Aletschgletscher basin and gauging locations. Zermatt also shown (Collins & Taylor, 1990).
3.3
Data acquisition
and discharge.
3.4
Data analysis
The years 2003-2012 are analysed since there are complete and continuous annual records of radiation, water temperature and discharge measurements. Hourly measurements of discharge at Massa were processed into annual data sets for the calendar years 2003-2012 by manually selecting and separating data recorded into different years. Annual trends are analysed by calculating the mean, maximum, minimum and standard deviation of water temperature and discharge in order to assess trends between the parameters. This method of analysis has been used by Brown et al., (2006). Annual mean radiation will be analysed to signify the years with the highest and lowest totals. An objective is to analyse seasonal runoff and thermal regimes of the Massa, which is achieved by hydrographs of water temperature and discharge similar to those of Collins (2009); however both parameters are plotted on the same graph for a clearer illustration of potential relationships. The year 2012 is chosen to analyse seasonal, diurnal and daily measurements in depth as this is the most recent year with complete data available. Moreover previous studies have not analysed a year as recent as 2012. Seasonal radiation also is analysed, however this has high hourly fluctuations and therefore is processed into a series of weekly means so it can be compared with discharge and temperature.
4
Results
Annual, seasonal and diurnal analysis of radiation, discharge, water tempe-rature from the Massa river are presented in this section.
4.1
Annual trends
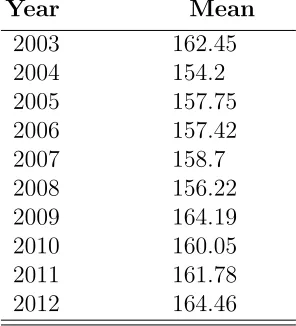
Table 4.1: Mean radiation (W m−2) in Zermatt for the period 2003-2012.
Year Mean
[image:35.595.221.369.157.320.2]2003 162.45 2004 154.2 2005 157.75 2006 157.42 2007 158.7 2008 156.22 2009 164.19 2010 160.05 2011 161.78 2012 164.46
Table 4.2: Monthly percentage of total radiation and discharge for the year 2012.
Month % of total annual discharge % of total annual radiation
January 0.24 2.98
February 0.16 5.89
March 0.53 9.28
April 0.89 10.45
May 5.62 12.65
June 19.93 13.05
July 25.98 12.84
August 28.72 11.57
September 12.18 8.49
October 4.24 5.89
November 0.68 3.67
December 0.37 2.49
precipitation falling primarily as snow. Maximum discharge occurs through the months June-September known as the ablation period. Table 4.2 shows the percentage of the total annual discharge for each month in 2012 from the Massa, it has a typical flow regime of an Alpine glacial basin as 86.8% of the annual total discharge was in four months; June, July, August and September with the winter months accounting for less than 10% of annual runoff. August was the highest with 28.72% of the years discharge, February the lowest with 0.16%. Mean annual water temperature for the years 2003 to 2012 are show in Table 4.4. With the exception of 2010 there is a trend of years with higher discharge possessing lower water temperatures. The year 2003 demonstrates this relationship having the highest average discharge and also the lowest average water temperatures.
Table 4.3: Statistics of hourly discharge (m3s−1) of Massa for the period
2003-2012.
Year Mean Min Max Std. Dev.
Table 4.4: Statistics of hourly water temperature (◦C) of Massa for the period 2003-2012. The minimum temperature has not been included due all the observed years experiencing minima of 0◦C
Year Mean Max Std. Dev.
2003 0.89 4.28 0.51 2004 0.92 4.4 0.54 2005 0.92 4.32 0.55 2006 1.22 2.81 0.62 2007 1.18 4.41 0.57 2008 1.21 5.02 0.55 2009 1.15 4.89 0.53 2010 1.07 3.88 0.51 2011 0.93 3.82 0.46 2012 0.98 4.62 0.52
The seasonal hydrographs of water temperature (blue) and discharge (black) are shown on Figure 4.1 for the years 2003 (a) to 2012 (j). There is a similar pattern throughout the years with water temperature peaking between the Julian days 92 and 133. Figure 4.1 (j) displays the hourly data taken from the Massa, which illustrates the seasonal relationship between discharge (black) and water temperature (blue) over 2012. The hourly measurements for 2012 have been processed into seven day averages as seasonal trends for water temperature and discharge are to be analysed with radiation; which has a high diurnal range therefore this seven-day average smooths out the series for a clearer, clean observation. There is a clear apparent seasonal relationship between discharge and water temperature which can be identified throughout the years. Typically discharge is low during the winter months until the late ablation period where it rapidly increases from 7.35 m3s−1 in to the peak
Figure 4.1: Seasonal variation of discharge (m3s−1) as the black series and
water temperature (◦C) as the blue series of the Massa for the years 2003 (a) to 2012 (j).
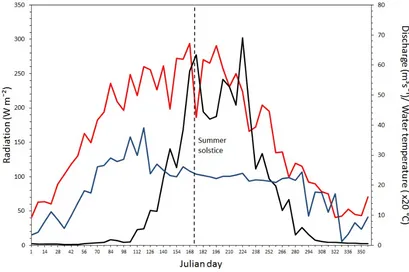
Figure 4.2: Seven day average of Massa water temperature (x20 ◦C) in blue, Zermatt radiation (W m−2) in red and discharge (m3s−1) in black of the year
2012 with the dashed line representing the summer solstice.
The monthly maximum, minimum, range and standard deviation of water temperature (◦C) for March-October 2012 for the Massa have been processed from hourly measurements (Table 4.5). The lowest maximum temperatures occur in June, July and August, which are regarded as the peak of the ablation season due to the highest temperatures. Additionally, these months host the lowest range which signify little diurnal variation in temperature. The highest maximum temperature and range occur in April, which is in the early ablation season; temperature and radiation have only begun to increase. With the range being so high this shows the month possesses a high diurnal variation in water temperature. This month shall be under close observation to analyse the diurnal variation between water temperature, radiation and discharge.
in the week of the summer solstice which in 2012 was 20 June. In comparison, discharge has a greater rate of increase seasonally than radiation, with levels staying around the winter minima until mid-April in which the increase be-gins. Radiation however has a gradual rise beginning late January, with the seasonal curve clearly evident. A lag-time exists between these two parame-ters with the highest radiation values occurring prior to the peak discharge. Furthermore discharge is still climbing during the summer solstice and does not reach its peak until approximately 50 days later. Peak discharge for this year occurs when radiation is on the decrease, which shows that there is not an immediate response from discharge to radiation.
Table 4.5: Monthly minimum, maximum, range and standard deviation of water temperature (◦C) for the months March- October 2012.
Month Max Min Range Std. Dev.
March 2.79 0.14 2.65 0.47 April 4.62 0.53 4.19 0.61 May 2.35 0.5 1.84 0.37 June 1.68 0.85 0.83 0.15 July 1.57 0.75 0.82 0.14 August 1.73 0.78 0.95 0.18 September 1.74 0.64 1.11 0.2 October 2.12 0 2.12 0.42
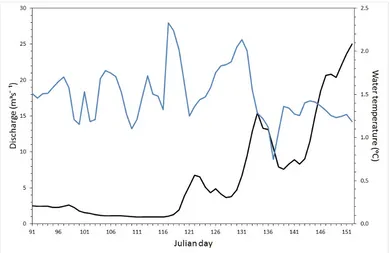
An objective was to understand why water temperature decreases in the period when radiation is high. Water temperatures surge during the early ablation season. Figure 4.3 shows the daily average water temperature and discharge between the Julian days 91 and 152, which have been selected as this is the period in which discharge increases from its winter minima. In the period between days 91 and 116 there are large fluctuations in water temperature, but here in contrast discharge varies little and remains at a low level. Discharge begins to rise from the days 117 to 122, in response average daily water temperature decreases from 2.33◦C to 1.25◦C in just a period of 4 days. The trend is repeated as rising discharge shows a potential relationship with decreasing water temperatures; however temperature incre-ases as discharge decreincre-ases from the peak on Julian day 122, average daily discharge decrease from 6.78 m3s−1 to 3.67 m3s−1 on day 128, in the same
to decrease as discharge continues to rise. Average daily radiation for the same period is shown in Figure 4.4, while there is much daily variation there is a clear steady increase as the added lines show. There does not appear to be a correlation with water temperature as expected.
Figure 4.3: Daily average of hourly water temperature (◦C) in blue and discharge (m3s−1) in black for the Massa between the Julian days 91 and
Figure 4.4: Daily average of hourly shortwave radiation (W m−2) with lines added to highlight the increase of radiation over the period between the Julian days 91 and 152, 2012.
In order to determine if the trends in Figures 4.3 and 4.4 were consistent for all the years between 2003-2012 the same analysis is demonstrated in Figure 4.5 and 4.6 but this has been produced with the hourly measurements for all the years 2003-2012 averaged to form a daily basis. There is less variation in the series which produces recognisable trend between discharge and water temperature. The tipping point at which water temperature stops increasing and then begins to decrease on Julian day 116 which in a regular year is April 26th. At this tipping point the discharge level is 3.54m3s−1. Radiation
however is still steadily rising throughout this period (Figure 4.6).
comparison 0.16% of the annual discharge was needed for water temperatures to respond in 2012. The percentage of the annual total discharge at which water temperatures decrease is shown in Table 4.7 for the years 2003-2012, which was calculated by the sum of the discharge from the start of the year up until the day stream temperatures decreases from the peak and cease to pulse.
Figure 4.6: Daily average of hourly shortwave radiation (W m−2) between
[image:49.595.101.494.125.384.2]the Julian days 91 and 152, 2003-2012.
Table 4.6: Annual total discharge (106 m3) for the years 2003-2012 and the daily total of discharge from the day at which water temperature begins to decrease from the annual peak. With the percentage of the annual total added.
Year Annual total Daily total % of annual total
Table 4.7: Total discharge (106m3) from the January 1 up until the day water
temperature decreases and the percentage of the annual total.
Year Total prior to water temp decrease % of annual total
2003 5.32 0.84
2004 9.02 1.97
2005 8.42 1.72
2006 7.98 1.68
2007 4.43 0.98
2008 4.68 0.96
2009 7.24 1.38
2010 6.42 1.43
2011 2.91 0.56
2012 13.79 2.73
The Massa experiences warm pulses in the autumn and early winter (Figure 4.1). The Julian days 285-298 were observed closely as this period possessed the peak water temperatures for the post ablation season. The hourly variati-ons of discharge (black series) and water temperature (blue series) are shown in Figure 4.7. Discharge reduces at a high rate from 20.12m3s−1 for day
285 to 2.51m3s−1 on day 290, while in response water temperature fluctuates
Figure 4.7: Hourly variations of discharge (m3s−1) (black) and water tempe-rature (◦C) (blue) between the Julian days 285 and 298, 2012.
temperature.
Figure 4.8: Hourly variations of radiation (W m2) (red) and water
Figure 4.9: Hourly variations of radiation (W m2) (red) and water
tempera-ture (◦C) (blue) between the Julian days 150 and 158, 2012.
Figure 4.10: Hourly variations of discharge (m3s−1) between the Julian days
[image:53.595.119.478.424.663.2]Figure 4.11: Hourly variations of discharge (m3s−1) between the Julian days 150 and 158, 2012.
4.2
Diurnal variation
The early ablation season is the principle focus of the research as stream temperatures surge and peak whilst radiation levels are still low. The hourly measurements of water temperature and discharge were compared to assess the transforming relationship over four weeks in 2012. Starting 14 May and ending 4 June, four single days exactly a week apart from each other were assessed. This period was chosen because average stream temperature begins to decrease. Figure 4.12 display hysteresis plots for each of these days. The first of the series shows a loop with a tall flat shape, there is little diurnal variation in discharge with the range only 2.76m3s−1. In contrast there is
a high variation in temperature ranging between 0.82-1.89◦C, over 1◦C of temperature change in a single day. Out of the four days assessed 14 May possessed the highest temperature. The 21 May shows a similar shape to that of the week before however with a much decreased range in water temperature with it only ranging between 1.12-1.52◦C. Also discharge is much lower, with the peak of the day only 8.92m3s−1, with a range of only 1.13m3s−1. Graph
diurnal variation. The mean discharge for this day is 20.39m3s−1 with a range of 4.58m3s−1. These values are much higher than the previous two weeks.
The temperature of this day ranges from 1.06◦C to 1.57◦C, which is lower than the previous week and the range and maximum temperature are higher. However, on mean the hourly water temperature for the day is slightly cooler at 1.23◦C. Figure 4.12 (D) illustrates a sudden increase of discharge for that day compared to the week before. The mean flow for the day is 38.51m3s−1, almost a 100% increase of the discharge from Figure 4.14 (C). The range is narrower at 2.13m3s−1, the height of the loop illustrates this. Contrastingly
Figure 4.12: Hysteresis plots of the hourly diurnal variation of water temperature (◦C) and discharge (m3s−1). Each graph at weekly intervals between the dates 14 May and 4 June 2012. 14 May (A), 21 May (B), 28 May (C) and 4 June (D).
The diurnal variation of solar radiation, discharge and water temperature is shown in Figure 4.13. These particular measurements are for 26 April 2012 as this is the day of peak water temperature, and the trends reflect those of a typical glacier fed Alpine stream. There is an expected lag time between peak radiation at 11:00 and peak discharge at 19:00 due to the length of time the melt water takes to be released from the glacier’s terminus. Water temperature has a lag time of 4 hours following peak radiation and decreases as discharge levels reaches 1.13m3s−1.
Figure 4.13: Diurnal variation of water temperature (◦C), discharge (m3s−1)
Figure 4.14: Hysteresis plots of shortwave radiation (W m2) and water
tem-perature (◦C) for the dates 26/04/2012 (a) and 03/07/2012 (b). Key times and arrows added to indicate temporal variation.
pattern indicates that as discharge increases water temperature decreases. Figure 4.12 (D) displays this well, illustrating that the day with the highest recorded discharge also has the lowest recorded temperatures. Additionally, there is a positive relationship between the diurnal variation of these two parameters as when there is a high range between minimum and maximum daily discharge the same can be said with water temperature vice-versa. To display the evolution of the hysteresis loops throughout the period the same axis was used for all four graphs, however due to the high range between all four the true shapes of the loops are misrepresented. Figure 4.15 displays the measurements for 14 May however at an axis which complements the range of data. A different axis was used for the comparison with the other dates because it illustrates the different levels of water temperature and discharge. Arrows have been added to aid the direction of the measurements through the day, although it is not a perfect loop it still shows well the diurnal variation of water temperature and discharge and the strong relationship they possess with one another.
Figure 4.15: Hysteresis plot of diurnal variation of water temperature (◦C) and discharge (m3s−1) for 14 May 2012 of the Massa, with the direction of
5
Discussion
The results demonstrate a high temporal variation in water temperature and discharge of the Massa, which is similar to other studies focussing on glacier-fed streams (Brown et al., 2006; Collins, 2009). Radiation followed the ex-pected seasonal curve with the maximum levels near the summer solstice (20 June). The basin has responded to climatic warming, with Aletschgletscher retreating significantly in the last 140 years. The results suggest that stream temperature is also sensitive in this environment and very much a function of incoming solar radiation and the level of flow (Constantz, 1998; Magnusson
et al., 2012).
5.1
Seasonal trends
Solar radiation has been highlighted as the primary energy input of proglacial streams (Chikita et al., 2010; Webb et al., 2008). Analysis of the seasonal variation of thermal regimes of the Massa (Figure 4.2) conclude that water temperature increases with the radiation curve from January until the end of April. In Figure 4.2 between the months of March and May 2012 weekly average shortwave radiation and water temperature correlate strongly with r2=0.82 (p=0.002). This is consistent with the hypothesis that solar
As the ablation season extends into late May and June (2003-2012) runoff has an enhanced influence on the summer thermal regime of the Massa. Wa-ter temperature starts decreasing from its peak when daily average discharge increases to approximately 3.5m3s−1 (Figure 4.5), from this point the stream is cooler and no longer experiencing warm pulses instead possessing the mi-nimum hourly temperature range illustrated in Figure 4.1 (j). Table 4.5 expresses this well showing the range of water temperature at the lowest in summer months June-September in the year 2012. 3.5m3s−1 demonstrates
the approximate daily average level of flow at which the Massa reaches a heat capacity that stream temperature is not determined by direct solar radiation but by discharge. This supports the interpretation that water temperature is primarily a function of discharge as radiation levels are at it’s yearly peak in this period.
Water temperatures not only surge in early spring but also at the climax of the ablation season when discharge levels decrease. Figure 4.7 compares the hourly trends between water temperature (blue) and discharge (black). Wa-ter temperatures surge when discharge reaches approximately 2.3m3s−1. Day
295-298 signify the adverse relationship between the two parameters as water temperature decreases as discharge rises, reflecting the trends in Figure 4.5. Stream temperature is higher in early spring and Autumn due to groundwa-ter having a significant contributor to runoff, this source of wagroundwa-ter is warmer than meltwater therefore prior to the ablation period water temperatures will surge when meltwater is minimal (Milner et al., 2009).
Figure 5.1 provides a schematic plot of the monthly trends of water tempe-rature, discharge and radiation with the point of the summer solstice added from the years analysed. The lag between peak radiation and discharge is because the earth absorbs radiation before releasing it into the atmosphere therefore not immediately increasing air temperatures which drive melt. The highest recorded water temperatures are when discharge is lowest due to the stream heat capacity decreasing, as reflected in Figure 5.2. During the hig-hest discharge levels, water temperature is also generally low as the scatter shows. There is no real correlation between these two parameters with r2=
0.08 (p=2.18 10−162).
(b) 1821.59m3s−1, which supports the interpretation that an increased runoff generated from snow and ice melt significantly controls the water temperature even though radiation is at its highest due to a shift in the main contributing water source, an increased heat capacity and reduced residence time.
Figure 5.2: Plot of the hourly discharge (m3s−1) and water temperature (◦C)
for Massa 2012.
5.2
Diurnal trends
Lag times exist between the peaks of each variable on a diurnal basis (Fi-gure 4.8). Water temperature peaks in the early afternoon and discharge in the evening, this suggests that water temperature responds rapidly to at-mospheric variation. Discharge lags radiation due to the delayed drainage of meltwater exiting Aletschgletscher; these diurnal patterns are consistent with previous studies of glacier-fed streams (Constantz, 1998; Constantz et al., 1994). Stream temperature does not vary significantly at night, sugges-ting that stream bed friction is maintaining the constant temperature.
5.3
Stream morphology and topography
River morphology and basin topography have to be taken into considera-tion as these have proven to be complex in proglacial fields and determine the variability of runoff and thermal regimes (Magnusson et al., 2012). The Massa is a typical proglacial Alpine stream with expected topography and river morphology of a highly glacierised basin. This includes it possessing a boulder dominated channel, areas of steep sided V shaped channels, high gra-dients and high levels of suspended sediment that lead to the development of braided channels (Maizels, 1979). Distance between the glacier terminus and gauging station is increasing yearly, as these glaciers retreat the influences of meteorological will be greater (Chikita et al., 2010). Areas of the Massa flow through a steep sided valley and gorge prior to the downstream gauging station (Figure 5.3), and so the water temperature will have limited energy input from solar radiation due to shading and narrow deep channels. Figure 4.10 illustrates the significant effect the topographical shading can have on the thermal dynamics of Alpine streams due to radiation being a primary energy input. Stream bed friction is limited also in these areas due to the morphology of the channel. In contrast the proglacial field immediate to the glacier terminus stream bed friction will have a larger energy input due to the wide shallow channel, additionally radiation will have a greater influence here due to the higher stream surface area and reduced shading (Magnusson
Figure 5.3: Satellite image of the upper reach of Massa demonstrating areas of topographical shading 04/10/2009 (GoogleEarth, 2017).
5.4
Future implications
a reduced area covered by snow therefore a lower albedo which in turn incre-ases melt. The higher the previous winter precipitation the lower in elevation the snowline will be, therefore delaying the rise of discharge in the following months. Inevitably the distance between the glacier terminus and gauging station is increasing; therefore the proglacial streams are interacting with the surrounding environment for a longer period of time. The higher residence and transit time increase the amount of time solar radiation has to pene-trate the stream, at such a high altitude where UV radiation has significant influence (Brown et al., 2006). This will increase water temperature before it reaches the gauging station. However, bearing in mind that discharge is expected to increase with temperature the volume of water to be heated will result in a decrease water temperature. The relationship between energy in-put (shortwave radiation), water temperature and discharge can be observed in the schematic diagram shown in Figure 5.6. The findings of the present study are consistent with previous studies on the relationships determining water temperature in a glacier-fed Alpine river (Collins, 2009).
Figure 5.6: Schematic diagram of the relationships between energy input, water temperature and discharge in a river draining from an Alpine glacier (Collins, 2009).
6
Conclusion
The research demonstrates that the relationships between radiation, stream temperature and discharge vary seasonally and demonstrate complexity. Short-wave radiation has the most significant effect on stream temperature in the months January- April; however, once runoff rises from the winter minimum water temperature becomes very much a function of discharge which supports the third hypothesis. A primary objective of the report was to understand why water temperature decreases in spring when radiation remains the same; the results and research support that this occurs in late April and May due to the higher rate of ablation resulting in discharge increasing. Higher runoff increases the heat capacity of the stream as a larger volume and velocity reduces the residence time, therefore less time for radiation to penetrate the stream along with a larger volume of water to be heated resulting in a cooler temperature.
factors contribute to why stream temperature adversely reacts to a small in-crease of discharge. Another main objective was to identify the level of flow at which a glacier-fed stream’s temperature decreases from it’s peak to the reduced summer levels, for the years 2003-2012 which was 3.54m3s−1. This has not been highlighted in previous literature. Also the proportion of the annual discharge at which stream temperatures decrease has been determined (Table 4.7).
The final objective of this thesis was the evaluation of the influence radiation has on water temperatures seasonally and diurnally. Proglacial streams have been highlighted to be extremely sensitive to meteorological parameters with radiation a primary energy input (Constantz, 1998; Oerlemans et al., 2009; Sommaruga, 2001). The Massa has reflected this as stream temperature has a strong positive correlation with radiation fluctuations diurnally and in the early ablation period, r2=0.82 demonstrated this close relationship,
howe-ver in the months May - September when radiation peaks, the Massa does not express this sensitivity as the heat capacity of the stream is high due to increased discharge. The trends on Figure 4.13 highlight the sensitivity proglacial streams have to meteorological forcings as water temperature cor-relates with radiation with only a 3 hour offset. Therefore water temperature has a positive correlation to radiation and a negative correlation to discharge and the heat capacity of the stream. There has been a consistent relations-hip between the data sets with peak discharge lagging behind peak water temperature and radiation on a diurnal scale and also seasonal. In addition to this relationship, water temperature and discharge negatively correlate on a diurnal, daily, seasonal and annual scale which signifies discharge been the primary control of stream temperature in glacier-fed rivers.
6.1
Future regimes and further research
References
Barnett, Tim P, Adam, Jennifer C, and Lettenmaier, Dennis P (2005). Poten-tial impacts of a warming climate on water availability in snow-dominated regions.Nature 438 (7066), 303–309.
Battin, Tom J, Wille, Anton, Sattler, Birgit, and Psenner, Roland (2001). Phylogenetic and functional heterogeneity of sediment biofilms along en-vironmental gradients in a glacial stream.Applied and Environmental Mi-crobiology 67 (2), 799–807.
Benyahya, Loubna, Caissie, Daniel, St-Hilaire, Andr´e, Ouarda, Taha BMJ, and Bob´ee, Bernard (2007). A review of statistical water temperature mo-dels. Canadian Water Resources Journal 32 (3), 179–192.
Braun, LN and Renner, CB (1992). Application of a conceptual runoff mo-del in different physiographic regions of Switzerland.Hydrological Sciences Journal 37 (3), 217–231.
Brown, GH, Sharp, MJ, Tranter, M, Gurnell, AM, and Nienow, PW (1994). Impact of post-mixing chemical reactions on the major ion chemistry of bulk meltwaters draining the haut glacier d’arolla, valais, Switzerland.
Hydrological Processes 8 (5), 465–480.
Brown, Giles H (2002). Glacier meltwater hydrochemistry. Applied Geoche-mistry 17 (7), 855–883.
Brown, Lee E and Hannah, David M (2008). Spatial heterogeneity of water temperature across an alpine river basin. Hydrological Processes 22 (7), 954–967.
Brown, Lee E, Hannah, David M, and Milner, Alexander M (2006). Thermal variability and stream flow permanency in an alpine river system. River Research and Applications 22 (4), 493–501.
Brown, Lee E, Hannah, David M, and Milner, Alexander M (2007). Vulne-rability of alpine stream biodiversity to shrinking glaciers and snowpacks.
Cadbury, SL, Hannah, DM, Milner, AM, Pearson, CP, and Brown, LE (2008). Stream temperature dynamics within a New Zealand glacierized river ba-sin. River Research and Applications 24 (1), 68–89.
Caissie, Daniel (2006). The thermal regime of rivers: a review. Freshwater Biology 51 (8), 1389–1406.
Ceppi, Paulo, Scherrer, Simon C, Fischer, Andreas M, and Appenzeller, Christof (2012). Revisiting Swiss temperature trends 1959–2008. Interna-tional Journal of Climatology 32 (2), 203–213.
Chikita, Kazuhisa A, Kaminaga, Ryo, Kudo, Isao, Wada, Tomoyuki, and Kim, Yongwon (2010). Parameters determining water temperature of a proglacial stream: the Phelan Creek and the Gulkana Glacier, Alaska.River research and applications 26 (8), 995–1004.
Cogley, J Graham (1979). The albedo of water as a function of latitude.
Monthly Weather Review 107 (6), 775–781.
Collins, David N (1984). Climatic variation and runoff from Alpine glaciers.
Zeitschrift f¨ur Gletscherkunde und Glazialgeologie 20, 127–145.
Collins, David N (1998). Outburst and rainfall-induced peak runoff events in highly glacierized Alpine basins. Hydrological processes 12 (15), 2369– 2381.
Collins, David N (2008). Climatic warming, glacier recession and runoff from Alpine basins after the Little Ice Age maximum. Annals of Glaciology 48 (1), 119–124.
Collins, David N (2009). “Seasonal variations of water temperature and dis-charge in rivers draining ice-free and partially-glacierised Alpine basins”. In: Northern Research Basins Symposium. Vol. 17, 67–74.
Collins, David N, Davenport, Joshua L, and Stoffel, Markus (2013). Climatic variation and runoff from partially-glacierised Himalayan tributary basins of the Ganges. Science of the Total Environment 468, S48–S59.
Constantz, Jim (1998). Interaction between stream temperature, streamflow, and groundwater exchanges in alpine streams. Water resources research 34 (7), 1609–1615.
Constantz, Jim, Thomas, Carole L, and Zellweger, Gary (1994). Influence of diurnal variations in stream temperature on streamflow loss and ground-water recharge. Water resources research 30 (12), 3253–3264.
Delpla, I, Jung, A-V, Baures, E, Clement, M, and Thomas, O (2009). Impacts of climate change on surface water quality in relation to drinking water production. Environment International 35 (8), 1225–1233.
Fenn, CR (1985). Spatial and temporal variations in electrical conductivity in a pro-glacial stream system. Journal of Glaciology 31 (108), 108–114. Fisher, Stuart G (1995). Stream Ecology: Structure and Function of Running
Waters.Science 270 (5243), 1858–1859.
Fountain, Andrew G and Tangborn, Wendell V (1985). The effect of glaciers on streamflow variations. Water Resources Research 21 (4), 579–586. Gobiet, Andreas, Kotlarski, Sven, Beniston, Martin, Heinrich, Georg,
Raj-czak, Jan, and Stoffel, Markus (2014). 21st century climate change in the European Alpsfffdfffdfffda review. Science of the Total Environment 493, 1138–1151.
Han, Luoheng (1997). Spectral reflectance with varying suspended sediment concentrations in clear and algae-laden waters.Photogrammetric Engineer-ing and Remote SensEngineer-ing 63 (6), 701–705.
Hari, Renata E, Livingstone, David M, Siber, Rosi, BURKHARDT-HOLM, PATRICIA, and Guettinger, Herbert (2006). Consequences of climatic change for water temperature and brown trout populations in Alpine rivers and streams.Global Change Biology 12 (1), 10–26.
Hill, Margot (2012).Climate change and water governance: Adaptive capacity in Chile and Switzerland. Vol. 54. Springer Science & Business Media. Huss, Matthias, Farinotti, Daniel, Bauder, Andreas, and Funk, Martin (2008).
Modelling runoff from highly glacierized alpine drainage basins in a chan-ging climate.Hydrological processes 22 (19), 3888–3902.
Jouvet, Guillaume, Huss, Matthias, Funk, Martin, and Blatter, Heinz (2011). Modelling the retreat of Grosser Aletschgletscher, Switzerland, in a chan-ging climate.Journal of Glaciology 57 (206), 1033–1045.
Lowney, Cynthia L (2000). Stream temperature variation in regulated rivers: Evidence for a spatial pattern in daily minimum and maximum magnitu-des. Water Resources Research 36 (10), 2947–2955.
Magnusson, Jan, Jonas, Tobias, and Kirchner, James W (2012). Tempera-ture dynamics of a proglacial stream: Identifying dominant energy balance components and inferring spatially integrated hydraulic geometry. Water Resources Research 48 (6).
Maizels, Judith K (1979). Proglacial aggradation and changes in braided channel patterns during a period of glacier advance: an Alpine example.
Geografiska Annaler. Series A. Physical Geography, 87–101.
Marty, Christoph (2008). Regime shift of snow days in Switzerland. Geophy-sical Research Letters 35 (12).
Milner, Alexander M and Petts, Geoffrey E (1994). Glacial rivers: physical habitat and ecology.Freshwater Biology 32 (2), 295–307.
Milner, AM, Brittain, JE, Brown, LE, and Hannah, DM (2010). Water sour-ces and habitat of Alpine streams. In: Alpine Waters. Springer, 175–191. Moore, R Dan, Spittlehouse, DL, and Story, Anthony (2005). RIPARIAN
MICROCLIMATE AND STREAM TEMPERATURE RESPONSE TO FOREST HARVESTING: A REVIEW1. Journal of the American Water Resources Association 41 (4), 813.
Oerlemans, J, Giesen, RH, and Van den Broeke, MR (2009). Retreating al-pine glaciers: increased melt rates due to accumulation of dust (Vadret da Morteratsch, Switzerland). Journal of Glaciology 55 (192), 729–736. Poole, Geoffrey C and Berman, Cara H (2001). An ecological perspective on
in-stream temperature: natural heat dynamics and mechanisms of human-causedthermal degradation.Environmental management 27 (6), 787–802. Randin, Christophe F, Engler, Robin, Normand, Signe, Zappa, Massimili-ano, Zimmermann, Niklaus E, Pearman, Peter B, Vittoz, Pascal, Thuiller, Wilfried, and Guisan, Antoine (2009). Climate change and plant distribu-tion: local models predict high-elevation persistence. Global Change Bio-logy 15 (6), 1557–1569.
Rebetez, M and Reinhard, M (2008). Monthly air temperature trends in Switzerland 1901–2000 and 1975–2004. Theoretical and Applied Climato-logy 91 (1-4), 27–34.
Rott, E, Cantonati, M, F¨ureder, L, and Pfister, P (2006). Benthic algae in high altitude streams of the Alps–a neglected component of the aquatic biota. Hydrobiologia 562 (1), 195–216.
Scherrer, Simon C, Appenzeller, Christof, and Laternser, Martin (2004). Trends in Swiss Alpine snow days: The role of local-and large-scale cli-mate variability. Geophysical Research Letters 31 (13).
Schmucki, Daniel A and Philipona, Rolf (2002). Ultraviolet radiation in the Alps: the altitude effect. Optical Engineering 41 (12), 3090–3095.
Singh, Abhay Kumar and Hasnain, SI (2002). Aspects of weathering and solute acquisition processes controlling chemistry of sub-Alpine proglacial streams of Garhwal Himalaya, India. Hydrological Processes 16 (4), 835– 849.
Sommaruga, Ruben (2001). The role of solar UV radiation in the ecology of alpine lakes. Journal of Photochemistry and Photobiology B: Biology 62 (1), 35–42.
Webb, Bruce W, Hannah, David M, Moore, R Dan, Brown, Lee E, and Nobilis, Franz (2008). Recent advances in stream and river temperature research. Hydrological Processes 22 (7), 902–918.
Wegmann, Matthias, Gudmundsson, G Hilmar, and Haeberli, Wilfried (1998). Permafrost changes in rock walls and the retreat of Alpine glaciers: a ther-mal modelling approach. Permafrost and Periglacial Processes 9 (1), 23– 33.