R e m o d elli n g f a ç a d e d e si g n fo r
i m p r ovi n g d a yli g h ti n g a n d t h e
t h e r m a l e n vi r o n m e n t i n Ab uj a’s
lo w-i n c o m e h o u si n g
Ab d ul k a r e e m , M , Al-M a iy a h , SA M a n d C o o k, M
h t t p :// dx. d oi.o r g / 1 0 . 1 0 1 6 /j. r s er. 2 0 1 7 . 1 0 . 0 1 0
T i t l e R e m o d elli n g f a ç a d e d e s i g n fo r i m p r o vi n g d a yli g h ti n g a n d t h e t h e r m a l e n vi r o n m e n t i n Ab uj a’s lo w-in c o m e h o u si n g A u t h o r s Ab d ul k a r e e m , M , Al-M a iy a h , SA M a n d C o o k, M
Typ e Ar ticl e
U RL T hi s v e r si o n is a v ail a bl e a t :
h t t p :// u sir. s alfo r d . a c . u k /i d/ e p ri n t/ 4 3 9 1 6 / P u b l i s h e d D a t e 2 0 1 7
U S IR is a d i gi t al c oll e c ti o n of t h e r e s e a r c h o u t p u t of t h e U n iv e r si ty of S alfo r d . W h e r e c o p y ri g h t p e r m i t s , f ull t e x t m a t e r i al h el d i n t h e r e p o si t o r y is m a d e f r e ely a v ail a bl e o nli n e a n d c a n b e r e a d , d o w nl o a d e d a n d c o pi e d fo r n o
n-c o m m e r n-ci al p r iv a t e s t u d y o r r e s e a r n-c h p u r p o s e s . Pl e a s e n-c h e n-c k t h e m a n u s n-c ri p t fo r a n y f u r t h e r c o p y ri g h t r e s t r i c ti o n s .
1
Remodelling façade design for improving daylighting and the
thermal environment in Abuja’s low-income housing
Abstract
The housing typologies that were developed as part of Abuja’s master plan over 30 years ago are still in use today as prototypes for low-income housing developments. The value of the local climate received only cursory consideration in the early developments; as the process was mainly focused on the delivery of units needed to accommodate those involved in the construction of the city. More detailed records of the climate have become available since the mid-1990s. Yet, despite the availability of such data and the global interest in eco-friendly architecture, energy use per household has increased in Abuja over the last two decades. Nigeria is already struggling to meet its current energy demands; therefore, it is important to examine whether improvements made to future housing design can assist in reducing their energy use.
This paper evaluates the performance of four of Abuja’s common housing types and examines the impact of changing their fenestration design on occupants’ comfort, using validated simulation. Assessing the performance of the buildings in their existing state revealed clear overheating problems and excessive natural lighting. However, the investigation indicated a 4-6% reduction in the frequency of thermal discomfort and a 4-29% reduction in visual discomfort by adjusting the orientation of the facades. Integrating external shading components can also reduce thermal and visual discomfort by up to 4% and 29%, respectively.
Keywords: Thermal comfort, Visual comfort, Overheating, Passive solutions, Low-income housing,
Nigeria
1. Introduction
Nigeria has the largest population in Africa with over 186 million people, of which 47.8% live
in urban areas. The country has been experiencing a relatively high population growth and rate
of urbanisation estimated in 2014 at 2.7% and 4.7% respectively [1]. Due to such rapid rates
of urban population growth, concerns over the deficiency in the housing quality across the
region and the lack in housing availability to accommodate the urban residents have been
repeatedly reported in previous studies [2], [3], [4]. Nigeria’s current housing deficit was
recently projected at over 17 million units [5]. Along with the ongoing housing shortage, there
is also limited access to electricity in the country, primarily a consequence of a rapid increase
in population without a corresponding increase in the production of electricity [6]. 55% of the
existing households, equivalent to over 90 million people, lack access to grid supply of
electricity and the supply to those connected to the grid is unreliable [7]. As a result, the use of
back-up power generators to mitigate poor grid-based supply has become increasingly common
in Nigeria over recent decades. A survey of over 1000 households located in Lagos [8] revealed
2 Like many other countries in Sub-Saharan Africa the housing sector in Nigeria has been a main
contributor to the total energy use in buildings [9]. Over 57% of the electrical energy consumed
in Nigeria is used in housing [10], mainly in cooling and lighting. An investigation of electricity
use in residential units in Gusau (North of Nigeria) [11] revealed that on average 78% of the
annual electrical energy consumed in the units was dedicated to running air conditioning
systems and 1% for artificial lighting. However, in a study on energy consumption pattern of
dwellings in Kaduna and Kano, (also North of Nigeria) the authors reported that on average
62.7% of the annual electrical energy consumed was used for lighting while 23.6% was used
to run air conditioning systems [12]. These findings suggest that the ability to minimise the use
of mechanical cooling and artificial lighting in providing the level of comfort desired by the
occupants in Nigeria’s housing is key for reducing the overall energy use in the region.
Notwithstanding the above, the contemporary architectural practice that emerged in the 1970s
has contributed to inefficient energy use in the housing sector (through the reliance on
mechanical solutions) and is still prevalent today. Over the years, this has led to increasing
demand for active energy through various devices for both cooling and lighting [13]. With such
dependency on artificial solutions and the rapid increase in population, some believe that the
energy consumption in Nigeria might become impossible to sustain in the future [14].
Several technical studies have been undertaken to examine energy use and occupants’ sensation of comfort in Nigeria’s housing across different cities. For example, Adaji et al. [15] have recently investigated urban residents’ perception of thermal comfort in four low-income
residential buildings in Abuja using occupant comfort survey and environmental monitoring.
Similarly, Adunola and Ajibola [16] examined the relationship between the quality of the
residential indoor thermal environment and the pattern of use of spaces among residents of
over 500 dwellings situated in different areas in Ibadan metropolis. In a follow up study
published in 2014, Adunola [17] further reported the results of the thermal comfort survey of
the same sample. The main objective of this (later) phase of evaluation was to examine the
indoor thermal experience of the residents in relation to the outside air temperature across the
various neighbourhoods. Likewise, Akande and Adebamowo [18] reported the findings of a
comfort field study of residential properties in Bauchi in northern Nigeria. Akinwolemiwa and
Gwilliam [19], on the other hand, have explored low energy and passive cooling opportunities
to improve thermal comfort in low-income residences in Lagos through the use of financially
3 an insight into the thermal behaviour of Nigeria’s housing, surprisingly only a few (studies)
examined the environmental performance of the residential architecture of Abuja, where one
of the most extensive public housing development programmes in the country’s history has
been implemented [20], [21]. In addition, most publications on comfort and the housing sector
in Nigeria tend to focus on the thermal aspect of the housing units, while little attention is given
to the visual aspect of the design. Of the few published daylight-related studies in Nigeria’s
urban context and climatic zone is a study by Atolagbe [22]. The paper examined residents’
satisfaction with natural light availability in different house types across three residential zones
in Ogbomoso using questionnaire survey.
As improving the thermal performance of residential dwellings could positively contribute to
the thermal residential environment, providing an acceptable level of daylight indoors is
equally essential for improving occupants’ visual comfort. Effective utilisation of passive
design measures has long been proven to help greatly in improving residential occupants’
comfort while reducing energy bills cost [23], [24], [25], [26]. Yet, despite its tropical location
and the abundance of solar radiation all year round little is known about the effectiveness of
applying passive principles to residential buildings design in Nigeria’s climate zone [27].
Hence, this paper assesses the performance (of four) of Abuja’s common low-income housing
types and examines the impact changing their fenestration components have on thermal
comfort and daylighting. The paper aims at exploring whether the integration of passive design
principles that were not considered in the early generation of housing schemes built in the city
can assist in improving their occupants’ sensation of comfort. The sample selected as a basis
for the evaluation is among the early housing typologies developed by the government as part
of mass housing schemes. The purpose of the investigation is to propose recommendations to
improve occupants’ comfort in future public housing schemes for the low-income group
through the integration of low-energy passive design methods.
2. Abuja’s housing sector: an opportunity for improvement
The architectural landscape in many cities throughout Nigeria has changed since the 1970s,
largely dominated by mass housing production schemes implemented by the public sector [21],
[28]. The oil boom in the mid-70s boosted the country’s economy and in turn the government,
for the first time, participated actively in the provision of housing for all income groups. This
4 energy was cheap and as a result form became more important than performance in the building
design [28].
Abuja, the capital city of Nigeria, was also conceived in the mid-1970s, when the government
introduced the most extensive public housing development programme in Nigeria’s history. At
the early stage of development, the designers involved in the process were mainly focused on
providing the required quantity of dwellings to accommodate those involved in the construction
of the city [29]. This is clearly reflected in the master-plan stating that “the architectural and
engineering aspects of housing are perhaps the least complicated or problematic aspects of
housing” [30]. With this mind-set, thousands of residential buildings in Abuja were originally
designed and eventually constructed without proper regard for the climatic context of the region
[31].
[Please insert Figure 1 here]
Figure. 1. Location of Abuja, Nigeria
Since the mid-1990s more records of the climatic conditions have become available as the city
has become one of the largest urban areas in Nigeria. However, despite the availability of such
records and the global interest in climate conscious architecture, the prototypes for low-income
housing in the schemes that were developed as part of Abuja’s master plan over 30 years ago
are still in use today as a blueprint for housing developments [28]. Thus, the homogeneous
nature of public housing design has partially negated the possibility of improvements towards
more energy efficient dwellings. Nevertheless, only about half the area allocated for residential
building construction in the city is fully developed (Figure 2). With the government seeking to
complete the remaining phases of development, there is a real opportunity to influence the
architectural practice in the city by examining the performance of this early generation of
housing which is still in use today, providing guidelines for future development.
[Please insert Figure 2 here]
Figure. 2. Illustration of the developed area of Abuja (highlighted in red) on the master plan drawing
2.1. Location and climate of Abuja
Located in the central region of Nigeria (at latitude 9˚06’N and longitude 7˚49’E), Abuja has a
5 the rainy season. The dry season starts in November and ends in April, while the rainy season
occurs from May to October.
The dry season is characterised by very little cloud cover and intense solar radiation
(5.9-6.3kWh/m2/day), as a result daytime temperatures can be as high as 37°C. During the rainy
season the combination of solar radiation (4.2-5.6 kWh/m2/day) and the humidity of the air
mass forms dense clouds and leads to the occurrence of torrential rain, which has a cooling
effect. Nevertheless, daytime temperatures can still rise above 29°C [32], [33]. The findings
reported in this paper focused on the dry season because of the relatively high temperatures
that occur during this time of year in Abuja and the negative effect it has on occupants’ comfort.
2.2Case study buildings
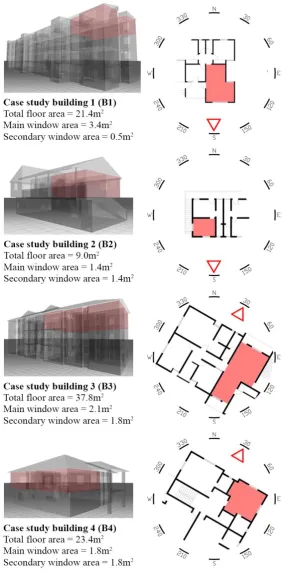
Four case study buildings situated in three districts of Abuja (Wuse I, Garki II, Gaduwa) were
selected for the evaluation (Figures 3 and 4). The first building (B1) is a two-bedroom block
of flats in Wuse I constructed in 1983. The second building (B2) is a mixed-use detached
duplex in Garki II that was built in 1995. The third case study building (B3) is a three-storey
building in Gaduwa, constructed in 2003 that consists of six three-bedroom flats. The fourth
building (B4) is part of the same housing development project as B3 in Gaduwa. It was initially
designed as a four-bedroom house, but was later converted into a multi-dwelling residential
building with shared facilities. Apart from B2, the other three buildings are prototypes that
have been reproduced multiple times as part of government housing schemes in Abuja. As a
result, collectively the selected dwellings have geometric characteristics and building materials
that are comparable to over 450 other dwellings in the chosen neighbourhoods.
A room from each case study building (the living rooms in B1 and B3, and the bedrooms in B2
and B4) was selected as a basis for the evaluation. The overall layout and geometry of each
room as well as information on the total floor area, dimensions of the openings, orientation and
shading components (if any) are shown in Figure 4.
[Please insert Figure 3 here]
Figure. 3. Satellite photograph of Abuja, with selected neighbourhoods outlined in red and districts outlined in orange
[Please insert Figure 4 here]
6 3. Methodology
The building modelling software Integrated Environmental Simulation (IES-VE) [34] was used
to examine the performance of the case study buildings during the dry season (November to
April). For each case a 3D digital model was constructed based on the actual building form and
information on building materials collected during the fieldwork. The simulation was set up
for full-time occupancy with the maximum dwelling occupancy rate specified by the Nigerian
government [35]. It was assumed that occupants will always take effective steps to improve
the indoor conditions. Hence, during the simulations the windows are opened if the indoor
operative temperature exceeds the acceptable limits for comfort and the outdoor dry-bulb
temperature is below the indoor operative temperature.
3.1Validation
Case study building 4 was empty at the time the fieldwork was carried out due to renovation,
and thus it was chosen for the simulation model validation since there was no problem of
occupants interfering with logging devices. The validation was implemented by statistically
comparing the air temperatures and illuminance levels recorded in the bedroom with the
simulated values. Two monitoring programmes were planned and executed; one during the
rainy season between June 1st and June 30th and the second during the dry season between
December 1st and December 21st, 2015. However, being under renovation meant that some
additional adjustments needed to be applied to the 3D digital model of the building/room as
both the glazing and window frames were removed from the external openings in the model to
reflect the actual situation (see Figure 5_ right image).
The procedural method adopted in performing the in-situ monitoring carried out over the dry
season is explained below.
The room was monitored in a passive mode where electrical appliances were switched off
during the monitoring period. Temperature and illuminance readings were logged hourly using
5 HOBO pendant temperature and light data loggers located at a height of 1.6m and 0.75m
(Figure 5_ left & middle). An additional data logger was placed outside the room in the shaded
porch area to record the external air temperature. Illuminance readings were also recorded
outside at a point with minimal physical obstructions.
7
Figure. 5. Position of temperature (left) and illuminance data loggers (middle) in the test room
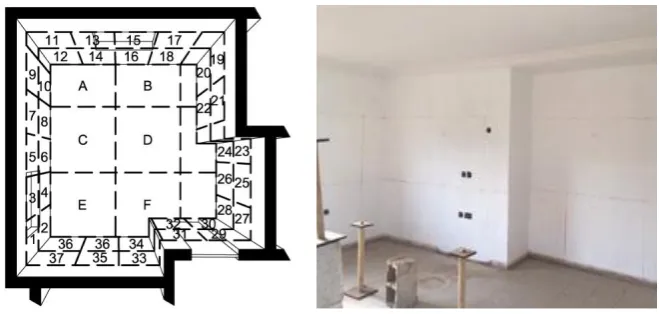
In addition, the area of the wall, floor and ceiling surfaces were divided into different zones, as
illustrated in Figure 6, to establish their reflection properties (which again was made possible
because of the construction works). A luminance meter and illuminance meter were then used
to measure the luminance (L) and illuminance (E) of a point within each zone. The values
collected at each surface were subsequently used to calculate the average reflectance of these
areas using the following equation [36]:
Equation 1. ρ = (L / E) × π
Where:
ρ = Reflectance (%)
L = Luminance (candela per square metre (cd/m2)) E = Illuminance (lux)
The reflectance values calculated for the internal walls, floor and ceiling in the test room were
90%, 36% and 89% respectively. These values were then applied to the simulation tool and a
correlation analysis was subsequently conducted between the simulation and the recorded data
using Pearson’s correlation coefficient.
[Please insert Figure 6 here]
Figure. 6. Illustration of the different reflectance zones on the walls and floor of B4
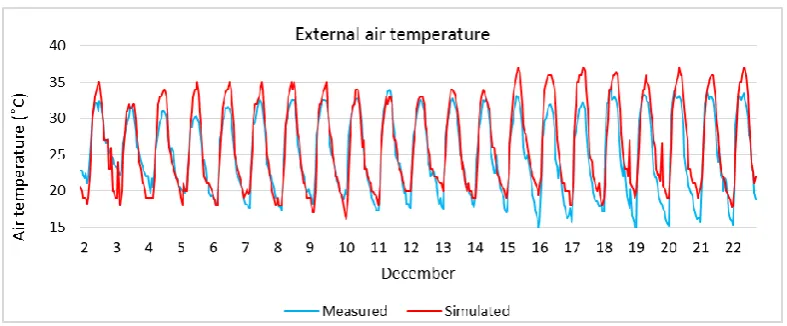
The results indicated a significant positive correlation between the values for air temperature
in the test room and the external temperature. Over the three weeks examined, the correlation
between the measured and simulated internal air temperature ranged between 0.9625 and
0.9521. Similarly, the correlation between the measured and simulated external air temperature
ranged between 0.9557 and 0.9316. Furthermore, the average errors calculated between the
two values were only between 5% and 9% (Figures 7 and 8), confirming the accuracy of the
software in predicting the thermal environment. However, the accuracy of the predictions is
dependent on the accuracy of the weather file available for the location.
[Please insert Figure 7 here]
Figure. 7. Measured and simulated internal air temperature in the test room in B4
[Please insert Figure 8 here]
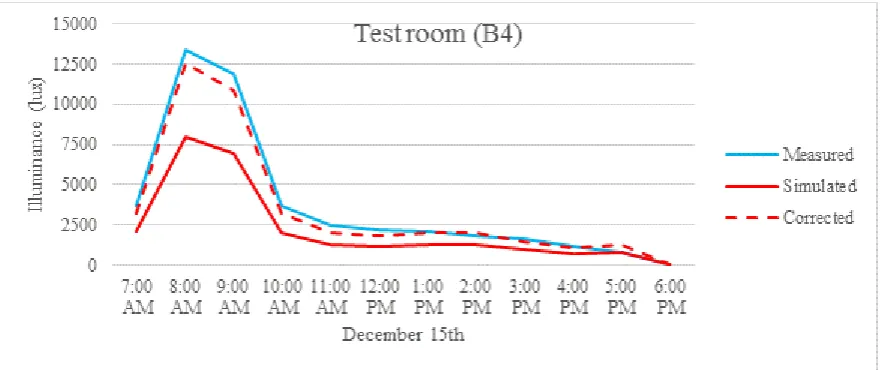
8 The correlation between the measured and simulated internal illuminance levels was also
significant at the reference points ranging between 0.9981 and 0.9025. Yet, the highest average
relative error was 32% during the first week of December, and the lowest value was 28% during
the second week. As shown in Figure 9 there is consistent similarity in the pattern of
daylighting in the room, nevertheless, the maximum levels of illuminance measured were about
1000lux above the simulated illuminance levels, for about 20% of the time over the days
examined.
It was observed that sky conditions in Abuja remained constantly clear and sunny throughout
the measurement period in December, yet the results showed notable differences between the
maximum measured illuminance values and the maximum values predicted by IES Radiance.
The external illuminance level and sky luminance were measured on the site of B4 at 1 pm on
December 15th, using the illuminance and luminance meters.
The actual illuminance and luminance values recorded at site were around 82klux and
250900cd/m2, respectively, while the maximum external illuminance levels predicted by
Radiance using sunny sky conditions were only about 73klux on each day during the examined
period.
[Please insert Figure 9 here]
Figure. 9. Measured and simulated internal illuminance levels at point 4 in the test room in B4
In Abuja’s sunny sky conditions, a 30% error is significant and could be misleading. Hence a
correction factor was used to recalculate the average illuminance levels in the test room on the
1st and 15th of December. The corrected values were calculated using an equation adapted
from a previous study carried out by [35]:
Equation 2. CS = (Sv x CF) + Sv
Where;
CS = corrected simulation Sv = simulated value
CF = the average value of the relative error/ correction factor
Comparing the corrected simulations with the measurement values showed a minimum relative
error of 11% and a maximum error of 15%. These values are in agreement with those reported
by Kim and Chung [37], and Al-Maiyah and Elkadi [38] and much lower than the average
errors reported by Mantzouratos et al. [39]. The validation process presented above was also
used in establishing the discrepancy between the measured and simulated daylight levels during
the rainy season (June 1st to June 30th). The correction factor representative of each season
9 [Please insert Figure 10 here]
Figure. 10. Measured, simulated and corrected results for test room on December 15th
3.2Evaluation criteria
The 2003 national energy policy of Nigeria [40] proposes the development of building codes
to encourage designers to adapt their buildings to the local climate in order to reduce energy
consumption. However, neither the national energy policy nor the national building code
published in 2006, provide guidelines specifically for Nigeria on thermal comfort that can assist
designers in improving the environmental performance of their schemes [35], [40], [41].
Therefore, the ASHRAE standard 55-2010 adaptive model for thermal comfort in naturally
ventilated buildings [42], which is applicable in tropical regions [18], was used to define the
thermal comfort requirements in this study. The model is primarily based on the correlation
between the operative temperature and the running mean outdoor temperature measured over
no less than 7 days before the day in question. The upper (Tover) and lower (Tunder) limits of the
temperature range acceptable for 80% of occupants in the case study buildings are determined
using the following equations [42]:
(1) Upper 80% acceptability limit (°C) = 0.31x Tpma +21.3
(2) Lower 80% acceptability limit (°C) = 0.31x Tpma +14.3
Where, Tpma is the prevailing mean outdoor air temperature which is the arithmetic mean of all mean daily outdoor
air temperatures for 14 sequential days prior to the day in question.
An example of the acceptable indoor operative temperature limits along with hours of thermal
discomfort calculated in B1 on the 15th day of each month in the dry season is shown in Table
1. The table shows the predicted mean (Tomean), maximum (Tomax) and minimum (Tomin)
operative temperatures in B1, in relation to the upper and lower limits of the acceptable
[image:10.595.167.427.654.758.2]temperature range for the 15th day of each month.
Table. 1. Acceptability limits for indoor operative temperatures and hours of thermal discomfort in B1 during the dry season (note: the values highlighted in red are the highest calculated on the examined days)
Acceptability limits B1
Tovr Tunr Tomn Tomax Tomin HTD
NOV 29.6 22.6 29.5 33.3 26.9 10
DEC 29.3 22.3 30.1 34.6 26.6 13
JAN 29.6 22.6 30.8 35.2 27.9 13
FEB 30.5 23.5 32.1 35.5 29.4 15
MAR 31.1 24.1 33.4 36.6 30.7 21
APR 30.6 23.6 32.3 35.7 29.9 20
10 The models for assessing visual comfort are less standardised than that of thermal comfort. An
approach similar to Sicurella et al’s method [43] is adapted in this study for evaluating the
Frequency of Visual Comfort (FVC), in which illuminance values across the working plane are
predicted using grid points 0.5m apart. The upper limit for preferred daylight illuminance used
is 500 lux and the lower limit is 100 lux. These limits were established based on the
Illuminating Engineering Society of North America (IESNA) lighting handbook [44].
However, it is important to note that the upper limits of acceptability can be adjusted to a higher
value depending on the actual use and type of activities taking place in a particular room. The
conditions in the living/bedrooms in the selected dwellings were investigated for the 15th day
of each month in terms of the operative temperature, the average illuminance, and the number
of hours when the operative temperature/ illuminance were below the lower limit or above the
upper limit of the acceptability.
Hours of visual discomfort calculated for example in B1 on the 15th day of each month in the
dry season are shown in Table 2. The table shows the mean (Eimean), maximum (Eimax), and
minimum (Eimin) illuminance levels predicted across the working plane in the room, as well as
[image:11.595.169.431.480.588.2]the calculated hours of visual discomfort (HVD) on the 15th of each month.
Table. 2. The mean, maximum, minimum illuminance levels and hours of visual discomfort in B1 on the 15 day of each month during the dry season [mentioned red highlighted values]
Acceptability limits B1
Eovr Eunr Eimn Eimax Eimin HVD
NOV 500 100 3219 5300 340 10
DEC 500 100 4320 7204 468 11
JAN 500 100 3826 6328 421 10
FEB 50 100 1926 3062 263 10
MAR 500 100 561 812 194 8
APR 500 100 445 772 189 3
Note: all values except HVD (hours) in Lux
4. Thermal performance analysis
The predicted hourly outdoor and indoor temperatures as well as the hourly levels of solar gain
received in the rooms on the days assessed are illustrated in Figures 11-14. The results showed
that the room in B1 will be thermally uncomfortable for an average of over 15 hours a day
(Table 1). On March 15th, when the outdoor dry-bulb temperature in Abuja is at its peak, the
maximum operative temperature in the room could be as high as 36.6°C exceeding the
11 on April 15th. The amount of solar radiation the room receives could exceed 1kW on midday
due to the southern orientation of the large window area (3.4m2) and the lack of shading. Such
high level of solar gain is the cause of overheating over the first four months of the dry season
(Figure 11). On the other hand, the higher altitude angles of the sun (78-89°) during March and
April, leads to the ground and air above the ground being intensely heated as less sunlight is
being dissipated by the atmosphere. Thus, despite the reduction in the levels of solar gain, the
high outdoor temperatures around this period are mainly responsible for the high level of
thermal discomfort predicted in the room towards the end of the season. Given that the outdoor
temperature can be as low as 19°C during the early mornings, it would be beneficial to adopt a
better night time cooling approach during this time of the year.
[Please insert Figure 11 here]
Figure. 11. The level of solar gain, the operative, mean radiant and air temperatures in B1 in comparison to the outdoor dry-bulb temperatures on the 15th of each month in the dry season
It is anticipated that the room in B2 will also be thermally uncomfortable for more than half of
the time assessed. Yet, in comparison to the first case, there are on average two fewer hours of
thermal discomfort calculated for the room in B2, including March 15th when the maximum
operative temperature is also 1°C lower. The relatively lower frequency of thermal discomfort
in this case can be attributed to the lower levels of solar radiation reaching the room (Figure
12) as compared to the B1 case. The room in B2 has a smaller total window area (2.6m2) than
the room in B1 (3.8m2), thus it receives less sunlight even though one of the windows faces
south. Also, the floor area of the room in B2 (9m2) is much smaller than the B1 case (21m2)
hence the room in B2 has a larger window to floor area ratio. During the last two months of the
dry season the cooling by cross ventilation (especially in the morning), which is made possible
by the size, the position of the openings and the compact form of the room (Figure 4), seems
to be advantageous for limiting thermal discomfort.
[Please insert Figure 12 here]
Figure. 12. The level of solar gain, the operative, mean radiant and air temperatures in B2 in comparison to the outdoor dry-bulb temperatures on the 15th of each month in the dry season
According to the results, the room in B3 will be thermally uncomfortable for an average of
over 21 hours on the days assessed. On March 15th the maximum operative temperature in the
room is 1°C lower than that of the room in B1 and the same as the B2 case, yet the room is
12 predicted for January 15th and April 15th. As shown in Figure 4, both external facades in the
room in B3 are shaded by balconies that are over 1.3m deep, thus the amount of solar radiation
received through the windows is much lower (Figure 13) than the amount received by the other
two rooms. The average hourly levels of solar gain in the room are below 0.25kW as compared
to 0.55kW in B1 and 0.33kW in B2. However, the room is 9.5m deep and the total openable
window area is less than 5% of the total floor area, hence the cross ventilation is inadequate for
achieving cooling in the room. This can be particularly problematic during the last half of the
dry season when more cross ventilation is required to counter-act the overheating effect of the
outdoor air temperature.
[Please insert Figure 13 here]
Figure. 13. The level of solar gain, the operative, mean radiant and air temperatures in B3 in comparison to the outdoor dry-bulb temperatures on the 15th of each month in the dry season
The results also indicated that the room in B4 will be thermally uncomfortable for an average
of 17 hours during the examined season. Similar to the B3 case the room is thermally
uncomfortable throughout March and April with a maximum operative temperature exceeding
the acceptable range by 5°C. Due to the easterly orientation of the main window area and in
the absence of shading, the hourly levels of solar gain in the room are over 1.5 kW in the
morning, causing the prediction of high frequency of thermal discomfort.
Overall the results indicated that the rooms in B1 and B2 are thermally uncomfortable for 64%
and 56% of the period assessed, while the rooms in B3 and B4 are thermally uncomfortable for
88% and 72% of the same period. With the exception of the third case and the lack of sufficient
ventilation (see discussion above), these figures suggested that occupants of the rooms are
likely to experience constant levels of discomfort due to overheating caused by high amounts
of direct solar gain and radiation for half of the year.
[Please insert Figure 14 here]
Figure. 14. The level of solar gain, the operative, mean radiant and air temperatures in B4 in comparison to the outdoor dry-bulb temperatures on the 15th of each month in the dry season
5. Visual performance analysis
Values of daylight illuminance predicted in the rooms on the 15th day of each month in the dry
season are illustrated in Figures 15-18. Apart from April 15th, the results showed that the room
13 December 15th the maximum average illuminance level predicted across the room is over
7200lux adding another 3 hours of visual discomfort. This additional increase in the level of
discomfort is the result of the southerly orientation of the main window area and the low angle
of the sun (57°) around midday on December 15th (Figure 15). On all the days assessed the
illuminance level in the room is consistently above 1000lux around midday (Figure 19), yet
the level of illuminance predicted in the half of the room further away from the main window
remains between 100-500lux all day long. Such contrast between the distribution of
illuminance at the front and the rear can cause the occupants to perceive the areas further away
from the window as insufficiently day-lit. Hence, despite the high levels of daylight
illuminance in the room, the occupants might still be inclined to waste energy to run artificial
lighting.
[Please insert Figure 15 here]
Figure. 15. The average daylight illuminance levels in B1 on the 15th of each month in the dry season
Because of its compact configuration and the relatively larger fenestration ratio (as explained
above) the visual performance of the room in B2 is more problematic than the first case. Based
on the results, the room will be visually uncomfortable during most of the daytime hours (11
hours of discomfort) during the first four months of the dry season. Only 3 fewer hours of
visual discomfort are predicted on April 15th (due to the change in the altitude angle of the sun
at the end of the season) and as with the previous case December 15th produces the maximum
illuminance level received in the room (7280lux). The high amount of sunlight received in the
room all day long is a result of the position of unshaded windows on the southern and western
façade. The levels of illuminance in the room are greater when the sun is at a low angle in the
west around sunset (Figure 16). Whereas the occupants in the room are likely to experience
discomfort due to such high illuminance levels, especially around sunset, this can be easily
adjusted with the use of affordable simple internal shading devices. However, the addition of
solar shading, which is usually more expensive, such as shutters, or louvres could be an
attractive option here not only to limit the amount of sunlight in the afternoon, but also to
improve the thermal environment in the room.
[Please insert Figure 16 here]
14 Unlike the other two rooms, the room in B3 will be visually uncomfortable for an average of
about 3 hours on the days assessed (Figure 17). Although the highest illuminance level
predicted (964lux) occurs on December 15th, the highest frequency of visual discomfort (5
hours) occurs on January 15th. Nevertheless, these values are much lower than those predicted
for the previous two cases. In fact, unlike the previous cases, 1-2 hours of visual discomfort
predicted in the room are due to insufficient illuminance levels (Figure 17). As with the thermal
conditions, the room’s depth, window sizes and shading influence the level of daylight
available indoors. Only the areas by the window receive sufficient lighting even around midday
(Figure 19). This suggests that even when there is ample daylight outdoors, the room’s
occupants might require artificial lighting to carry out basic daily visual tasks.
[Please insert Figure 17 here]
Figure. 17. The average daylight illuminance levels in B3 on the 15th of each month in the dry season
Of the four cases examined, the room in B4 provides an interesting clear illustration of the
impact of orientation on the quality of daylight indoors. According to Figure 18 there is a
constant variation in the illuminance levels received in the room throughout the course of each
of the examined days. On all the days assessed, the difference in the average illuminance levels
received in the first half of the day, and those received in the afternoon hours is over 5500 lux.
Whereas the high amount of sunlight received in the room from the early morning until around
midday is the results of the north-easterly and south-easterly orientation of its windows, the
sun’s movement towards the south and west in the afternoon significantly lowers the amount
of radiation received indoors. Therefore, the average 6 to 7 hours of visual discomfort predicted
on the examined days occur in the morning. Since the internal visual conditions in the room
are constantly uncomfortable in the early part of the day but well within the acceptable range
in the afternoon hours, a combination of fixed external rigid screen(s) on the south-eastern
orientation and movable internal shading devices seems necessary here to limit the unwanted
direct radiation in the morning while allowing the occupants to adjust the diffuse radiation in
the afternoon.
[Please insert Figure 18 here]
Figure. 18. The average daylight illuminance levels in B4 on the 15th of each month in the dry season
[Please insert Figure 19 here]
15 Overall the results suggested that the rooms in B1 and B2 are visually uncomfortable for about
72% and 86% of the period assessed, while the rooms in B3 and B4 are visually uncomfortable
for 3% and 54% respectively. Once again, and with the exception of the room in B3, the
occupants of these rooms are likely to experience high levels of discomfort due to high
illuminance. As expected, the more solar radiation reaching the main window areas, the higher
the frequency of visual discomfort. Yet shading devices are not well utilised in most of the
housing types in Abuja. Figure 20 shows examples of residents’ response to the high level of
discomfort in their dwellings by either retrofitting simple shading elements over the windows
or replacing the original glazing with tinted glass to reduce the visual transmittance of the
windows by reflecting sunlight.
[Please insert Figure 20 here]
Figure. 20. Residential buildings in Abuja with improvised egg-crate shading, retrofitted overhangs and reflective glazing (2014)
6. Analysis of impact of parametric variables
Evaluating the performance of the case studies in their current state has identified several
design variables that could potentially improve the quality of the internal environment in
Abuja’s houses. Further analysis was carried out to examine whether the internal conditions of
the room in B4 can be improved by adjusting its orientation and shading the windows.
6.1Orientation
In the simulation tests for orientation reported in this section, the main window wall in the
room in B4 was orientated north. The angles of rotation for the building were subsequently
re-calibrated at 45˚ increments clockwise until a full circle was completed. Hence, 0˚, 90˚, 180˚ and 270˚ represent north, east, south and west respectively (Figure 21_a).
[Please insert Figure 21 here]
Figure. 21. (a_left) Alternative orientations simulated for the room in B4, (b_right) Impact of
orientation on the average FTD and FVD in the room in B4 during the dry season
Figure 21(b) illustrates the impact of the varying orientations on the frequency of thermal
discomfort in the room. The results suggested that the room in B4 will have the lowest average
FTD (53%) during the dry season if the room’s main window wall area is orientated west (270°)
16 reducing the frequency of thermal discomfort estimated. Similarly, adjusting the main façade
to the south-west leads to the second lowest average FTD (55.6%). On the contrary, orientating
the room south-east (135°) and east (90°) will lead to the highest average FTD (59.7%), due to
the increase in the level of solar radiation received indoors throughout the day. The average
hourly level of solar gain in the room is almost doubled to 0.59kW after changing the
orientation from west to east. On average the results showed that adjusting the room orientation
can result in 6.6% reduction in the frequency of thermal discomfort during the warmest period
of the year.
Similarly, Figure 21(b) shows that over the days assessed during the dry season, the room in
B4 will have the lowest average FVD (25%) when the room is orientated north-west.
Considering the above figures, these results suggested that orientating the room’s primary
window wall area north-west is likely to improve the thermal, as well as the visual performance
of the room. Also, as with the thermal performance, orientating the room south-east increases
the average FVD to 91.7%. Such high frequency value of discomfort occurs due to the
multilateral fenestration design of the room with the main window facing south-east and the
window on the adjacent side facing south-west. Thus, a high amount of direct sunlight reaches
the room in the morning and afternoon on the days assessed. In addition, the results also
suggested that orientating the room north-west could enhance the quality of the visual
environment by improving daylight distribution indoors. The uniformity ratio,
representing the minimum to the average illuminance, indicated a more even distribution of
daylight for 20 additional hours during the dry season if the room faces north-west as opposed
to the south-east.
6.2Shading performance analysis
Rigid window shading elements, including fins, overhangs and egg-crates are among the main
features in Nigerian contemporary architecture which emerged in the mid-twentieth century,
known as tropical or African modernism [45]. However, as stated before, external fixed
shading elements, which are essential for limiting the amount of solar radiation indoors, are
not common in most of the housing porotypes surveyed in the city. As exemplified in B3, the
appropriate configuration and size required for these types of shading elements to be effective
thermally as well as visually ought to be considered. The room in B4 was therefore utilised to
examine the impact of window shading. The geometry of the composite shading devices tested,
which was partially based on residents’ response illustrated in Figure 20, consists of an
17 [Please insert Figure 22 here]
Figure. 22. Illustration of the existing façade design, as well as alternative designs with three different window shading sizes
[Please insert Figure 23 here]
Figure. 23. Impact of window shading on the average FTD and FVD in the room in B4 during the dry season
The results showed that during the dry season, the predicted FTD in the room is about 1%, 3%
and 4% lower (approximately 156 hours), with the 0.3m (S1), 0.6m (S2), and 0.9m (S3) shading
projections respectively. As shown in Figure 23, strong negative correlations between the
shading depth and the FTD (R = -0.9978, p = 0.0022) were found, indicating that increasing
the shading projection reduces the frequency of thermal discomfort. Despite the north-east and
south-east orientation of the window walls in the room, the shading elements sufficiently limit
the amount of solar radiation reaching the room in the morning. The average hourly levels of
solar gain on the days assessed during the dry season is 0.34kW lower in the room with S3.
Furthermore, the predicted operative temperatures in the room with the addition of S3 are 0.5°C
to 0.8°C lower compared to the base case (the room without shading).
Similarly, the addition of shading or screening elements S1, S2 and S3 reduced the average
FVD in the room by about 14%, 19% and 29%, as compared to the base case, representing
about one to three fewer hours of visual discomfort on the days assessed. Moreover, the
uniformity ratio of natural light distribution in the room with S3 is above 0.3 for 84% of the
time assessed, as opposite to 22% of the time without shading. These findings, and those
obtained from the thermal analysis indicate that the presence of S3 is the most beneficial for
reducing the frequency of thermal discomfort, as well as improving the quality of daylighting
in the room. However, given that the thermal performance of S2 and S3 are similar and S3 is
slightly more effective than S2 in improving the quality of the visual environment indoors
(Figure 23), it seems sensible to say that S2 is the most cost-effective option of the three types
examined.
Conclusions
Providing quality homes for low income groups is one of the key challenges facing Abuja
today. Housing has been among the top priorities of the government’s agenda, but the focus on
mass production over the recent decades has negatively affected the quality of the dwellings in
18 retrofit with shading devices, tinted glass, and air-conditioning units suggests that there is a
need to rethink the design of future housing rather than re-using what is already proven to be
problematic. Another challenge facing Abuja today is its poor energy supply. Housing is
already responsible for over half of all energy use in Nigeria and with the current increase in
population, meeting occupants’ needs may become even more difficult in the future. Despite
these problems, there is a unique opportunity for Abuja to improve the standard of its housing
development given that only about half of the original development scheme has been fully
implemented.
The work reported here attempted to evaluate the environmental performance of four of
Abuja’s common housing types and examine opportunities for improving their occupants’
comfort by optimising orientation and solar shading.
All of the rooms are expected to be thermally uncomfortable for more than half of the period
assessed. The level of discomfort in the rooms can be attributed to a number of factors
including, orientation, inadequate window sizing for cross ventilation and a lack of shading
elements to limit overheating. Similarly, all the rooms with the exception of one are expected
to experience several hours of high illuminance levels because of the exposure of openings to
direct sunlight. The frequency of visual discomfort across the rooms examined ranged between
3 % and 86%.
Examining the effects of orientation and window shading on the level of dis/comfort in one of
the studied rooms suggested the following:
A 5% reduction in the frequency of thermal discomfort is possible by changing the room’s orientation from north-east to north-west.
Changing the orientation of the room to south-west could provide a 4% reduction in the frequency of visual discomfort, however orienting it north-west could yield a 29 % reduction.
The use of shading components can help reduce the frequency of thermal discomfort by up to 4% and visual discomfort by 29%.
Since orientating a building is mainly a design decision and has no financial implications on
the occupants, early design choices made with regards to building orientation and performance
ought to be considered in future housing developments. The current increase in the
development of gated residential estates in the city has once again shifted designers’ focus
toward organising dwellings in ways that make optimum use of the land within the estate rather
than investing in environmental improvement measures. In line with the above findings,
designers should be encouraged to consider the layout of spaces within dwellings to limit the
19 shortage of housing supply in the region more analysis is needed to examine the possibility of
maximizing the use of land while improving the quality of the housing indoors by optimizing
passive mode options.
Although the focus of this paper is not directly related to the financial benefits associated with
effective utilisation of passive measures, the reader may find information concerning potential
savings from adapting such approaches informative. As of 2017 the cost of 1kilowatt hour of
electricity for residential properties in Abuja ranges between N24.30-N47.90 [46].The energy
consumption of air-conditioning units commonly used in Abuja’s dwellings was estimated in
2007 at 0.078kW to 0.16kW per hour [47]. Thus, the cost of using one air conditioning unit for
an hour is about N2-8. If the use of a shading element can help reduce the hours of thermal
discomfort in a room during the warmest period in the city by nearly 13 days (156 hours/12
hours cooling a day), thereby negating the use of an air-conditioning unit can potentially save
up to N1,793. In addition, the initial cost of an air-conditioning unit in Nigeria could be as high
as N205, 000, while a concrete fixed shading element with vertical and horizontal components
around a 1.2m x 1.2m window could be built for less than N10000. Thus optimising shading
to reduce the number and the frequency of using air-conditioning units in a household can
contribute to a considerable amount of savings over time. Once again, more analysis is needed
to quantify the impact of using different shading forms on both occupants’ comfort and energy
use.
On a more technical note, a Typical Meteorological Year (TMY) weather data from 2008-2011
for Abuja was compiled and utilised in performing the modelling reported in this paper. In
some instances, the weather file does not accurately represent the conditions observed during
the fieldwork, due to the lack of recorded data. The need for a more accurate metrological data
is an important point to be considered in future research work concerning building performance
in Nigeria.
References
[1] United Nations Department of Economic and Social Affairs, Statistics Division. World Statistics Pocketbook 2016 edition. New York, United Nations Publications.
[2] Festus IA, Amos IO. Housing policy in Nigeria: An overview. American International Journal of Contemporary Research. 2015; 5(2): 53-9.
20 [4] Morenikeji W, Umaru E, Pai H, Jiya S, Idowu O, Adeleye BM. Spatial analysis of housing quality in Nigeria. International Journal of Sustainable Built Environment. 2017 (In Press).
[5] Ojoko EO, Abubakar HO, Ojoko O, Ikpe EO. Sustainable Housing Development in Nigeria: Prospects and Challenges. Journal of Multidisciplinary Engineering Science and Technology. 2016; 3(5): 4851-4860.
[6] Olugbenga TK, Jumah AA, Philips DA. The current and future challenges of electricity market in Nigeria in the face of deregulation process. African Journal of Engineering research. 2013; 1(2): 33-39. [7] International Energy Agency. Africa Energy outlook – a focus on energy prospects in sub-Saharan Africa. Paris: International Energy Agency, 2014.
[8] Otegbulu A. Economics of green design and environmental sustainability. Journal of Sustainable Development. 2011; 4(2): 240-248.
[9] Climate change 2014: mitigation of climate change. Contribution of working group III to the fifth assessment report of the Intergovernmental Panel on Climate Change. Cambridge: Cambridge University Press, 2014.
[10] Nigerian Energy Support Programme [NESP]. The Nigerian energy sector: an overview with a special emphasis on renewable energy, energy efficiency and rural electrification, Abuja, https://www.giz.de/en/downloads/giz2015-en-nigerian-energy-sector.pdf; 2015 [accessed 21.03.16]. [11] Enaburekhan, JS. An energy audit of purpose-built government housing units in Nigeria. Continental Journal of Engineering Sciences. 2007; 1: 1-6.
[12] Irimiya Y, Humphrey IA, Aondover II. Assessment of energy use pattern in residential buildings of Kano and Kaduna Northern Nigeria. American Journal of Engineering Research. 2013; 2(10): 271-275.
[13] Hussaini, IU, Abdul Majid NH. Energy development in Nigeria and the need for strategic energy efficiency practice scheme for the residential building sector. Management of Environmental Quality: An International Journal. 2015; 26(1): 21-36.
[14] Otegbulu AC, Osagie JU, Afe YO. The built environment perspective of climate change-A focus on household activities in Lagos Metropolis. Sustainable Development. 2011; 4(5): 174-187.
[15] Adaji M U, Watkins R, Adler G. Thermal comfort of occupants during the dry and rainy seasons
in Abuja, Nigeria. In Proceedings of 9th Windsor Conference: Making Comfort Relevant, Cumberland
Lodge, Windsor, UK, 2016.
[16] Adunola AO, Ajibola K. Thermal comfort considerations and space use within residential buildings in Ibadan, Nigeria. In Proceedings of 7th Windsor Conference: the Changing Context of Comfort in an Unpredictable World, Windsor, UK, 2012.
[17] Adunola AO. Evaluation of urban residential thermal comfort in relation to indoor and outdoor air temperatures in Ibadan, Nigeria. Building and Environment 2014; 75, 190-205.
[18] Akande OK, Adebamowo MA. Indoor thermal comfort for residential buildings in hot-dry climate of Nigeria. In Proceedings of Conference: Adapting to Change: New Thinking on Comfort, Windsor, UK, 2010.
[19] Akinwolemiwa O, Gwilliam J. Evaluating the Impact of Vertical Greening Systems on Thermal Comfort in Low Income residences in Lagos, Nigeria. Procedia Engineering 2015; 118:420-433. [20] Kalgo, MSU, Ayileka O. (Eds.). The review of the Abuja master plan. Ibadan: Fountain publications, 2001.
[21] Muhammad Z, Johar F, Sabri S, Jonathan ZU. A review of housing provision and the challenges of sustainable housing delivery in the federal capital territory Abuja, Nigeria. Jurnal Teknologi. 2015; 77(14): 23-31.
[22] Atolagbe A M O. House-form and day-lighting: A spatial evaluation of residents’ satisfaction in Ogbomoso, Nigeria. Journal of Geography and Regional Planning 2013; 6(4):103-109.
[23] Koenigsberger OH, Ingersoll T G, Mayhew A, Szokolay SV, Manual of Tropical Housing and Building. Harlow: Longman, 1974.
[24] Agboola OP. Importance of climate to architectural designs in Nigeria. Journal of Environmental Issues and Agriculture in Developing Countries. 2011; 3 (1):15-28.
21 [26] Lawal AF, Akinbami JF, Akinpade JA. Assessing effectiveness of utilization of passive design parameters on active energy consumption in public buildings in warm-humid climate. Journal of Civil Engineering and Construction Technology. 2012; 3(4): 140-147.
[27] Ochedi E T, Taki A, Painter B. Low Cost Approach to Energy Efficient Buildings in Nigeria: A Review of Passive Design Options. In Proceedings of Joint International Conference, 2015.
[28] Isah, AD, Khan TH, Ahmed AS. Discovering design implications of public housing adjustment benefits in Nigeria. Paper presented at the 3rd International Congress on Interdisciplinary Behavior and Social Sciences, Bali, 2014.
[29] Ademiluyi IA. Public housing delivery strategies in Nigeria: A historical perspective of policies and programmes. Journal of Sustainable Development in Africa 2010; 12(6): 153-161.
[30] Federal Capital Development Authority [FCDA]. The master plan for Abuja: the new federal capital of Nigeria. Lagos: FCDA, 1979.
[31] Ukoha OM, Beamish JO. Predictors of housing satisfaction in Abuja, Nigeria. Housing and Society 1996; 23(3): 24-46.
[32] Eludoyin OM. Some aspects of physical climatology in Nigeria. Interdisciplinary Environmental Review 2013; 14(2): 150-185.
[33] Osueke CO, Uzendu P, Ogbonna ID. Study and Evaluation of Solar Energy Variation in Nigeria. International Journal of Emerging Technology and Advanced Engineering 2013; 3(6):501-505. [34] Kim G, Lim H S, Lim T S, Schaefer L, Kim J T. Comparative advantage of an exterior shading device in thermal performance for residential buildings. Energy and Buildings 2012; 46:105–111. [35] Federal Republic of Nigeria. National building code. Durban: LexisNexis, 2006.
[36] Hiscocks PD. Measuring reflectance. http://www.ee.ryerson.ca/~phiscock/astronomy/light-pollution/reflectance-apparatus.pdf, 2011 [accessed 09.11.15]
[37] Kim S, Chung S. Daylighting simulation as an architectural design process in museums installed with toplights. Building and Environment 2011; 46: 210-22.
[38] Al-Maiyah S, Elkadi H. Study on the visual performance of a traditional residential neighborhood in Old Cairo. Journal of Urban Technology 2012; 19(4): 59-86.
[39] Mantzouratos N, Gardiklis D, Dedoussis V, Kerhoulas P. Concise exterior lighting simulation methodology. Building Research & Information 2004; 32(1): 42-7.
[40] Energy Commission of Nigeria. National Energy Policy. Abuja: Energy Commission of Nigeria, 2003.
[41] Oyedepo SO. Towards achieving energy for sustainable development in Nigeria. Renewable and Sustainable Energy Reviews 2014; 34: 255-272.
[42] American Society of Heating Refrigerating and Air Conditioning Engineers. Thermal environmental conditions for human occupancy. Atlanta: American Society of Heating, Refrigerating and Air Conditioning Engineers, 2013.
[43] Sicurella F, Evola G, Wurtz E. A statistical approach for the evaluation of thermal and visual comfort in free-running buildings. Energy and Buildings, 2012; 47: 402-10.
[44] Illuminating Engineering Society of North America. The IESNA lighting handbook: reference & application. 9th ed. New York: Illuminating Engineering Society of North America, 2000.
[45] Uduku O. Modernist architecture and 'the tropical' in West Africa: The tropical architecture movement in West Africa, 1948-1970. Habitat International 2006; 30(3): 396-411.
[46] Nigerian Electricity Regulation Commission. Abuja DISCO tariffs N/kWh
http://www.nercng.org/nercdocs/tariffs/abuja-tariff.pdf [accessed 10.06.17]
22 Figures and Captions:
[image:23.595.159.437.153.352.2][image:23.595.195.407.439.697.2]
Figure. 1. Location of Abuja, Nigeria
23
24
25
Figure. 5. Position of temperature (left) and illuminance data loggers (middle) in the test room
[image:26.595.163.493.416.573.2]26
Figure. 7. Measured and simulated internal air temperature in the test room in B4
[image:27.595.101.495.376.539.2]27
Figure. 9. Measured and simulated internal illuminance levels at point 4 in the test room in B4
[image:28.595.73.516.408.593.2]28
Figure. 11. The level of solar gain, the operative, mean radiant and air temperatures in B1 in comparison to the outdoor dry-bulb temperatures on the 15th of each month in the dry season
[image:29.595.132.466.106.336.2] [image:29.595.129.470.423.652.2]29
Figure. 13. The level of solar gain, the operative, mean radiant and air temperatures in B3 in comparison to the outdoor dry-bulb temperatures on the 15th of each month in the dry season
[image:30.595.128.468.111.341.2] [image:30.595.130.469.431.662.2]30
Figure. 15. The average daylight illuminance levels in B1 on the 15th of each month in the dry season
[image:31.595.128.470.382.584.2]31
Figure. 17. The average daylight illuminance levels in B3 on the 15th of each month in the dry season
[image:32.595.129.470.393.597.2]32 Figure. 19. Images of illuminance levels on working plane in the four rooms at 1 pm on the 15th of each month in the dry season
B1
November December January February March April
B2
November December January February March April
B3
November December January February March April
B4
33
Figure. 20. Residential buildings in Abuja with improvised egg-crate shading, retrofitted overhangs and reflective glazing (2014)
Figure. 21. (a_left) Alternative orientations simulated for the room in B4, (b_right) Impact of
[image:34.595.76.557.110.237.2] [image:34.595.116.482.370.559.2]34 Figure. 22. Illustration of the existing façade design, as well as alternative designs with three different window shading sizes
[image:35.595.203.391.312.478.2]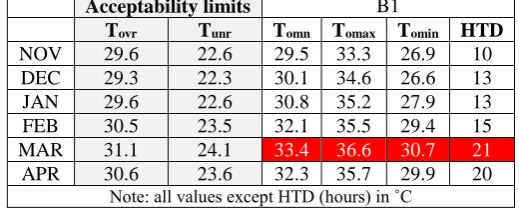
![Table. 2. The mean, maximum, minimum illuminance levels and hours of visual discomfort in B1 on the 15 day of each month during the dry season [mentioned red highlighted values]](https://thumb-us.123doks.com/thumbv2/123dok_us/8682412.875036/11.595.169.431.480.588/maximum-minimum-illuminance-levels-visual-discomfort-mentioned-highlighted.webp)