An g ul a r r e fl e c t a n c e of l e a v e s
wi t h a d u a l-w a v el e n g t h
t e r r e s t ri al lid a r a n d it s
i m plic a ti o n s fo r l e af-b a r k
s e p a r a ti o n a n d l e af m oi s t u r e
e s ti m a ti o n
H a n c o c k, S, G a ul t o n , R a n d D a n s o n , F M
h t t p :// dx. d oi.o r g / 1 0 . 1 1 0 9 /TGRS. 2 0 1 7 . 2 6 5 2 1 4 0
T i t l e
An g ul a r r efl e c t a n c e of l e a v e s wi t h a d u a l-w a v el e n g t h
t e r r e s t ri al li d a r a n d it s i m plic a tio n s fo r l e af-b a r k
s e p a r a ti o n a n d l e af m o i s t u r e e s ti m a ti o n
A u t h o r s
H a n c o c k , S, G a ul t o n , R a n d D a n s o n , F M
Typ e
Ar ticl e
U RL
T hi s v e r si o n is a v ail a bl e a t :
h t t p :// u sir. s alfo r d . a c . u k /i d/ e p ri n t/ 4 1 3 1 5 /
P u b l i s h e d D a t e
2 0 1 7
U S IR is a d i gi t al c oll e c ti o n of t h e r e s e a r c h o u t p u t of t h e U n iv e r si ty of S alfo r d .
W h e r e c o p y ri g h t p e r m i t s , f ull t e x t m a t e r i al h el d i n t h e r e p o si t o r y is m a d e
f r e ely a v ail a bl e o nli n e a n d c a n b e r e a d , d o w nl o a d e d a n d c o pi e d fo r n o
n-c o m m e r n-ci al p r iv a t e s t u d y o r r e s e a r n-c h p u r p o s e s . Pl e a s e n-c h e n-c k t h e m a n u s n-c ri p t
fo r a n y f u r t h e r c o p y ri g h t r e s t r i c ti o n s .
1
Angular reflectance of leaves with a
dual-wavelength terrestrial lidar and its implications
for leaf-bark separation and leaf moisture estimation
Steven Hancock, Rachel Gaulton F. Mark Danson
Abstract—A new generation of multi-wavelength lidars offer the potential to measure the structure and biochemistry of vegetation simultaneously, using range resolved spectra indices to overcome the confounding effects in passive optical measure-ments. However, the reflectance of leaves depends on angle of incidence and if this dependence varies between wavelengths, the resulting spectral indices will also vary with angle of incidence, complicating their use in separating structural and biochemical effects in vegetation canopies. The SALCA dual-wavelength terrestrial laser scanner (Salford Advanced Laser Canopy Analyser) was used to measure the angular dependence of reflectance for a range of leaves at the wavelengths used by the new generation of multi-wavelength lidars, 1063 nm and 1545nm, as used by SALCA, DWEL and the Optech Titan. The influence of the angle of incidence on the Normalised Difference Index of these wavelengths (NDI) was also assessed.
The reflectance at both wavelengths depended on the angle of incidence, was non-Lambertian and could be well modelled as a cosine. The change in NDI with leaf angle of incidence was small compared to the observed difference in NDI between fresh and dry leaves and between leaf and bark. Therefore it is concluded that angular effects will not significantly impact leaf moisture retrievals or prevent leaf/bark separation for the wavelengths used in the new generation of 1063 nm and 1545 nm multi-wavelength lidars.
Index Terms—Remote sensing, Vegetation, Technology assess-ment, Laser radar
I. INTRODUCTION
Terrestrial vegetation plays a key role in many processes and knowledge of its structure and biochemistry is needed to understand its function. Data from passive optical sensors is widely used to map and monitor vegetation, but are unable to separate structural and biochemical effects [1], requiring either direct measurements (limited in coverage) or assumptions of either structure or biochemistry to study vegetation processes. Lidar’s ability to measure vegetation structure has been com-prehensively proven in a large number of studies, for example [2], [3], [4].
A new generation of terrestrial and airborne multi-wavelength lidars have the potential to simultaneously measure structure and chemistry by making measurements of range and reflectance of multiple wavelengths at high-resolution (hemispherical scans of 1 mrad spacing for terrestrial and
S. Hancock is with the University of Maryland Department of Geographical Sciences, USA. E-mail [email protected]
R. Gaulton is with Newcastle University School of Civil Engineering and Geosciences, UK
F. M. Danson is with Salford University School of Environment & Life Sciences, UK
up to 80 points/m2 for airborne). This allows improved land cover classifications [5], [6] and vegetation biochemistry to be studied [7], [8]. Terrestrial laser scanner (TLS) systems have been tested in laboratory conditions on individual leaves at fixed angles of incidence to show that leaf water [8] and chlorophyll content [9] can be derived. In field conditions, leaves will be at a range of angles of incidence and previous studies have shown that leaf reflectance depends on angle of incidence [10], [11], [12], therefore estimates of biochemistry could depend upon angle of incidence. For example, Eitel et al., [13] found that for their dual-wavelength lidar (532 nm and 658 nm), angular effects limited the accuracy of leaf nitrogen estimates. Kaasalainen et al., [14] tested three spectral indices using an eight wavelength lidar (between 555 nm and 1000 nm) and found that differences in angular reflectances between the visible and infrared wavelengths caused large angular dependencies. However, the results of Shi et al., [15] contradict both of these studies, finding no angular dependence of three spectral indices using wavelengths between 556 nm and 780 nm, so there is some uncertainty in the literature.
The reflection of light from, or penetration through, a leaf surface and absorption by elements within a leaf depends on the wavelength, particularly the ratio of the wavelength to scatterer size. At near infrared (NIR), light is only absorbed by the relatively sparse leaf dry matter and so there may be significant multiple scattering within the leaf, whilst at short-wave infrared (SWIR) absorption is dominated by water and so the amount of within-leaf multiple scattering may depend on water content [16]. At visible wavelengths, chlorophyll absorbs most of the light that penetrates into a leaf and so the majority of reflected light is from the leaf surface [14]. These three optical regimes of leaves are illustrated in Fig. 1 along with the wavelengths of this and previous studies.
0 0.1 0.2 0.3 0.4 0.5 0.6
600 800 1000 1200 1400 1600
Visible NIR SWIR
SALCA and DWEL
Optech Titan
Zhu Eitel Kaasalainen
Reflectance
[image:4.612.84.262.60.183.2]Wavelength (nm)
Fig. 1. Leaf reflectance with optical regimes labelled and wavelengths of SALCA, DWEL and Optech Titan and those of instruments used in the previous studies of Kaasalainen et al. (2016) [14], Eitel et al. (2014) [13] and Zhu et al. (2015) [12]
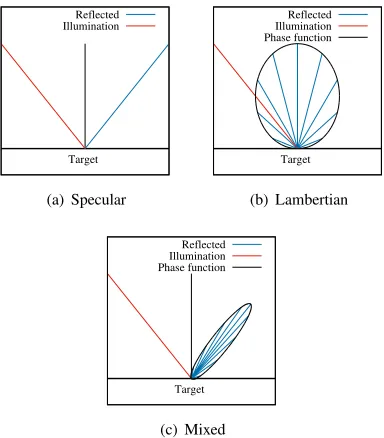
from wavelengths that are strongly absorbed within the leaf will be made up of mainly surface reflections, which are predominantly specular (Fig. 2(a)), although roughness within the laser footprint spreads this out to be more like Fig. 2(c), and so the relative size of the laser footprint to the target roughness is also important. A 5 mm TLS spot is likely to illuminate a single, smooth target whilst a 20 cm airborne lidar footprint may illuminate multiple objects, increasing the roughness. Note that lidars measure in the hot-spot direction [18], where the light source and detector view along the same vector, and so they do not experience the same bidirectional reflectance effects due to macro-structure as passive systems [17], only target scattering mechanisms [19].
A lidar illuminating a specular target will receive little return energy unless the laser is at right angles to the surface. A lidar illuminating a Lambertian target will receive the same return energy at all angles of incidence (the cosine of the reflected intensity is exactly balanced by the area within the footprint increasing by one over the cosine). The ratio of specular to Lambertian reflectance from a leaf is then controlled by the ratio of light returned from multiple scattering within the leaf and single scattered light from the surface (in turn controlled by the within leaf absorption at that wavelength) and the variation in angles of incidence within the laser footprint (controlled by laser footprint size and surface roughness).
The angle of incidence will never be known for all targets in a vegetation canopy, especially for small leaves and needles, and so in order to use spectral indices in the field, the phase functions at the two wavelengths must be near constant. The majority of past studies have used passive systems. The par-ticular arrangement and coherence of lidars could significantly deviate from these measurements [18], [17] and the angular dependence of spectral indices from the wavelengths used by the new generation of dual-wavelength lidars (1063 nm and 1545 nm) have not yet been investigated.
This paper investigates whether the wavelengths used in the two currently operational dual-wavelength, full-waveform TLS instruments, SALCA (Salford Advanced Laser Canopy Analyser) and DWEL (Dual-Wavelength Echidna Lidar) [20], [21], have significantly different phase functions and so will cause the derived spectral indices, such as the Normalised
Target Reflected Illumination
(a) Specular
Target Reflected Illumination Phase function
(b) Lambertian
Target Reflected Illumination Phase function
(c) Mixed
Fig. 2. Illustration of phase functions. The length of reflected ray lines indicate relative intensity and the phase function envelope (black curve) shows the intensity returned at all angles. The integral of the phase function envelope is the single scattering albedo for targets with no transmittance.
Difference Index (NDI, equation 1), to vary. The magnitude of any variation in NDI was compared to the change in NDI with leaf moisture and between leaves and bark, which are the distinctions that the SALCA lidar is designed to make [8], [20]. These wavelengths are also used in the multi-band Optech Titan airborne lidar [5] and combinations of Riegl airborne systems [22] and so the results have relevance beyond TLS, although the larger laser footprint of airborne sensors compared to TLS will mean that a range of angles of incidence will always be encountered. In addition, the Riegl VZ-400 TLS has a single 1545 nm laser and the intensity of returns has been used to separate leaf and bark [23], [4] and to measure leaf moisture when the angle of incidence is known [12], and so it is important to understand the dependence of intensity on angle of incidence.
II. MATERIALS ANDMETHODS
A. Lidar
Data were collected using the SALCA dual-wavelength, full-waveform terrestrial laser scanner [20]. The return energy was calculated using the “sum method” described in Hancock et al., [24], found to be the most accurate for SALCA. This was calibrated to reflectance using non-linear fitting to returns from targets of known reflectance, described in appendix A. The NDI accuracy was 0.055 root mean square error (RMSE) with a bias of 0.027. Scans were performed at 1 mrad resolution, giving a point spacing of 6 mm and laser footprints of 9 mm for 1063 nm and 10 mm for 1545 nm at the leaf samples 6 m from the scan centre. This gave a 9 to 10 mm resolution image of the target at 1063 nm and 1545 nm.
[image:4.612.341.533.62.281.2]3
N DI=ρ1063−ρ1545
ρ1063+ρ1545
(1) Whereρ1063andρ1545are the reflectances at 1063 nm and
1545 nm respectively. The mean reflectances and NDIs were calculated for each leaf, only including laser shots that were entirely blocked by leaves.
B. Leaves
Leaves were collected from complete plants at the New-castle University Botanic Gardens during March 2013. Due to the time of year the choice was limited to evergreen and indoor plants. Eucalyptus (species unknown) were chosen to represent matt leaves and peace lily (Spathiphyllum) and laurel (Laurus nobilis) to represent glossy leaves. Fresh and browning eucalyptus leaves were used to assess the impact of leaf health on phase function. Measurements were taken of three brown eucalyptus leaves, seven fresh eucalyptus (alternating topside and underside), one peace lily and one laurel. Measurements of leaf water content were not made due to time constraints.
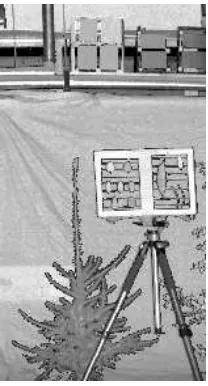
Leaves were suspended in a frame by thin black thread, shown in Fig. 3. Note that the dark lines around objects are due to partial hits [25], which were not used in the analysis. This thread covered only a small area of leaf and so had a negligible effect on the total leaf reflectance. The frame was mounted on a tripod with a built in protractor. The whole frame was rotated and separate scans made in 5o increments from -50oto +50o (at angles of incidence greater than 50othe leaf signal became mixed with returns from the leaf holder and so could not be used). This gave two repeat measurements per laser angle of incidence. For some leaves the angular range was smaller due to their position in the holder. Absolute leaf angle accuracy was on the order of ten degrees (due to leaves not lying flat to the frame) and relative accuracy was around 1 degree (finer steps could not accurately be seen on the tripod protractor). The frame was 42 cm across so that leaves at the extremes would have slightly different angles of incidence. The variation in leaf angle was accounted for by calculating the angle of maximum reflectance (normal angle of incidence) separately for each leaf.
C. Angular reflectance
The angular dependence of reflectance was quantified by fitting a cosine function to the observed reflectance with angle [11].
y=Aycos(2(θ−µ)) +ν (2)
WhereAis the amplitude, describing the magnitude of the angular dependence, θ is the angle of incidence, µ is the angle of the peak reflectance, which will be the leaf holder angle at which that leaf was normal to the laser, and ν is an offset to allow the NDI to have a non-zero base (the NDI will not be zero at an angle of incidence of 90o). y can either be the reflectance at 1545 nm or 1063 nm (ρ1545 or ρ1063
[image:5.612.386.490.54.247.2]respectively) or the NDI.
Fig. 3. SALCA scan of the leaf holder on rotatable tripod with calibration panels above. Other objects in the scene were for different experiments.
D. Non-angular NDI variations
In order to assess the impact of any NDI variation with angle of incidence on a dual-wavelength lidar’s ability to distinguish leaf from bark [20] or to estimate leaf water content [8], the magnitude of NDI variations due to these factor were assessed and compared to the variations due to angle of incidence.
To assess the change in NDI with leaf water, leaves from eu-calyptus (four leaves), calico flower,Aristolochia elegens(two leaves), avocado pear tree (Persea americana, two leaves), bird’s nest fern,Asplenium nidus(two leaves) and jade plant,
Crassula ovata(three leaves), collected from the former New-castle University botanic gardens, were measured by an ASD Field Spec Pro spectroradiometer with a contact probe (ASD inc., Boulder, CO, USA), scanned by SALCA and weighed at regular intervals as they dried in air. These were different leaves to those used in the angular reflectance experiments. The leaves started at complete health and were allowed to dry naturally over two days, with repeat measurements taken as often as possible (every two to three hours during the day). The ASD contact probe had a 1 cm window, provided its own illumination source and maintained a constant view geometry (detector fixed at 8o to target), ensuring that angular and structural effects were constant between measurements. The SALCA measurements were not used in this study, instead the ASD measured spectra were used to calculate the NDI at the same wavelengths as SALCA, which gave the same trend as the SALCA data but with less noise. Leaf water content was calculated by dividing leaf weights by the dry weight, found by weighing after placing in an oven at 40oC for three days. This is a repeat of the experiment described in Gaulton et al., [8].
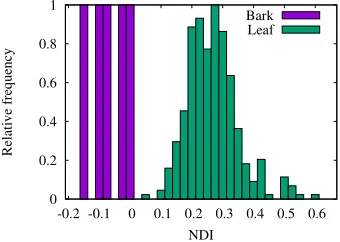
NDI at SALCA’s wavelengths from all leaves (315 spectra covering a wide range of species) and bark (5 spectra) samples in the database were extracted and the separation of the means and overlap of the resulting distributions calculated. Only a very small number of bark samples were available and these results can only be considered as tentative.
III. RESULTS
Fig. 4(a) shows the reflectance against leaf holder angle for a single leaf (a brown eucalyptus), which has a similar shape to all other leaves. Bars on the reflectance plot show one standard deviation between SALCA footprints across the leaf (each footprint gave one measure of reflectance). These are larger than the between-angle variation due to instrument noise and variation within a leaf, especially along veins [8]. Noise contributed up to a maximum of 5.5% of the variation, from the calibration assessment in appendix C. Reflectance for all leaves showed a clear cosine angular dependence. Only two out of three of the brown eucalyptus leaves (beuc2 and beuc3) showed a small specular peak for 1063 nm and so NDI. This is likely to be due to the lack of multiple scattering within the brown leaf so that specular reflection from the surface was relatively stronger than for the healthy leaves [11]. None of the fresh leaves showed this specular effect, including the waxy laurel and peace lily leaves. Whilst these leaves do have strong specular peaks at visible wavelengths, this was not apparent from these measurements made in the infra-red, most likely due to within-leaf scattering.
The angular dependence of reflectance should be taken into account when attempting to calculate partial hit area for gap fraction [25] and may need to be accounted for when using a single wavelength lidar to separate leaf from bark [23], [4] or to estimate biochemistry, which in turn requires knowledge of the angle of incidence of the target [12]. It should be noted that the leaf from bark separation used in B´eland et al., [23] and Calders et al., [4] relied upon leaves having a lower reflectance than bark at 1545 nm and so these leaf angular effects would help rather than hinder the distinction, although the change in bark reflectance with angle of incidence was not measured, which may impact the separability. Measuring biochemistry from single wavelength lidar may be more problematic as the angle of incidence must be known for every return [12], which will be a considerable challenge.
Fig. 4(b) shows the NDI against angle of incidence for all leaves. The amplitudes of the cosines fitted to describe the variation of NDI and reflectance with angle of incidence (Ain equation 2) are shown in table I, along with the mean NDI for all footprints within each leaf. The mean of the angular NDI amplitude for all leaves (mean of AN DI) was 0.026, which
is less than the noise level. There was a single outlier for the fresh eucalyptus leaves (euct4) with an NDI amplitude of 0.14. This was due to a specular peak in the 1063 nm reflectance and may have been exacerbated by a smaller angular range (-25o to 25o) for that leaf due to its position in the holding frame, increasing the uncertainty of the cosine fitting. In all cases, reflectance at 1063 nm showed a greater angular dependence than that at 1545 nm, but the normalised difference of the two
Eucalyptus underside 0.036 0.144 0.201 0.11 eucu1 Eucalyptus underside 0.022 0.215 0.241 0.06 eucu2 Eucalyptus underside 0.013 0.231 0.234 0.05 eucu3 Eucalyptus topside 0.022 0.025 0.220 0.20 euct1 Eucalyptus topside -0.005 0.213 0.319 0.10 euct2 Eucalyptus topside 0.058 0.067 0.258 0.38 euct3 Eucalyptus topside 0.140 0.054 0.245 0.33 euct4 Brown eucalyptus 0.005 0.322 0.396 0.04 beuc1 Brown eucalyptus 0.024 0.161 0.227 0.14 beuc2 Brown eucalyptus 0.080 0.260 0.412 0.05 beuc3 Peace lily -0.004 0.096 0.144 0.15 lily1 Laurel 0.038 0.088 0.375 0.39 laur1
TABLE I
AMPLITUDE OF FITTED ANGULAR FUNCTION(EQUATION2)FOR
SALCAMEASURED REFLECTANCE AT EACH WAVELENGTH (Aρ1545ANDAρ1063)ANDNDI (AN DI)ALONG WITH THE MEAN
NDI (N DI)
reflectances varied less than the instrument noise, except for the single outlier. The specular peaks for brown eucalyptus leaves at 1063 nm caused a peak in the NDI 0.06 higher than the mean, a small amount, comparable to instrument noise.
A. Results for non-angular NDI variations
Table II shows the total change in leaf water content (fraction of leaf weight made from water) and ASD measured NDI for the drying leaves. Fig. 5 shows some representative examples. The eucalyptus, calico flower and avocado pear tree leaves showed a mean change in NDI of 0.2 as the leaf water content reduced by 50%. The succulent leaves (jade plant and bird’s nest fern) had much smaller decreases in leaf water content and much smaller corresponding NDI increases. For the leaves that did show a significant change in water content, the change in NDI during drying was a factor of ten greater than the angular NDI amplitudes found (which were smaller than the noise level). Gaulton et al., [8] showed NDI varying by 0.4 across the observed range of leaf water content, larger than the magnitude found here, although this included the difference between leaves of different thicknesses and so starting leaf water contents. For the non-succulent leaves tested, an angular uncertainty in NDI of 0.02 would give a minimum detectable water content change of 0.9% whilst the noise limit of 0.055 would set the minimum detectable water content change to 2.4%.
5
0 0.2 0.4 0.6 0.8 1
-40 -30 -20 -10 0 10 20 30 40 50
Reflectance
Leaf holder angle (degrees) 1545 nm 1063 nm
(a) Reflectance, brown eucalyptus, beuc1
-0.2 0 0.2 0.4 0.6
-60 -40 -20 0 20 40 60 80
NDI
Leaf holder angle (degrees) euct1 euct2 euct3 euct4 eucu1 eucu2 eucu3 beuc1 beuc2 beuc3 lily1 laur1
[image:7.612.127.484.60.191.2](b) NDI
Fig. 4. Reflectance against leaf holder angle for one representative leaf and NDI against leaf holder angle for all leaves. Note that leaves may not have been aligned with the leaf holder. Bars show one standard deviation of reflectance between SALCA footprints.
0.1 0.15 0.2 0.25 0.3 0.35 0.4
0 5 10 15 20 25 30 35 40 45 50
NDI
Fractional water content (%)
(a) Eucalyptus, euc1
0.06 0.08 0.1 0.12 0.14 0.16 0.18 0.2 0.22 0.24 0.26
0 10 20 30 40 50 60 70
NDI
Fractional water content (%)
(b) Avocado pear tree, avc1
0.5 0.52 0.54 0.56 0.58 0.6 0.62 0.64 0.66
0 10 20 30 40 50 60 70 80 90
NDI
Fractional water content (%)
(c) Bird’s nest fern, fer1
0.68 0.7 0.72 0.74 0.76 0.78 0.8 0.82 0.84 0.86
0 10 20 30 40 50 60 70 80
NDI
Fractional water content (%)
[image:7.612.117.488.240.512.2](d)Jade plant, jad1
Fig. 5. ASD measured NDI against leaf weight whilst drying for two broadleaves and two succulent leaves
Leaf ∆w ∆N DI Label
Calico flower 66.2 % 0.20 cal1 Calico flower 64.2 % 0.35 cal2 Eucalyptus 46.8 % 0.23 euc1 Eucalyptus 45.8 % 0.22 euc2 Eucalyptus 46.8 % 0.17 euc3 Eucalyptus 43.9 % 0.23 euc4 Avocado pear 65.9 % 0.15 avc1 Avocado pear 69.0 % 0.14 avc2 Bird’s nest fern 7.7 % 0.07 fer1 Bird’s nest fern 17.1 % 0.08 fer2 Jade plant 1.5 % -0.14 jad1 Jade plant 1.0 % 0.01 jad2 Jade plant 1.0 % 0.02 jad3
TABLE II
TOTAL CHANGE IN FRACTIONAL LEAF WATER CONTENT(∆w)
ANDASDMEASUREDNDI (∆N DI)FOR LEAVES DRYING IN AIR
OVER TWO DAYS
0 0.2 0.4 0.6 0.8 1
-0.2 -0.1 0 0.1 0.2 0.3 0.4 0.5 0.6
Relative frequency
NDI Bark
Leaf
Fig. 6. NDI histograms for leaf and bark from the LOPEX93 database
IV. CONCLUSIONS
[image:7.612.348.518.558.679.2] [image:7.612.48.220.558.693.2]lidars (1063 nm in the near infrared and 1545 nm in the shortwave infrared) showed angular effects, the impact of this on the Normalised Difference Index (NDI) was small, smaller than the uncertainty from instrument noise. The change in NDI with leaf water content was larger than the change with angle of incidence. Brown (unhealthy) leaves showed greater dependence of NDI on angle of incidence than fresh leaves, but the maximum observed NDI amplitude was smaller than the change with moisture content and comparable to the noise limit. This angular effect may set a lower limit on the detectable moisture content change. Therefore the NDI can be used to investigate leaf water content [8] without knowledge of the angle of incidence of the target, greatly simplifying the application of TLS to canopy scale moisture estimates [12]. These wavelengths, 1063 nm and 1545 nm, do not suffer from the difference in angular reflectance for leaves between near infra-red and visible lasers reported in previous studies [13], [14] due to the different optical regimes.
Similarly the difference between leaf and bark NDI values were large compared to the variation of leaf NDI with angle of incidence and so we tentatively conclude that angular effects are unlikely to have an impact on the ability of dual-wavelength TLS to separate leaf and wood, although a very small sample of bark samples were available. The change in NDI with bark angle of incidence was not investigated and further work in this area is ongoing.
ACKNOWLEDGEMENTS
This work was funded by NERC New Investigators Grant NE/K000071/1 (PI R. Gaulton). Thanks to the Douglas Bom-ford trust for funding S. Hancock’s participation in the work that lead to the SALCA calibration described here. Thanks to Lucy Schofield for collecting the data used in SALCA’s calibration, John Armston and Australia’s Department of Sci-ence, Information Technology and Innovation for building the calibration panels and the Terrestrial Laser Scanning International Interest Group, under the umbrella of which the calibration experiment took place (http://tlsiig.bu.edu/). Finally thanks to the former Newcastle University Botanic Gardens for providing the leaves used in this experiment and to the three anonymous reviewers for their helpful comments.
APPENDIX
A. Calibration equation
The method proposed to calibrate SALCA in Schofield et al., [27] could not be implemented here as the laser temper-ature sensors required for that method had not been installed when this study was performed. An alternative method was developed, using targets of known reflectance to calculate laser power.
For SALCA, the recorded digital number, DN, is non-linearly related to the effective target reflectance, ρef f,
ob-served to be:
DN = (mρef f +c) 1−e−kρef f
(3) Where m, c and k are fitting constants and ρef f is the
effective reflectance of the target, given by:
ρef f =ρΨP0f(r) Ap Af
(4) Where ρ is the target reflectance, Ψ is the angular phase function,P0 is the outgoing laser power as a fraction of the
maximum,f(r)is the range dependence function and Ap
Af is
the ratio of the projected area of the target,Ap, to the footprint
area,Af. For a target that fully fills the field of view AApf = 1.
The laser power,P0, varies from scan to scan and is a function
of laser temperature. ρ of each target was measured using an ASD Field Spec Pro spectroradiometer with contact probe (ASD inc., Boulder, CO, USA) and Ψwas set to one as the calibration panels were fixed near orthogonal to the laser beam throughout the experiment.
By plotting the reflectance against range for scans that were known to have constant laser power (scans for which the fixed range targets had consistent return strengths), the range dependence was found to be:
f(r) = 1
ra
1−e−k
2rk3
(5) Whereris range anda,k2andk3are fitting constants. This
is similar to the calibration method developed for DWEL [28].
B. Calibration data
Two calibration panels were used, each with six targets of known reflectance (measured with an ASD Field Spec Pro spectroradiometer with contact probe (ASD inc., Boulder, CO, USA)) using a water-based matt paint (J. Armston, 2013, Personal Communication). Barium sulphate powder was added to the brightest panel to reduce specular reflection. One panel was fixed at a range of 8 m whilst the second was varied between 2 m and 60 m from SALCA’s scan centre. Scans were made at different ranges, taking care to cover the ranges of known features in equation 5.
C. Fitting the calibration
The calibration parameters were determined by fitting the observed DN to the known ρef f values of the calibration
panels using the MINPACK implementation of the Levenberg-Marquardt method [29]. Initially an attempt was made to fit all parameters to all the data at the same time, but strong coupling between variables, particularlym andP0, prevented an
accu-rate result. Instead, first the non-linear response variables (m,
c and k) were found by fitting equation 3 to the single scan of the fixed range (8m) target that best straddled an observed non-linearity at a DN of 350, so that P0 andf(r) could be
treated as constants of 1.
Next the laser powers, P0, were found for each scan by
fitting equations 3 and 4 to the fixed range targets using the known values form,candk. Finally the range parameters (a,
k2 andk3) were found by fitting to the movable targets with
all other parameters fixed. The calibration parameters for each wavelength are given in table III.
7
Parameter 1545 nm 1063 nm
m 137.21 35.19
c 407.04 342.45
k 16.83 7.33
a 1.50 1.98
k2 0.18 0.54
k3 0.84 0.64
TABLE III
SALCACALIBRATION PARAMETERS
spectroradiometer with contact probe (ASD inc., Boulder, CO, USA)). This was a different calibration panel to those used to find the calibration parameters and was made by painting medium density fibre board with different mixtures of Humbrol matt white (34) and black (33) paint. The laser power had to be calculated for each scan by fitting to the targets, so the calibration could not be entirely independent, but any errors in the calibration would be apparent as a trend in the errors with reflectance or range. The SALCA retrieved reflectance had 5.6% root mean square error (RMSE) and -1.9% bias for 1545 nm and -1.9% RMSE and +0.02% bias for 1063 nm. No trend with target reflectance or range was apparent, suggesting that the calibration was successful. This translated to a mean NDI bias of 0.027 and an RMSE of 0.055. For the leaf scans, laser power,P0, was calculated for
each SALCA scan by fitting equation 4 to returns from the calibration panels in Fig. 3.
REFERENCES
[1] K. O. Niemann, G. Quinn, D. G. Goodenough, F. Visintini, and R. Loos, “Addressing the effects of canopy structure on the remote sensing of foliar chemistry of a 3-dimensional, radiometrically porous surface,”
Selected Topics in Applied Earth Observations and Remote Sensing, IEEE Journal of, vol. 5, no. 2, pp. 584–593, 2012.
[2] D. J. Harding and C. C. Carabajal, “Icesat waveform measurements of within-footprint topographic relief and vegetation vertical structure,”
Geophysical Research Letters, vol. 32, p. L21S10, 2005.
[3] J. Armston, M. Disney, P. Lewis, P. Scarth, S. Phinn, R. Lucas, P. Bunting, and N. Goodwin, “Direct retrieval of canopy gap probability using airborne waveform lidar,” Remote Sensing of Environment, vol. 134, pp. 24–38, 2013.
[4] K. Calders, G. Newnham, A. Burt, S. Murphy, P. Raumonen, M. Herold, D. Culvenor, V. Avitabile, M. Disney, J. Armstonet al., “Nondestructive estimates of above-ground biomass using terrestrial laser scanning,”
Methods in Ecology and Evolution, vol. 6, no. 2, pp. 198–208, 2015. [5] V. Wichmann, M. Bremer, J. Lindenberger, M. Rutzinger, C. Georges,
and F. Petrini-Monteferri, “Evaluating the potential of multispectral airborne lidar for topographic mapping and land cover classification,”
ISPRS Annals of Photogrammetry, Remote Sensing and Spatial Infor-mation Sciences, vol. 1, pp. 113–119, 2015.
[6] W. Y. Anthony, D. J. Harding, and P. W. Dabney, “Laser transmitter design and performance for the slope imaging multi-polarization photon-counting lidar (simpl) instrument,” inSPIE LASE. International Society for Optics and Photonics, 2016, pp. 97 260J–97 260J.
[7] F. Morsdorf, C. Nichol, T. Malthus, and I. H. Woodhouse, “Assessing forest structural and physiological information content of multi-spectral lidar waveforms by radiative transfer modelling,” Remote Sensing of Environment, vol. 113, pp. 2152–2163, 2009.
[8] R. Gaulton, F. M. Danson, F. A. Ramirez, and O. Gunawan, “The potential of dual-wavelength laser scanning for estimating vegetation moisture content,”Remote Sensing of Environment, vol. 132, pp. 32–39, 2013.
[9] O. Nevalainen, T. Hakala, J. Suomalainen, R. M¨akip¨a¨a, M. Peltoniemi, A. Krooks, and S. Kaasalainen, “Fast and nondestructive method for leaf level chlorophyll estimation using hyperspectral lidar,”Agricultural and Forest Meteorology, vol. 198, pp. 250–258, 2014.
[10] J. M. Kestner, H. W. Leidecker, J. R. Irons, J. A. Smith, T. W. Brakke, and N. A. Horning, “Goniometric observations of light scattered from soils and leaves,” in 1988 Orlando Technical Symposium. Orlando: International Society for Optics and Photonics, 1988, pp. 161–169. [11] T. W. Brakke, J. A. Smith, and J. M. Harnden, “Bidirectional scattering
of light from tree leaves,”Remote Sensing of Environment, vol. 29, no. 2, pp. 175–183, 1989.
[12] X. Zhu, T. Wang, R. Darvishzadeh, A. K. Skidmore, and K. O. Niemann, “3d leaf water content mapping using terrestrial laser scanner backscatter intensity with radiometric correction,” ISPRS Journal of Photogrammetry and Remote Sensing, vol. 110, pp. 14–23, 2015. [13] J. U. Eitel, T. S. Magney, L. A. Vierling, and G. Dittmar, “Assessment
of crop foliar nitrogen using a novel dual-wavelength laser system and implications for conducting laser-based plant physiology,” ISPRS Journal of Photogrammetry and Remote Sensing, vol. 97, pp. 229–240, 2014.
[14] S. Kaasalainen, O. Nevalainen, T. Hakala, and K. Anttila, “Incidence angle dependency of leaf vegetation indices from hyperspectral lidar measurements,”Photogrammetrie-Fernerkundung-Geoinformation, vol. 2016, no. 2, pp. 75–84, 2016.
[15] S. Shi, S. Song, W. Gong, L. Du, B. Zhu, and X. Huang, “Improving backscatter intensity calibration for multispectral lidar,”Geoscience and Remote Sensing Letters, IEEE, vol. 12, no. 7, pp. 1421–1425, 2015. [16] S. Jacquemoud and S. L. Ustin, “Leaf optical properties: A state of
the art,” in 8th International Symposium of Physical Measurements & Signatures in Remote Sensing, Aussois (France), 2001, pp. 223–332. [17] S. Sandmeier and A. Strahler, “Brdf laboratory measurements,”Remote
Sensing Reviews, vol. 18, no. 2-4, pp. 481–502, 2000.
[18] H. Seeliger, “Theorie der beleuchtun staubformiger kosmishen masses insbesondere des saturinges,”Abhandl. Bayer. Akad. Wiss. Math-Nature. Kl. II, vol. 18, pp. 1–72, 1895.
[19] W. A. Allen, “Transmission of isotropic light across a dielectric surface in two and three dimensions,”Journal of the Optical Society of America, vol. 63, no. 6, pp. 664–666, 1973.
[20] F. M. Danson, R. Gaulton, R. P. Armitage, M. Disney, O. Gunawan, P. Lewis, G. Pearson, and A. F. Ramirez, “Developing a dual-wavelength full-waveform terrestrial laser scanner to characterize forest canopy structure,” Agricultural and Forest Meteorology, vol. 198, pp. 7–14, 2014.
[21] E. S. Douglas, J. Martel, Z. Li, G. Howe, K. Hewawasam, R. A. Marshall, C. L. Schaaf, T. A. Cook, G. J. Newnham, A. Strahler, and S. Chakrabarti, “Finding leaves in the forest: The dual-wavelength echidna lidar,” IEEE Geoscience and Remote Sensing Letters, vol. 12, no. 4, pp. 776–780, 2015, dOI: 10.1109/LGRS.2014.2361812. [22] S. Fleming, A. Cottin, and I. H. Woodhouse, “The first spectral map of
a forest understorey from multispectral lidar,”Lidar News, vol. 5, no. 1, pp. 26–30, 2015.
[23] M. B´eland, J.-L. Widlowski, R. A. Fournier, J.-F. Cˆot´e, and M. M. Verstraete, “Estimating leaf area distribution in savanna trees from terrestrial lidar measurements,” Agricultural and Forest Meteorology, vol. 151, no. 9, pp. 1252–1266, 2011.
[24] S. Hancock, J. Armston, Z. Li, R. Gaulton, P. Lewis, M. Disney, F. M. Danson, A. Strahler, C. Schaaf, K. Anderson et al., “Waveform lidar over vegetation: An evaluation of inversion methods for estimating return energy,”Remote Sensing of Environment, vol. 164, pp. 208–224, 2015. [25] S. Hancock, R. Essery, T. Reid, J. Carle, R. Baxter, N. Rutter, and B. Huntley, “Characterising forest gap fraction with terrestrial lidar and photography: An examination of relative limitations,”Agricultural and Forest Meteorology, vol. 189, pp. 105–114, 2014.
[26] B. Hosgood, S. Jacquemoud, G. Andreoli, J. Verdebout, G. Pedrini, and G. Schmuck,Leaf Optical Properties EXperiment 93 (LOPEX93). Ispra, Italy: European Comission - Joint Research Centre, 1994, eUR 16095 EN.
[27] L. A. Schofield, F. M. Danson, N. S. Entwistle, R. Gaulton, and S. Hancock, “Radiometric calibration of a dual-wavelength terrestrial laser scanner using neural networks,” Remote Sensing Letters, vol. 7, no. 4, pp. 299–308, 2016.
[28] Z. Li, D. L. Jupp, A. H. Strahler, C. B. Schaaf, G. Howe, K. Hewawasam, E. S. Douglas, S. Chakrabarti, T. A. Cook, I. Paynter et al., “Radio-metric calibration of a dual-wavelength, full-waveform terrestrial lidar,”
Sensors, vol. 16, no. 3, p. 313, 2016.