International Journal of Emerging Technology and Advanced Engineering
Website: www.ijetae.com (ISSN 2250-2459,ISO 9001:2008 Certified Journal, Volume 5, Issue 11, November 2015)
30
Indirect Method for Egg Weight Measurement Using Image
Processing
Alikhanov D.
1, Penchev S.
2, Georgieva Ts.
3, Moldajanov A.
4, Shynybaj
Z.
5, Daskalov P.
6 1,4,5Kazakh National Agrarian University, Department of Energy Saving and Automation , Almaty, Kazakhstan2,3,6University of Ruse “Angel Kanchev”, Department of Automatics and Mechatronics,Ruse, Bulgaria
Abstract— An algorithm for indirect egg weight volume measurement using image processing is proposed. Regression analysis is used for approximation of relationship between egg weight and egg geometric parameters – perimeter, area, major and minor axis, shape coefficients and volume. The values of volume for each egg sample collected by image processing and traditional method based on water displacement were compared using percent differences between data. The experimental results show that the most significant parameters are egg area and volume with the following approximation - polynomial with order 3 with a value of R2=0,9439 and exponential regression with R2= 0,9235.
Keywords—egg weight, image processing, regression
analysis, geometric parameters, shape coefficients.
I. INTRODUCTION
Main requirement in egg grading systems is weight eggs classification which is specified as per-egg weight ranges as shown in Table 1 [8]:
TABLE1
EGG WEIGHT RANGES
Egg Size Egg weight
1 XL-very large 73 g
2 L-large 63 g to 73 g
3 M-medium 53 g to 63 g
4 S-small under 53 g
An analysis of literature for existing grading systems have shown that there are many automatic system for egg grading which are used mainly for defect detection [3,6] and for detecting internal blood spots and eggshell dirt
[2,5]. Different methods such as optical, mechanical,
spectral have also been used for classification of eggs using different classification criterion. In [7] near infrared spectroscopy is used for detection of blood spots in eggs. A developed computer vision algorithm [4] is used for dirt egg detection and determination of defected eggs size. Black and white images are used for egg defect detection [1].
The objective of the study is to propose an algorithm for indirect measurement of egg weight using machine vision system and image analysis.
II. MATERIALS AND METHODS
The indirect method for egg volume measurement includes the following main steps: egg image acquisition using appropriate machine vision system, image analysis using appropriate image procedures for calculation of egg
geometric parameters and statistical methods for
determining the relationship between the weight of the eggs and their geometric parameters.
A. Machine Vision System
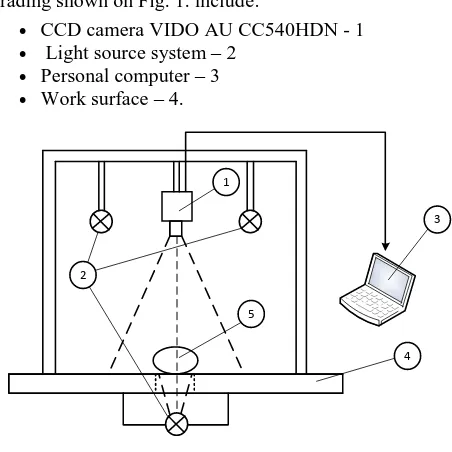
The components of machine vision system for egg grading shown on Fig. 1. include:
CCD camera VIDO AU CC540HDN - 1
Light source system – 2
Personal computer – 3
Work surface – 4.
1
2
3
[image:1.612.329.555.410.636.2]4 5
Fig. 1. Machine vision system for egg grading
The technical data of the color CCD video camera used are the following:
- Photo sensor - 1/3 "SONY Super HAD matrix with a
[image:1.612.92.245.473.551.2]International Journal of Emerging Technology and Advanced Engineering
Website: www.ijetae.com (ISSN 2250-2459,ISO 9001:2008 Certified Journal, Volume 5, Issue 11, November 2015)
31
- Resolution - 540 TVL;
- Video output - composite video with BNC connector;
- Electronic shutter - from 1/50 - 1/120000 sec;
- Spectral sensitivity - visible and infrared range (800 ÷
1200 nm).
The system provides illumination of the object in two different directions - over, to analyze the color characteristics and bottom, with the aim of radiographic object. LED lighting with white light and a color temperature of 3000K is used.
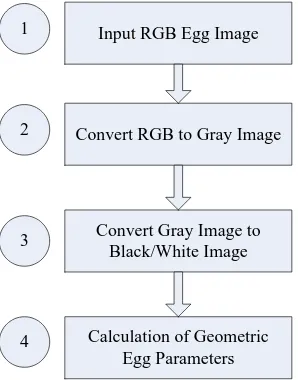
B. Image Processing Algorithm
The proposed algorithm for egg image processing includes following main steps: RGB image acquisition (1), converting RGB to Gray image (2), converting Gray to Black/White image (3) and calculation of geometric egg parameters (4). The block diagram of the proposed method is shown in Fig 2.
Input RGB Egg Image
Convert RGB to Gray Image
Convert Gray Image to Black/White Image
Calculation of Geometric Egg Parameters 1
2
3
[image:2.612.328.558.332.540.2]4
Fig. 2. Block diagram of the proposed method
One of the main procedures for working with visual system is calibration procedure. Determined numbers of pixels correspond to the diameter of the object in horizontal and vertical direction. Identifying two coefficients Kx and Ky (mm/pix), provide millimeters corresponding to one pixel in X and Y direction:
x x
P D
K ,
y y
P D
K , (1)
Where D, mm is the diameter of the standard circular object;
Px, Py - the number of pixels in the directions X and Y, corresponding to this diameter.
The coefficients KX and KY can be used to measure
distances in a visual image, when the desired result should be in millimeters. For example, the distance between point
A (XA,YA) and B (XB, YB) is obtained based on the
Euclidean distance of the equation as follows:
2Y B A 2 X B A
AB X X K Y Y K
D
,
mm. (2)For converting the images in gray and then in black/white (binary) image are used functions in MATLAB. After receiving the gray image it is converted into a binary with two types of pixels - white (object pixels) and black (background pixels). This is done by standard procedure using threshold gray image segmentation.
The calculated geometric egg parameters using images of the eggs are minor and major axis, area, perimeter and two shape coefficients.
a) b)
c) d)
Fig. 3. Main steps of image processing algorithm a) input RGB egg image, b) gray egg image, c) binary image, d)
geometric parameters calculation
The geometric egg parameters are obtained as results of
Matlab function regionprops.
Other three parameters are also calculated – two
coefficients of egg shape (K1 and K2) and egg volume.
S P K
2
1 and
B A
K2 , (3)
Where P is egg perimeter; S – egg area;
[image:2.612.95.244.347.537.2]International Journal of Emerging Technology and Advanced Engineering
Website: www.ijetae.com (ISSN 2250-2459,ISO 9001:2008 Certified Journal, Volume 5, Issue 11, November 2015)
32
The egg volume is calculated using the following equation:
AB 3 2 Vc
, cm3 (4)
Where A is the minor axis;
B – major axis.
C. Indirect Method for Weight Egg Measurement
The results are analyzed to determine the relationship between the weight of the eggs and their geometric parameters.
Tools used for this purpose is regression analysis of the eggs weight and their geometric parameters. For this approximation a set of analytical models is performed and
for each of them the coefficient of determination R2 is
calculated.
III. RESULTS AND DISCUSSION
Results for calculated geometric parameters of eggs are shown in Table 2. The second column is egg weight which
is measurement using precise electronic scale.
TABLE2
EGG WEIGHT RANGES
Egg number
Weight, g
Perimeter, cm
Area, cm2
Major axis, cm
Minor axis,
cm K1 K2
c
V , cm3
WD
V ,
cm3
Percent differences
1 54,43 15,512 18,51 5,23 4,47 13,00 0,85 48,89 45 7,96
2 52,36 15,567 18,38 5,42 4,28 13,18 0,79 48,51 46 5,18
3 48,66 15,344 17,62 5,43 4,09 13,36 0,75 46,41 45 3,05
4 43,70 14,625 15,97 5,12 3,98 13,39 0,78 42,67 40 6,26
5 43,68 15,089 16,79 5,51 3,86 13,56 0,70 44,54 41 7,95
6 49,14 15,221 17,47 5,40 4,13 13,26 0,77 46,69 45 3,62
7 47,81 15,025 17,22 5,24 4,15 13,11 0,79 45,51 46 1,07
8 62,56 17,015 21,53 6,27 4,37 13,44 0,70 57,32 60 4,67
9 57,49 16,574 20,81 5,93 4,47 13,20 0,75 55,43 56 1,04
10 63,73 16,504 20,89 5,74 4,64 13,04 0,81 55,68 56 0,57
11 45,61 14,704 16,54 5,04 4,20 13,07 0,83 44,29 42 5,17
12 61,09 16,219 20,07 5,63 4,57 13,11 0,81 53,80 53 1,49
13 50,67 15,408 17,99 5,37 4,21 13,19 0,78 47,36 48 1,35
14 60,28 16,274 20,13 5,72 4,45 13,16 0,78 53,28 50 6,16
15 53,52 15,886 18,92 5,69 4,18 13,34 0,74 49,79 47 5,61
16 42,75 14,548 15,83 5,10 3,93 13,37 0,77 41,92 44 4,95
17 56,55 15,836 19,02 5,51 4,34 13,17 0,79 50,09 47 6,19
18 58,83 15,832 19,15 5,36 4,54 13,09 0,85 50,84 49 3,61
19 37,22 14,208 14,91 5,17 3,65 13,54 0,71 39,53 39 1,35
20 55,67 15,517 18,48 4,99 4,61 13,03 0,92 48,14 50 3,86
21 55,64 15,759 18,91 5,46 4,36 13,13 0,80 49,80 50 0,40
22 52,81 15,206 17,79 5,06 4,41 13,00 0,87 46,72 48 2,73
23 50,52 14,991 17,25 5,06 4,31 13,03 0,85 45,69 47 2,87
24 52,60 15,542 18,29 5,37 4,33 13,20 0,81 48,63 46 5,40
25 54,80 15,527 18,42 5,23 4,49 13,09 0,86 49,09 51 3,90
International Journal of Emerging Technology and Advanced Engineering
Website: www.ijetae.com (ISSN 2250-2459,ISO 9001:2008 Certified Journal, Volume 5, Issue 11, November 2015)
33
Columns from third to seventh are calculated from egg images. The last column for egg volume is obtained using water displacement method for volume measurement as a reference method for assessment the accuracy of volume calculation using equation 4.
The values of volume for each egg sample collected by image processing and traditional method based on water displacement were compared. The percent difference between two data points was calculated as the ratio between the absolute value of the difference between the two values and the expected value:
,% 100 . V V V s difference Perecent C WD C
(5)
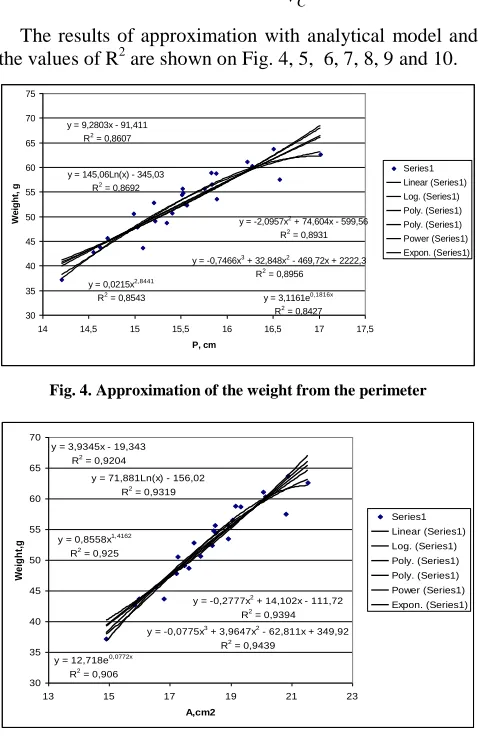
The results of approximation with analytical model and
the values of R2 are shown on Fig. 4, 5, 6, 7, 8, 9 and 10.
y = 9,2803x - 91,411 R2 = 0,8607
y = 145,06Ln(x) - 345,03 R2 = 0,8692
y = -2,0957x2 + 74,604x - 599,56 R2
= 0,8931
y = -0,7466x3 + 32,848x2
- 469,72x + 2222,3 R2
= 0,8956 y = 0,0215x2,8441
R2
= 0,8543 y = 3,1161e0,1816x R2 = 0,8427 30 35 40 45 50 55 60 65 70 75
14 14,5 15 15,5 16 16,5 17 17,5
[image:4.612.50.567.109.643.2]P, cm W e ig h t, g Series1 Linear (Series1) Log. (Series1) Poly. (Series1) Poly. (Series1) Power (Series1) Expon. (Series1)
Fig. 4. Approximation of the weight from the perimeter
y = 3,9345x - 19,343 R2
= 0,9204
y = 71,881Ln(x) - 156,02 R2 = 0,9319
y = -0,2777x2
+ 14,102x - 111,72 R2 = 0,9394 y = -0,0775x3
+ 3,9647x2
- 62,811x + 349,92 R2
= 0,9439 y = 0,8558x1,4162
R2 = 0,925
y = 12,718e0,0772x R2 = 0,906 30 35 40 45 50 55 60 65 70
13 15 17 19 21 23
A,cm2 W e ig h t, g Series1 Linear (Series1) Log. (Series1) Poly. (Series1) Poly. (Series1) Power (Series1) Expon. (Series1)
Fig. 5. Approximation of the weight from the area
y = 13,218x - 18,669 R2
= 0,3582
y = 73,004Ln(x) - 70,301 R2
= 0,3582
y = -0,9691x2 + 23,962x - 48,343 R2 = 0,3585 y = -28,394x3
+ 476,3x2
- 2641,8x + 4900 R2
= 0,3886
y = 5,0756x1,3842 R2
= 0,3293
y = 13,528e0,2504x R2 = 0,3286 30 35 40 45 50 55 60 65 70
4,50 5,00 5,50 6,00 6,50
Major axis, cm
[image:4.612.324.566.121.270.2]W e ig h t, g Series1 Linear (Series1) Log. (Series1) Poly. (Series1) Poly. (Series1) Power (Series1) Expon. (Series1)
Fig. 6. Approximation of the weight from the major axis
y = 24,461x - 52,196 R2 = 0,8254 y = 102,22Ln(x) - 95,956
R2 = 0,8247
y = -0,6351x2 + 29,79x - 63,335 R2 = 0,8255 y = -13,296x3 + 165,37x2 - 658,97x + 886,22
R2 = 0,827 y = 2,6391x2,0534
R2 = 0,8509 y = 6,3893e0,4902x
R2 = 0,8474
30 35 40 45 50 55 60 65 70
3,50 3,70 3,90 4,10 4,30 4,50 4,70
M inor axis, cm
[image:4.612.49.288.292.661.2]W e ig h t, g Series1 Linear (Series1) Log. (Series1) Poly. (Series1) Poly. (Series1) Power (Series1) Expon. (Series1)
Fig. 7. Approximation of the weight from the minor axis
y = -21,556x + 337,21 R2
= 0,2817
y = 36,774x3 - 1513,7x2
+ 20723x - 94319 R2
= 0,319 y = -285,21Ln(x) + 788,55
R2 = 0,2805
y = -49,859x2
+ 1300,8x - 8429,4 R2 = 0,3185 y = 2E+08x-5,9576
R2 = 0,313
y = -2865,9x4 + 152162x3
- 3E+06x2
+ 3E+07x - 9E+07 R2 = 0,36 30,00 35,00 40,00 45,00 50,00 55,00 60,00 65,00 70,00
12,90 13,00 13,10 13,20 13,30 13,40 13,50 13,60
K1
We
igh
t,
[image:4.612.50.288.333.470.2]g
[image:4.612.323.563.355.627.2]International Journal of Emerging Technology and Advanced Engineering
Website: www.ijetae.com (ISSN 2250-2459,ISO 9001:2008 Certified Journal, Volume 5, Issue 11, November 2015)
34
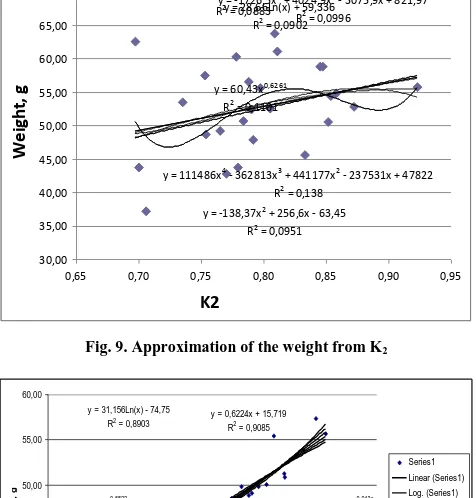
y = 35,711x + 24,304Ry = -1726,5x2 = 0,0883
3 + 4024,9x2 - 3075,9x + 821,97 R2 = 0,0996
y = 28,66Ln(x) + 59,336 R2 = 0,0902
y = -138,37x2 + 256,6x - 63,45 R2 = 0,0951 y = 60,43x0,6261
R2 = 0,1101
y = 111486x4 - 362813x3 + 441177x2 - 237531x + 47822 R2 = 0,138
30,00 35,00 40,00 45,00 50,00 55,00 60,00 65,00 70,00
0,65 0,70 0,75 0,80 0,85 0,90 0,95
K2
We
igh
t,
[image:5.612.50.288.144.393.2]g
Fig. 9. Approximation of the weight from K2
y = 0,6224x + 15,719 R2 = 0,9085 y = 31,156Ln(x) - 74,75
R2 = 0,8903
y = 0,0006x3 - 0,0844x2 + 4,4645x - 40,829 R2 = 0,9196 y = 0,0075x2 - 0,1489x + 35,226
R2 = 0,9165 y = 3,66x0,6522
R2 = 0,9128
y = 24,395e0,013x R2 = 0,9235
35,00 40,00 45,00 50,00 55,00 60,00
30 35 40 45 50 55 60 65 70
Vc, cm3
W
e
igh
t,
g
Series1 Linear (Series1) Log. (Series1) Poly. (Series1) Poly. (Series1) Power (Series1) Expon. (Series1)
Fig. 10. Approximation of the weight from the volume
The results in Fig. 4 show that for the approximation of the dependence of weight on the perimeter, the good score
were obtained by a polynomial of 4th order with a value of
R2 = 0,8965. The results in Fig. 5 show that for the
approximation of the dependence of weight on the area, the good score were obtained by a polynomial with order 3
with a value of R2 = 0,9439. The results in Fig. 6 show that
the highest value of R2 = 0,3886 were achieved using
polynomial with order 3. The relationship between the weight of the eggs and their minor axis is approximated
with regression of type Power (Fig. 7) with value of R2 =
0,8509. The values of R2 for shape coefficients K1 and K2
(Fig. 8 and Fig. 9) are insignificant and do not show relationship between them and egg weight.
The relationship between egg weight and volume (Fig.
10) is approximated using exponential regression with R2 =
0,9235.
The percent differences between data for egg volume calculated from digital egg image and the values obtained using water displacement method are less than 10%. This result shows that image analysis is appropriate for calculation of egg volume with values near to the reference.
IV. CONCLUSION
An algorithm and procedure for indirect measurement of egg weight using egg digital images are developed and tested. The relationship between the egg weight and geometric parameters are approximated using regression analysis and coefficient of determination. The results show
that perimeter, major and minor axes, shape coefficients K1
and K2 are insignificant for indirect measurement of egg
weight using image analysis. Most significant parameters are area and egg volume with the following approximation
- polynomial with order 3 with a value of R2 = 0,9439 and
exponential regression with R2 = 0,9235.
REFERENCES
[1] Agh khani, M. H. and A. Pourreza 2005 Egg Sorting by Machine Vision Method. Research Note.Journal of Agricultural Engineering Research. Vol. 8, No. 3.
[2] Dehrouyeh, M.H., M. Omid, H. Ahmadi, et al. 2010 Grading and quality inspection of defected eggs using machine vision International Journal of Advanced Science and Technology, pp. 23– 30
[3] Garcia-Alegre, M.C., Ribeiro, A., Guinea, D., Cristobal, G. 1998 Eggshell defects detection based on color processing. International Workshop on Robotics and Automated Machinery for Bio-Productions, Spain, pp. 51–66.
[4] Mertens, K., B. De Ketelaere, B. Kamers, F. R. Bamelis, B. J. Kemps, E. M. Verhoelst, J. G. De Baerdemaeker and E. M. Decuypere 2005 Dirt Detection on Brown Eggs by Means of Color Copmuter Vision. Poultry Science Association Inc. 84: 1653-1659. [5] Nakano, K., K. Sasaoka, Y. Ohtsuka. 1998 A study on
non-destructive detection of abnormal eggs by using image processing, The Journal of the Society of Agricultural Structures, 29, pp. 17–23 [6] Patel, V.C., R.W. Mc Clendon, W. Goodrum 1998 Color computer
vision and artificial neural networks for the detection of defects in poultry eggs., Artificial Intelligence Review, 12, pp. 163–176 [7] Usui, Y., K. Nakano and Y. Motonaga 2003 A Study on the
Development of Non-Destructive Detection System for Abnormal Eggs. EFITA Conference. Debrecen. Hungary.