Changes in Perspectives of the
Values and Benefits of Nature
Damian John Smith
School of Environment and Life Sciences
University of Salford
Salford
United Kingdom
ii
Contents
List of Figures ... vi
List of Tables ... xii
Acknowledgements ... xv
Abstract ... xvi
1. Introduction ...1
1.1 Research Context 1 1.2 Thesis Structure 5 2. Literature Review ...9
2.1 Introduction to Literature Review 9 2.2 Humans in Nature 9 2.3 Social-ecological Systems Analysis 13 2.4 The Ecosystem Approach 16 2.5 Ecosystem Services 18 2.5.1 The History and Modern Relevance of Ecosystem Services ... 18
2.5.2 Ecosystem Service Definition ... 21
2.5.3 The Millennium Ecosystem Assessment ... 23
2.5.4 The United Kingdom National Ecosystem Assessment ... 27
2.5.5 Relationship between Ecosystem Processes and Human Well-being 30 2.5.6 Ecosystem Services and Biodiversity ... 33
2.5.7 Cultural Ecosystem Services in Urban Areas ... 35
iii
3. Methodology ... 41
3.1 Introduction to the Chapter 41 3.2 Research Paradigm and Theoretical Approach 41 3.3 Research Area 44 3.4 Description of the Research Site 47 3.5 Case study methods overview 49 4. Identifying Optimal Management Decisions and Contextual Ecosystem Services ... 51
4.1 Introduction to the Chapter 51 4.2 Salt marsh management options 51 4.2.1 Method ... 51
4.2.2 Result ... 53
4.3 Local expert forum and rapid assessment 57 4.3.1 Local expert opinion method ... 57
4.3.2 Rapid assessment method ... 59
4.3.3 Local expert forum ... 60
4.3.4 Rapid assessment results ... 61
4.4 Aspects of Grazing Management 63 4.4.1 Method ... 63
4.4.2 Results ... 63
4.5 Ecosystem Services 70 4.6 Conclusion to the Chapter 72 5. Ecosystem Service 1 - Wild Species Diversity ... 74
5.1 Introduction to the Chapter 74
iv
5.2.1 Method ... 75
5.2.2 Results ... 78
5.3 Vegetation 83 5.3.1 Method ... 83
5.3.2 Results ... 89
5.4 Invertebrates 98 5.4.1 Method ... 98
5.4.2 Results ... 103
5.5 Discussion 106 6. Ecosystem Service 2 - Environmental Settings ... 111
6.1 Introduction to the Chapter 111 6.2 Method 111
6.2.1 Unobtrusive Participant Observation ... 112
6.2.2 Informal interviews, Content and Thematic Analysis ... 121
6.3 Results 128
6.3.1 Visitors who Stopped to Look ... 128
6.3.2 Content and Thematic Analysis of Comments ... 129
6.4 Discussion 150 7. Ecosystem Service 3 - Carbon storage - Sediment... 156
7.1 Introduction to the Chapter 156 7.2 Method 157
7.2.1 Field collection ... 157
7.2.2 Bulk Density ... 160
7.2.3 Loss on Ignition ... 161
v
7.2.5 Avoided costs ... 162
7.3 Results 163
7.3.1 Bulk density results in cm3 ... 163
7.3.2 Loss on ignition ... 164
7.3.3 Tonnes per hectare to 15 cm ... 165
7.3.4 Avoided costs ... 165
7.4 Discussion 166 8. Ecosystem Service 4 - Immobilisation of Pollutants ... 168
8.1 Introduction to the Chapter 168 8.2 Method 170
8.2.1 Field collection ... 170
8.2.2 Laboratory processing of samples: ... 171
8.2.3 Descriptive and Statistical analysis... 173
8.3 Results 174
8.4 Discussion 179 9. Summary ... 182
9.1 Introduction to the Chapter 182 9.2 Operationalizing the Ecosystem Approach – lessons learnt from this study 183 9.3 Integrating environment decisions and ecosystem services using a cyclical framework 188 9.4 Impact of the research 191 9.5 Future Research 194 Appendices ... 196
vi
List of Figures
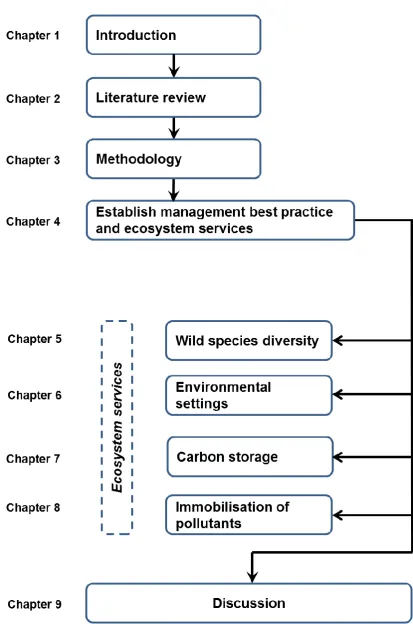
Figure 1: Conceptual overview of thesis. An iterative process is shown between
chapters 4 to 9. ... 8
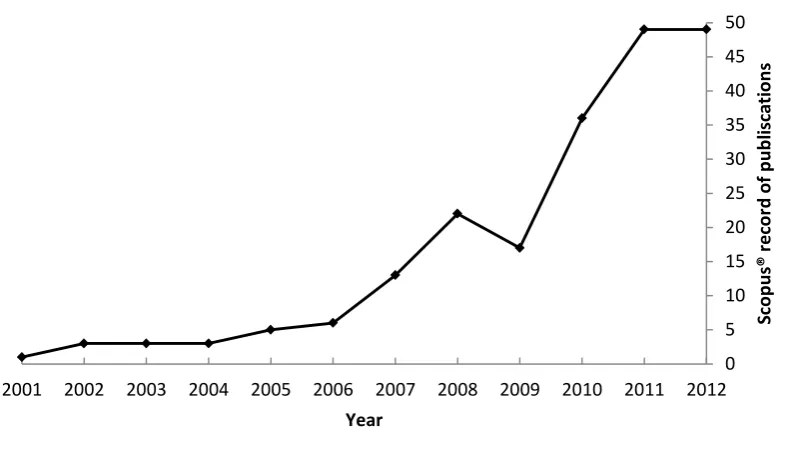
Figure 2: Number of publications with ‘Anthropocene’ in the ‘Title, abstract or
keywords’. The results show the use of the concept in academic thinking, discourse,
and publication. Scopus® search engine. Search carried out 03/01/2013 (Elsevier,
2013). ... 12
Figure 3: Representation of a social-ecological system. Adapted from Berkes and
Folke (1998) and Folke et al. (2005) ... 16
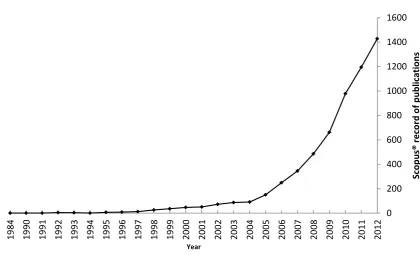
Figure 4: Number of publications with ‘ecosystem services’ in the ‘Title, abstract or keywords’. The results show the impact of the concept on academic publication and
research. Scopus® search engine. Search carried out 03/01/2013 (Elsevier, 2013). 21
Figure 5: The relationship between ecosystem services and freedom of choice and
action for human beings. Ecosystem services are divided into four categories which
supply four constituents of well-being and finally, the freedom of choice and action
for humans. Thickness and colours of lines between the ecosystem services and
constituents of well-being represents the amplitude of the effect; thicker, blue lines
have more of an impact than green, medium width, with the least effect designated
by the thinnest, red lines. Adapted from the Millennium Ecosystem Assessment (MA,
2005b). ... 26
Figure 6: Conceptual image of the UK-NEA, showing the relationship between
elements of ecosystems: ecosystem services and how these produce goods, adding
to and effecting human well-being, which in turn influences drivers of change through
social feedbacks and institutional interventions (adapted from the UK-NEA, 2011a).
... 29
Figure 7: The pathway between abiotic and biotic interactions in ecosystem
processes to human recipients of goods. ... 33
Figure 8: Integrating the ecosystem service framework into environmental
vii Figure 9: The Upper Mersey Estuary within black line boundary. Showing the
location within the urban towns of Warrington, Runcorn, and Widnes. ... 46
Figure 10: Research area including Widnes Warth salt marsh. The local urban areas
of West Bank, Widnes Central and Halton View are within 1 km of the research area.
Inset shows location within the United Kingdom. ... 47
Figure 11: Methods used in the case study. ... 50
Figure 12: Managing salt marsh for conservation interest using grazing. 0 = little or
no conservation interest; 1 = limited conservation interest; 2 = medium and 3 high
biodiversity. Adapted from Doody (2008). ... 69
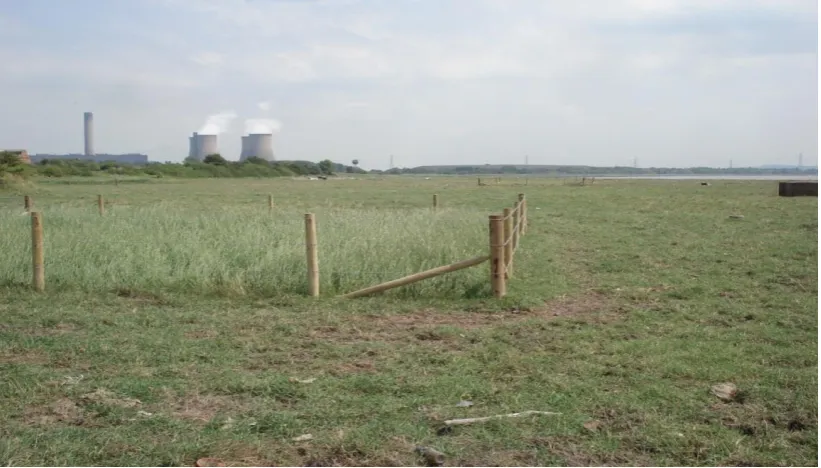
Figure 13: An English Longhorn cattle on the research site with the Jubilee Bridge,
Runcorn in the background. ... 73
Figure 14: Bird survey transect. The green, hashed line indicates the route of the
transect. The surveys took place through scan sampling from the scan point and
while walking along the path between points 1 and 2. The red line indicates the
boundary between the grazed and the ungrazed area. ... 78
Figure 15: Breeding song birds data 2011. ... 81
Figure 16: Breeding song birds data 2012. ... 81
Figure 17: Results of bird surveys. Breeding pairs of waders shown as red star for
Lapwing (Vanellus vanellus) and blue star for Redshank (Tringa totanus). The green
line represents the transect route for the surveys. ... 82
Figure 18: Placement of exclosures and paired quadrats. Open squares represent
exclosures, red dots represent paired quadrats. Exclosures measure 10m × 10m and
permanent quadrats 2m × 2m. Blue, oval circles represent each site. ... 84
Figure 19: An exclosure at the sampling site, with a full exclosure shown in the
background (August 2011). ... 84
Figure 20: Showing the arrangement of design of the exclosures and quadrats.
Exclosures were 10 m × 10 m, quadrats both within and without the exclosurse were
viii Figure 21: The constituent parts of the boxplots (ref. Minitab ® 15.1.0.0 ©2006). 1- Outliers – datum points beyond upper or lower whiskers. 2- Upper whisker extending to maximum datum point to within 1.5 box heights from top of box. 3 – Interquartile range box, bounded at the bottom by the 1st quartile, 25% of data are ≤ this point;
the top line represents the 3rd quartile, 75% of the data are ≤ this value; the middle
line represents the 2nd quartile (the median), 50% of the data are ≤ this point. 4 – The
lower whisker extends to the minimum datum point within 1.5 box heights from the
1st quartile. ... 87
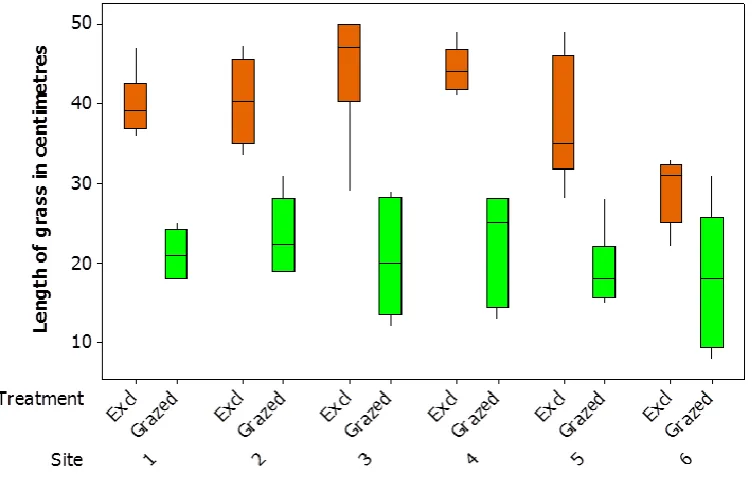
Figure 22: Boxplots of April 2011, two weeks after the introduction of the high density
grazing. Orange boxes represent the ungrazed, green represent the grazed areas. 90
Figure 23: Boxplots of May 2011, during the second month after the introduction of
high density grazing. Orange boxes represent the ungrazed, green represent the
grazed areas. ... 91
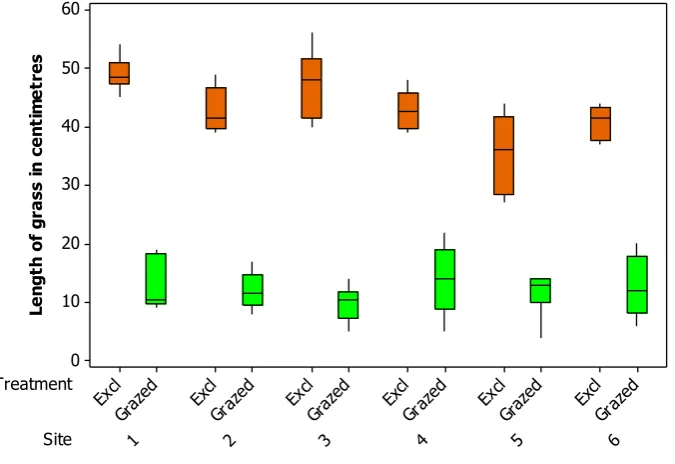
Figure 24: Boxplots of June 2011, after three months of high density grazing. Orange
boxes represent the ungrazed, green represent the grazed areas. The grazed areas
show a low median (<10 cm) with a narrow inter-quartile range. ... 92
Figure 25: Boxplots of July 2011, after four months of high density grazing. Orange
boxes represent the ungrazed, green represent the grazed areas. The grazed areas
show a low median (<10 cm) with a narrow inter-quartile range. ... 93
Figure 26: Boxplots of April 2012 at the start of the breeding season for birds. There
was a certain amount of overlap between the treatments as shown in sites 4,5, and
6. Orange boxes represent the ungrazed, green represent the grazed areas. This
was one month prior to low density grazing of 2012... 94
Figure 27: Boxplots of May 2012. Orange boxes represent the ungrazed, green
represent the grazed areas. The boxplots indicate the range in the exclosures was
narrower than the grazed area which could be attributed to the steady increase
during spring growth. ... 95
Figure 28: Boxplots of June 2012, two weeks after the introduction of the cattle for
the second year with a conservation grazing density (0.6 cattle ha-1). Orange boxes
represent the ungrazed, green represent the grazed areas. The ranges of the grazed
ix Figure 29: Boxplots of grass height data for July 2012. Orange boxes represent the
ungrazed, green represent the grazed areas. The inter-quartile ranges of the grazed
areas varied visually to a higher extent than the ungrazed areas. ... 97
Figure 30: Pitfall trap showing cup, mesh, and long nails to prop up the tiles. The
mesh measures 12 mm × 25 mm. ... 99
Figure 31: A covered pitfall trap, the grass was replaced so that the trap and area
was restored to its original state. ... 99
Figure 32: Map displaying the layout of the locations of the pitfall traps. Location of
the traps was selected using random methods. The red line indicates the boundary
between the grazed and the ungrazed area. ... 100
Figure 33: Non-metric, multi-dimensional Scaling (MDS) ordination, representing a
visualisation of the differences between the community assemblage of the
invertebrates between the grazed and the ungrazed area. Red squares represents
grazed and blue circles represent the ungrazed pitfall traps. The layout of the
quadrats in relation to one another clearly shows the similarities within treatments
and differences between them as the ungrazed (blue) pitfall traps and the grazed
(red) pitfall traps are generally clustered together. ... 104
Figure 34: Mean abundance (+/-standard deviation) of orders of invertebrate species
in pitfall traps, and standard deviation around the mean, for orders contributing to the
difference between the grazed and ungrazed sections of salt marsh. Blue columns
represent ungrazed traps and red represent grazed. ... 106
Figure 35: Visitor surveys, 1- Main viewing area, 2 – Eastern Information board, 3 –
Phragmites board, 4 – towards Fiddlers Ferry, 5 – towards Spike Island, 6 – Tan
House Lane. The Trans Pennine Trail travels through points 4 and 5. Grazing area
indicated by red line, raised refuge area indicated by light green speckled area at
point 1. ... 114
Figure 36: View of the main viewing area. This view in a south-easterly direction from Point 1 of Figure 35……….………..115
x Figure 38: View towards Fiddlers Ferry approach from the main viewing area.
Grazing area to the right………118
Figure 39: View towards Spike Island approach from the main viewing are….…...118
Figure 40: View towards the Tan House Lane approach from the main viewing
area………...………119
Figure 41: Frequency of appearance of words in informal interviews. The word ‘cattle’ has been removed for clarity. The frequency of ‘cattle n = 101. Red line
indicates the cut-off for words included in the wordle image. ... 125
Figure 42: Tag cloud showing the prominence of words taken from comments during the grazing period, n= 33. Content cloud produced using Wordle™. Content cloud excludes ‘cattle’ (n= 101) as this would have obscured the other words…………..130
Figure 43: Position of extraction locations for carbon storage samples. Squares
represent 10 m × 10 m exclosures, dots represent extant quadrats used in
vegetation surveys. Two samples were extracted within each exclosure. The red line indicates the edge of the grazing area………159
Figure 44: Mean bulk density of sediment in cubic centimetres (+/- s.d) between the grazing area permanent quadrats and the exclosure quadrats………..164
Figure 45: Mean percentage (+/- s.d) loss on ignition as a percentage between the
grazing area permanent quadrats and the exclosure quadrats. ... 164
Figure 46: Mean tonnes of carbon stock per hectare to 15 cm depth between the
grazing area permanent quadrats and the exclosure quadrats. Error bars indicate
standard deviation around the mean. ... 165
Figure 47: Avoided costs in pounds sterling of carbon dioxide emissions for the
grazed and ungrazed treatments. ... 166
Figure 48: Widnes Warth photograph, circa 1880’s showing the factories and
atmospheric effects of the chemical factories. The area to the right of the image is
the northern bank of the Mersey River. The picture is taken in a north-westerly
direction from Spike Island across the northern edge of the river. Copyright Halton
xi Figure 49: Image of grazing area showing location of sampling for the surface
samples in red asterisks. The red outline represents the border of the grazing area.
The light green speckled section in the west of the grazing area is the raised
area………...171
Figure 50: Boxplot showing lead recorded prior to and at the end of the first year of grazing. Asterisks refer to outliers in the data set. N = 25 for each series………....174
Figure 51: Boxplot showing lead recorded prior to the implementation of the grazing
management and at the end of the second year of grazing. Asterisks refer to outliers
in the data set. N = 25 for each series. ... 175
Figure 53: Boxplot showing arsenic recorded prior to, and at the end of the first year
of grazing, with outliers removed. N = 24 for each series. ... 177
Figure 54: Boxplot showing arsenic recorded prior to the grazing management and at
the end of the second year of grazing. Asterisks refer to outliers in the data set. N = 25 for each series……….. 178
Figure 55: Boxplot showing arsenic recorded prior to, and at the end of the second
year of grazing, with outliers removed. N = 24 for each series. ... 179
xii
List of Tables
Table 1: The United Kingdom National Ecosystem Assessment view of the
relationship between ecosystem processes, intermediate and final ecosystem services, and goods. Note the departure from the ‘all in one’ approach of the
Millennium Ecosystem Assessment shown in Figure 2. Examples of goods are by no
means exhaustive as more goods become evident through practical applications.
This figure adapted from the (UK-NEA, 2011c) ... 31
Table 2: Three main research paradigms (Grix, 2004) ... 42
Table 3 Differences between inductive and deductive approaches to research
(Pathirage et al., 2008). ... 43
Table 4: Search terms used in literature review for salt marsh best practice. .. 52
Table 5: Benefits and challenges presented by grazing cattle on salt marsh
(Chatters, 2004). ... 56
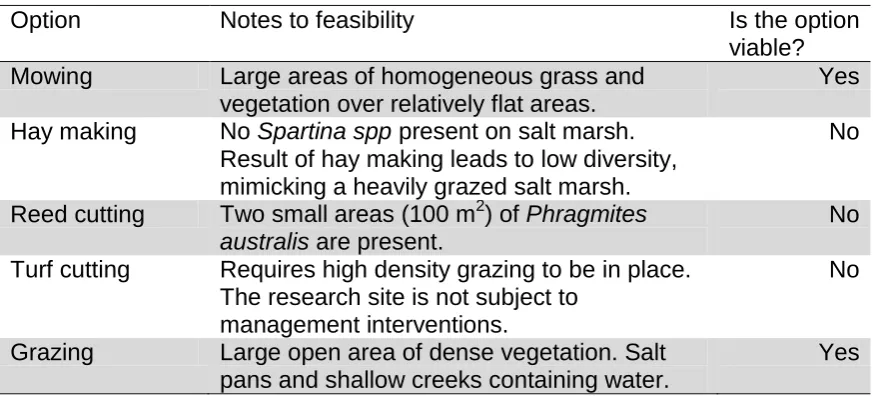
Table 6: Results of options feasibility walk over exercise performed in September
2010. ... 57
Table 7: Local experts’ forum attendees, listing relevant area of expertise, and how
the attendees met the eligibility criteria. ... 58
Table 8: Results of the Local experts’ opinion workshop... 61
Table 9: Number of arrows for Local Experts Forum. ... 61
Table 10: A rapid assessment showing effects of either conservation grazing or
mowing on selected salt marsh ecosystem services. ... 62
Table 11: Number of arrows per management option for rapid assessment. ... 63
Table 12: Breeding pairs of song birds recorded on grazed and ungrazed areas
during 2011 and 2012. ... 80
Table 13: Months of vegetation heights monitoring. ... 86
Table 14: Kolmogorov Smirnov results to test for normality of grass height data over
the two 4 month grazing periods in 2011 and 2012. P values in bold indicate a
xiii Table 15: Results of the Scheirer-Ray-Hare test for April 2011. Significant
differences indicated by * (P< 0.05), ** (P < 0.01), *** (P< 0.001). Where the
difference was not significant, this is shown as ns. ... 90
Table 16: Results of the Scheirer-Ray-Hare test for May 2011. Significant differences
indicated by * (P< 0.05), ** (P < 0.01), *** (P< 0.001). Where the difference was not
significant, this is shown as ns. ... 91
Table 17: Results of the Scheirer-Ray-Hare test for June 2011. Significant
differences indicated by * (P< 0.05), ** (P < 0.01), *** (P< 0.001). Where the
difference was not significant, this is shown as ns. ... 92
Table 18: Scheirer-Ray-Hare test results for July 2011, the last month of grazing
before the cattle were removed for 2011. Significant differences indicated by * (P<
0.05), ** (P < 0.01), *** (P< 0.001). Where the difference was not significant, this is
shown as ns. ... 93
Table 19: Scheirer-Ray-Hare test results for April 2012, the first month recorded and
the start of the breeding season for waders. Significant differences indicated by * (P<
0.05), ** (P < 0.01), *** (P< 0.001). Where the difference was not significant, this is
shown as ns. ... 94
Table 20: Scheirer-Ray-Hare test results for May 2012. Significant differences
indicated by * (P< 0.05), ** (P < 0.01), *** (P< 0.001). Where the difference was not
significant, this is shown as ns). ... 95
Table 21: Results of the Scheirer-Ray-Hare test for June 2012. Significant
differences indicated by * (P< 0.05), ** (P < 0.01), *** (P< 0.001). Where the
difference was not significant, this is shown as ns. ... 96
Table 22: Scheirer-Ray-Hare results for July 2012, the second month of the second
year. Significant differences indicated by * (P< 0.05), ** (P < 0.01), *** (P< 0.001).
Where the difference was not significant, this is shown as ns. ... 97
Table 23: Invertebrates recorded in the ungrazed section of the salt marsh. . 103
Table 24: Invertebrates recorded in grazed section of the salt marsh. ... 103
Table 25: Orders contributing to the dissimilarity between the treatments, with mean
xiv Table 26: Times of surveys during weekdays and weekends. ... 116
Table 27: Months and hours surveyed for the unobtrusive observation surveys during
2011. ... 117
Table 28: Pronouns replaced from informal interview ... 124
Table 29: Precipitation data for the summer period (to include September) for North
Western England and Wales, supplied by the Met Office Hadley Centre, shown in
millimetres. (Crown, 2013b). ... 126
Table 30: Summary of total visitor activity at the main viewing area over 70.5 hours
for the grazing period of 2011. Showing number of visitors, number who stopped to
look, the percentage of the total visitors by category, and the percentage of each
category that stopped to look. ... 128
Table 31: Origin of users and associated stop and look behaviour. ... 129
Table 32: Percentage of interest shown during the survey period. During the month
prior to the grazing introduction, months 1-4, and the month post grazing, when the
cattle had been removed for the winter months. ... 129
Table 33: Ecosystem goods and their occurrence derived from the 104 comments
transcribed during the informal interview process. ... 136
Table 34: Comments recorded and the ecosystem goods derived from each. The
justification for the derivation or how the ecosystem good was assigned is illustrated
in the comments where the text is in bold format or a justification is written in italics
after the comment. ... 137
Table 35: Results of statistical tests to examine departure from normal distribution for
measurements of lead and arsenic across the grazing area. ... 173
Table 36: Summary of recommendations for future research as per individual
xv
Acknowledgements
Sincerest and deepest gratitude to Philip James and Paul Oldfield for their unstinting
guidance, faith, and support throughout this research project.
Of course, a multitude of academic staff, support staff, and researchers have played
a large role in assisting me. These include Simon Hutchinson and Laurie Cunliffe for
all areas of sedimentary work and analysis. Paul Ramage and Dan Alexander for
extensive help with fieldwork; Gerard Brett for final proof reading.
Bob Hein of Sailing Yacht Jersey Lily, Jomtien, Thailand, for adding oxygen to the
spark.
Enthusiastic encouragement has been unlimited from my fellow researchers in Peel
335, including and especially Cocker Ochieng for late night inspirational
conversations, thank you.
Rallying around me at every point throughout this adventure, I offer my gratitude and
thanks to my mum and dad, my sisters Claire, Bernadette, and Lucy, my brother
Jeremy; brothers-in-law Andy, Ray, and Craig, favourite nieces Emily, Sarah and
xvi
Abstract
Social-ecological systems describe interactions between humans and nature.
The ecosystem approach provides a holistic system to manage and understand
these interactions, and to maintain and enhance ecosystem services - the benefits
nature provides to humans. While much theoretical discourse posits various
approaches to the ecosystem approach and ecosystem services, there exists a lack
of practical applications examining these approaches, especially in urban and
peri-urban environments.
The current research used a case study to examine the efficacy of integrating
environmental management and ecosystem services within an urban greenspace
social-ecological system. Initially, the most pertinent ecosystem services and
management options were established. This was achieved through expert opinion, a
rapid assessment, and a literature search which enabled the identification of a
preferred management approach. This resulted in conservation grazing cattle over a
5 hectare salt marsh, typical of the Upper Mersey Estuary in the UK and situated
within an urban area. The effects of cattle grazing on four relevant ecosystem
services: (i) wild species diversity, (ii) environmental settings, (iii) carbon storage,
and (iv) immobilisation of pollutants, were evaluated over two years. The aim of the
evaluation was to examine how the grazing intervention affected ecosystem
services. Both quantitative and qualitative measures - reflecting the interdisciplinarity
of the ecosystem services concept - were used in the evaluation.
For the ecosystem services examined, the results add significant knowledge to
the current discourse, and are used to inform new avenues for research. There was
an increase in the cultural services (wild species diversity and environmental
settings), regulatory services of carbon storage showed no change while differences
in the immobilisation of pollutants observed were explained by local variation at the
site. These findings show that by integrating ecosystem services and environmental
management, larger scale benefits to humans from management options can be
recognised and planned for in future natural spaces management, thereby
1
1.
Introduction
1.1 Research Context
The expansion and influence of the human population on the Earth’s ecological capacity is rapidly reducing the Earth’s ability to deliver fundamental
natural benefits (Kremen and Ostfeld, 2005). To address the growing
requirements for food, timber, fuel, and fresh water, the last 50 year period has
experienced more alteration of natural landscapes than any other time in
comparable history (MA, 2005b). While the economic status and well-being of
humans has increased, ecosystems have been subject to abrupt,
non-reversible, and non-linear changes - these changes are unsustainable (MA,
2005b). Since the beginning of the industrial revolution, the concentration of
carbon dioxide in the atmosphere has increased by 30% and species extinction
rates have increased by a factor of between 100 to 1000 times (Vitousek et al., 1997; MA, 2005b). In the United Kingdom, the most recent report, ‘The State of Nature’, found 60% of wild species to be in decline (RSPB, 2013).
Anthropogenic manipulation of the natural environment is cascading into an
unparalleled degradation of freshwater, marine, and terrestrial ecosystems (Holt
and Hattam, 2009). Ecosystem services, the benefits nature provides to
humans, are in decline due to mismanagement and are undervalued,
under-recognised, and undermanaged (Daily et al., 2009).
Humans have always understood the value and benefits provided by
nature. These benefits have been increasingly managed by humans since the
development of husbandry and agriculture circa 10 000 years ago (Fisher et al.,
2009). Plato, writing in the fourth century BCE, provided one of the first literary
references to nature providing benefits to humans through his description of soil
erosion being caused by deforestation (Daily et al., 2009; Gómez-Baggethun et al., 2010). The term ‘ecosystem services’ as a description of the benefits
provided by nature was introduced in 1981(Liu et al., 2007; Gómez-Baggethun
et al., 2010). This term, ecosystem services, was derived from literature and concepts linking nature’s benefits to humans and the interaction between the
2 Increasingly, environmental management is moving away from a
reductionist view to a holistic ecosystem approach, in which ecosystem services
are maximised and managed to enhance all the components of ecosystems.
The ecosystem approach was codified by the United Nations Environment
Program as a holistic method of environmental management (CBD, 2000). A
central idea in the ecosystem approach is that humans rely upon, and bring
about changes, in ecosystems (Holt and Hattam, 2009). The ecosystem
approach recognises the importance of the benefits that nature provides to
humans; these benefits have become defined as ecosystem services (de Groot
et al., 2002).
As the global population increases, so does the demand for natural
resources (MA, 2005e). One of the primary threats to human well-being is the
spread of urbanisation into agricultural and rural landscapes (Pickett et al.,
1997). In 2009 the global population living in urban areas crossed the 50% level
for the first time (UN, 2011). In Europe, this had already been crossed by 1950
and in 2011 the percentage of people living in urban areas was 72% (UN,
2011); in the United Kingdom (UK), at the same date, it was 80% (UK-NEA,
2011a; RSPB, 2013). The trend towards urbanisation continues to increase and
it is estimated that by 2030 more than 60% of the global population will live in
urban environments (Alberti, 2005; Eigenbrod et al., 2011). Urban growth
increasingly affects wider ecological systems, although the urban area may be small in terms of area, the ‘footprint’ required to sustain populations within such
areas is growing (Alberti, 2005). The area of this ecological footprint can be up
to two orders of magnitude greater than the urban area itself (Gaston et al.,
2013). Compared with other ecosystems such as coastal, grassland, and
cultivated systems, urban ecosystems are ecosystem service sinks; they
consume more natural resources than they produce (MA, 2005a).
The Millennium Ecosystem Assessment (MA) undertook a census of the world’s ecosystem services. Published in 2005, under the auspices of the
United Nations Environment Programme, the MA reported the current use of
60% of ecosystem services to be unsustainable (MA, 2005b; Haines-Young and
3 sequestration) seven of these were in decline; and of the three cultural services,
related to the intrinsic enjoyment of nature, two were in decline (MA, 2005b).
The importance of these cultural services was found to be under acknowledged
for local communities, including the importance of urban greenspace (MA,
2005b).
The United Kingdom National Ecosystem Assessment (UK-NEA) was
published in 2011 as an inventory of ecosystem services in the UK (UK-NEA,
2011b). In compiling this report, it was found that 30% of the total ecosystem
services over eight broad habitats were deteriorating to some degree, with 35%
of broad habitats classified as being of high importance having a declining
output of ecosystem services (UK-NEA, 2011b).
Urban greenspace plays a crucial role in the delivery of ecosystem
services, especially intrinsic services related to mental well-being (Barbosa et
al., 2007). Access to good quality greenspace in urban centres is necessary for residents’ physical activities, positive mental well-being, and healthy childhood
development (UK-NEA, 2011a). There are proven physical and mental health
benefits as a result of contact with nature (RSPB, 2013). Aesthetically pleasing
landscapes, which add to the well-being of humans (Barton and Pretty, 2010),
have decreased in their quality and quantity since 1945 (MA, 2005e). Despite
the fact that humans are an important and integral part of urban ecosystems
and environments, there remains much scope for investigating this integration
wherein humans interact with nature (Mace et al., 2012). The knowledge base
of ecosystem services in urban areas is one of the least developed (Niemelä et
al., 2010). In developing this knowledge base further, interdisciplinary research
and developing a link between science and policymaking is required (Alberti et
al., 2003).
Habitats and natural areas that provide ecosystem services should be
managed carefully so that the ecosystem services provided by them are
maintained for both present and future use (Egoh et al., 2008). There have
been calls to include ecosystem services as a crucial aspect of managing the
environment (Egoh et al., 2007; Crown, 2012). While a large tranche of
4 ecosystem services using a coherent and integrated approach at a practical
level (Daily et al., 2009; de Groot, et al., 2010). Pilot and case studies have
been recommended in order to address these research gaps (Daily et al.,
2009).
In order to the address knowledge gaps related to the management of
ecosystems and ecosystem services, the research reported here was carried
out using interdisciplinary research of inductive (common in social sciences)
and deductive (common in natural sciences) methodology (Grix, 2004;
Pathirage et al., 2008) using a case study in the north-west of England, UK. The
research takes an ecosystem approach, wherein all aspects of the ecosystem
are included from traditional conservation, to recognising humans as being part
of a healthy and sustainable ecosystem (CBD, 2000).
This thesis encompasses a programme of case study research
undertaken between April 2010 and February 2013. The research had a main over-arching aim – to critically examine the efficacy of integrating environmental
decision making into the ecosystem approach and ecosystem services in an
urban greenspace. The case study falls within the context of developing a
deliverable mitigation scheme for the construction of a tolled crossing, The
Mersey Gateway Bridge, over the Upper Mersey Estuary in the north-west of
England, UK. The estuary is situated within the unitary authorities of Warrington
and Halton and is classified as urban by the UK-NEA (UK-NEA, 2011a). In
2009, when planning consent for construction of the bridge was granted, the UK Government’s Planning Policy Statement 9 required that measures be taken to
increase or maintain biodiversity which may be affected by the bridge
construction (Crown, 2005). Measures are sought to bring underutilised areas
within the Upper Mersey Estuary under management to mitigate for
environmental damage as a result of the bridge construction. The case study
and the development of the associated biodiversity management plan have
presented an opportunity to investigate the efficacy of a practical application of
the ecosystem approach and ecosystem services on an unmanaged
greenspace in an urban area. The biodiversity management plan will be
5 Environmental Trust to transform the landscape scale ecology of the Upper
Mersey Estuary.
1.2 Thesis Structure
A framework for the current research is displayed in Figure 1. In Chapter 2
a critical examination of the extant knowledge and literature regarding
social-ecological systems, the ecosystem approach, and ecosystem services is
reported. The evolving nature of the relationship between humans and nature is
examined with regard to the Anthropocene, the name of the current epoch
(Crutzen, 2002). Social-ecological systems thinking, how humans and nature
co-evolve and influence each other (Folke et al., 2005; Haines-Young and
Potschin, 2010) is presented as a perceptive shift, a change in the common
view, which facilitates the ecosystem approach. Following this, the history and
rationale behind the ecosystem services approach and iterations of seminal
literature and reports are presented.The literature review exposes research
gaps within the theory of ecosystem services and translating this into current
requirements for managing ecosystem services. A cyclical framework for the
integration of ecosystem services and environmental decision making (Daily et
al., 2009) is presented. At the end of the literature review, the aim and
objectives of the current research, identified through research gaps in the
literature review, are presented.
Chapter 3 consists of a description of the methodological approach behind
the interdisciplinary research to address the aims and objectives identified from
the literature review. Additionally, the research detailed in Chapter 3 explains the selection of the research site and provides a description of the site – a salt
marsh within an urban conurbation– providing an ideal model in which the aims
and objectives drawn from the literature review are addressed.
In Chapter 4 the optimal management intervention for the salt marsh was
determined using triangulation of knowledge through a literature review, local
expert opinion and an assessment of extant knowledge on ecosystem services.
Two options to manage the salt marsh were considered, grazing or mowing.
6 management option. Following the result of the three methods, that grazing was
the best option, methods pertaining to salt marsh management and grazing are
critically examined and described.
Four ecosystem services were identified as being of high importance and
ideal examples within the case study: wild species diversity, environmental
settings, carbon storage, and the immobilisation of pollutants. The description of
the effect of the management on these four ecosystem services is set out in
chapters: 5, 6, 7 and 8 respectively. These four chapters, which contain
descriptions of the effects of the management on ecosystem services, use both
deductive and inductive methods to examine the data collected.
In Chapter 5 the effects of grazing on breeding bird occurrence, the
vegetation structure, and invertebrate assemblage between grazing and the
ungrazed treatments are described. Data from the two treatments are examined
using descriptive and non-parametric statistics to ascertain differences between
the two. The results are discussed with reference to previous research on salt
marsh bird ecology and recommendations for future research.
Chapter 6, environmental settings, begins with unobtrusive observation to
examine human visitor behaviour around the grazing area. Further to this, using
inductive social research methods, informal interviews were undertaken and a
thematic analysis was performed on the interview data to determine ecosystem
services provided by the management intervention. A discussion follows this
with the implications of the results with recommendations as to how these could
be acted upon.
Salt marsh sediment is recognised as an important carbon store (Chmura
et al., 2003). The research presented in Chapter 7 describes loss of ignition to
determine any differences in stored carbon arising within the salt marsh as a
result of the management regime. Using previously described methods (Ford et
al., 2012b), the number of tonnes of carbon stored per hectare to a depth of
15cm is calculated between grazed and ungrazed treatments. These results are
descriptively presented and statistically analysed using parametric statistics.
7 treatments, the economic value of the stored carbon in pounds sterling is
calculated.
In Chapter 8 an analysis of the effects of grazing on the ecosystem service
of the immobilisation of pollutants is investigated. Lead and arsenic were
selected as ideal elements to examine as they are stable elements in sediments
(Dudka and Miller, 1999) and maintain stability in salt marsh sediments (Cave et
al., 2005). A repeated measures procedure is described which explored the
change over time (after one year, and after two years) compared to the status of
the two pollutants prior to the commencement of grazing. These data were
compared using both descriptive and non-parametric statistics.
In Chapter 9, the findings, conclusions, and recommendations presented
in the research, and the results thereof, are drawn together through a
discussion. The current knowledge into the ecosystem approach and
ecosystem services and how this has evolved in the current case study from
current national and European environmental aims are brought together. The
cyclical and iterative aspect of the research is examined using a framework
which proposes to integrate environmental decision making and ecosystem
services (Daily et al., 2009). The contribution to the body of knowledge by the
current research is then discussed. Lastly, further recommendations to advance
the body of knowledge in this field are presented at the end of this concluding
8
9
2.
Literature Review
2.1 Introduction to Literature Review
This chapter has two aims: 1) to establish the current knowledge of
literature surrounding the relationship of humans with nature, and ecosystem
services and the ecosystem approach, and 2) from the extant literature, to
identify emerging questions that may be translated into the aims and objectives
of the current research. The aims of this chapter are achieved by beginning with
a critical review of social-ecological systems knowledge, the ecosystem
approach, and ecosystem services. A description of how social-ecological
systems bridge the traditional divide between ecological and social sciences
(Section 2.2) and a description of these systems (Section 2.3) is presented.
This description focuses on the interplay between social sciences and
ecological processes. In Section 2.4 the ecosystem approach, a holistic system
of managing ecosystems is introduced. A mainstay of the ecosystem approach
is maintaining and enhancing ecosystem services: the benefits provided by
nature to humans, is presented in Section 2.5. Emerging questions from the
literature review are identified, leading to the aims and objectives of the
research project (Section 2.6).
2.2 Humans in Nature
Professor Sir Robert Watson, former chief scientific adviser for the UK’s
DEFRA and current vice-chair of the Intergovernmental Platform on Biodiversity
and Ecosystem Services (IPBES), during his plenary address delivered to the
European Congress of Conservation Biology held in Glasgow, Scotland, August
2012 (attended by the author), made three statements:
1. ‘Local knowledge is essential.’
2. ‘We must work with end users.’
10 The three statements refer to the need and requirement to bring together
ecological and social sciences, to include people in decision making, and to
practice interdisciplinary methods in scientific research related to managing the
environment.
Ecology and sociology have traditionally been separated into different
scientific disciplines with different approaches to data collection and analysis.
The inclusion of humans in natural sciences has been challenging since the
recognition of ecology as a distinct discipline (Pickett et al., 1997; Liu et al.,
2007). The spectrum of opionion has an extreme range: starting with those for
the inclusion of humans as an equal biological component and ending with
those for complete exclusion of humans (Pickett et al., 1997). Integrating the
two disciplines of natural and social science requires an approach recognising
their reliance on one another and effective collaboration between the two.
In contrast to a seperation between the sciences, Adams (1938) asked if
the same structures and relationships found in the natural world existed in
urban environments, how feedback1 crossed social boundaries, and how these
related to each other. Adams (1938) called for a closer relationship between the
biological and social sciences to better understand the social implications of
managing urban environments at biological and biophysical levels.
Hollingshead (1940) fostered this closer relationship through his thesis
that studies of humans should be viewed holistically, thus recognising the
undisputable place of humans in the web of life. Hollingshead (1940)
differentiated between plant, animal, and human ecology by the survival
strategies exemplified by the social relationships of individuals. According to
Hollingshead (1940), plants lack feeling, collective strategies, or familial
networks obvious in the animal kingdom. Animals display strong elements of
instinctive adaptations to their environments; higher animals display collective
aims and family relationships. Humans are differentiated from the plant and
1
11 animal kingdoms due to culturally and socially organised behaviour, learned since birth. Hollingshead’s social versus ecological approach has been
embedded within academia as a ‘division of labour’ in which social sciences are
examined by sociologists, and the natural world by ecologists (Palsson, 1998, p.
48). This separate relationship is becoming highly questionable in light of
increasing academic theory and empirical evidence which suggests the two are
intertwined (Palsson, 1998). A significant indication of this is the name of a new
epoch succeeding the Holocene, the Anthropocene.
This name emphasises the strong relationship between humanity and the
environment and how they are now inexorably connected (Crutzen, 2002;
Potschin and Haines-Young, 2011b). As the term Anthropocene, and the
associated concept, has cascaded into academic discourse; the traditional
divide between social and ecological sciences has been bridged by the
development of social-ecological systems as conduits to integration (Berkes
and Folke, 1998).
The Anthropocene was named as a result of increasing evidence of the
influence of people on the environment (Crutzen, 2002). Crutzen (2002) marked
the beginning of this period as the late 18th century. Crutzen (2002) noticed the
increased levels of carbon dioxide and methane found in polar ice air pockets,
dated the late 18th century, coincided with James Watts’ steam engine design in
1784. Figure 2 clearly indicates the rise in number of publications the
Anthropocene term has reflected in academic writing. This rise in the number of
publications is indicative of the growing number of research investigating
12 Describing the relationship between social and ecological systems in the
Anthropocene has involved various approaches and semantic issues. Examples
including coupled human-environment systems, ecosocial systems, and
socio-ecological systems have been suggested by scholars (Folke et al., 2005). However, treating ‘social’ or ‘ecological’ as suffixes and prefixes does not
correctly display the equal part these factors play in the system. Berkes and Folke (1998) use ‘social-ecological systems’ to illustrate the influence on each
other, describing attempts to delineate between social and ecology as being ‘artificial and arbitrary’ (Berkes and Folke, 1998, p. 4).
Social-ecological systems are described as human and natural systems
with dynamic relationships involving shared feedback, resilience, non-linear
changes, and heterogeneity (Liu et al., 2007). In other words, social-ecological
systems are dynamic across time and place at various levels of different intensities. For this reason, the current research uses ‘social-ecological’ to
describe the system that exists between humans and ecology.
Urban ecosystems are a prime example where highly dynamic
social-ecological relationships exist. An example of this dynamism is the observed
0 5 10 15 20 25 30 35 40 45 50
2001 2002 2003 2004 2005 2006 2007 2008 2009 2010 2011 2012
Sc
o
p
u
s® r
e
co
rd
o
f p
u
b
liscat
io
n
s
[image:28.595.95.493.72.298.2]Year
Figure 2: Number of publications with ‘Anthropocene’ in the ‘Title, abstract or keywords’. The results show the use of the concept in
13 close link in the human behaviour patterns in the urban environment with
pressure on existing natural resources (Pickett et al., 1997). This connection
exemplifies the need for social and ecological integration within ecosystem
management (Pickett et al., 1997). Such social-ecological relationships cannot
be ignored and conceptual frameworks describing these aid their understanding
(Pickett et al., 1997).
2.3 Social-ecological Systems Analysis
Social-ecological systems occur where an ecological system interacts
with, and is affected by, two or more social constituents (Anderies et al., 2004).
Society was asked to identify, recognise, and analyse social-ecological systems
by Berkes and colleagues in 2003 (Berkes et al., 2003). Social-ecological
systems facilitate the bridging of disciplines through discourse between
scientists, conservation practitioners, administrators, and resource users
(Glaeser et al., 2009). A social-ecological approach to managing landscapes
and ecosystems makes it unnecessary to divide the social and natural sciences, and compliments the understanding of both disciplines’ reliance upon one
another (Wang et al., 2013). Knowledge of links between the two disciplines
within social-ecological systems are weak and there remains much scope for
further understanding of these (Glaeser et al., 2009). In complex
social-ecological systems, feedback between social-ecological and social management of
ecosystems needs to be defined and characterised as the two interact (Liu et
al., 2007).
In order to be understood, complex social-ecological systems should be
viewed from multiple perspectives (Berkes et al., 2003). Walker and Meyers
(2004) describe feedback within social-ecological systems and how these
systems are interrelated through changes in their components and constituent
parts. These descriptions make explicit reference to changes in one part of the
social-ecological system, for example governance or human actors having an
effect on another. Governance in a social-ecological system involves humans
making decisions concerning managing structures and processes (Folke et al.,
14 Governance involves decision making by authoritative bodies that creates
shifts in an ecological system: for example land use change by introducing
grazing to a landscape, driven by changes in the social system (Walker et al.,
2006). Governance can result in non-linear, negative results. Where
governance has decided on grazing, for example, high grazing intensity can
create soil conditions in which seeds are unable to germinate (Walker et al.,
2006; Doody, 2008). Hence, a link exists between governance and ecological
results.
Hardin wrote of the unsustainable exploitation of natural resources in his treatise ‘The Tragedy of the Commons’ in which he debated the negative
consequences of unmanaged use of natural resources (Hardin, 1968). Hardin
argued that ungoverned open areas create degraded, unusable landscapes
because of over-exploitation by individuals and posed the question as to
whether increased governance of environmental resource would be desirable (Hardin, 1968; Anderies et al., 2004). In a ‘Tragedy’ scenario, humans are short
sighted and concerned with their own individual requirements, extracting their
own resources, the resultant damage being borne by the collective community
and the environment (Glaeser et al., 2009).
Historically, the exploitation by humans of natural resources to increase
outputs has led to a homogeneity of terrestrial and marine habitats which in turn
leads to lower environmental variability and increases uncertainty (Folke et al., 2005). The relationship between humans’ use and exploitation of nature reveals
a pattern of adapting this use to the conditions humans create (Folke et al.,
2005): an iterative process. The capacity of ecosystems to adapt to, and
maintain pace with this increased management, from local to global scales, has
been reduced in modern times (Folke et al., 2005).
Social-ecological systems have been placed under severe threat because
of changes in biophysical and human processes including, but not limited to,
increased carbon emissions, population flux, overharvesting of resources, and
pollution (Ostrom, 2007). Humans have transformed ecosystems more in the
last 50 years than all prior recorded history (Collins et al., 2010; Chapin et al.,
15 mitigated by managing social-ecological interactions (Carpenter et al., 2009). A
method to manage large scale social-ecological systems has been proposed in
the ecosystem approach.
Complex social-ecological systems require a multiple perspective
approach. In order to best understand the current status of a social-ecological
system, a historical perspective is required (Berkes et al., 2003). This is
especially true in social systems as each has a unique history and context
providing a different perspective (Berkes et al., 2003). Two approaches are
used in the analysis of social-ecological systems: modelling, and writing
scenarios (Glaeser et al., 2009). Analysis of social-ecological systems has
followed two distinct strands: through interdisciplinary research in an applied
and participatory paradigm; and through epistemological discussion on scientific
knowledge (Glaeser et al., 2009).
A conceptual framework for humans and ecosystems is ‘a concise
summary in words or pictures of relationships between people and nature’ (Ash
et al., 2010). In keeping with this, Berkes and Folke (1998), Folke et al. (2005)
and Liu et al. (2007) describe social-ecological systems as systems which
illuminate or describe the relationships and interactions between social and
ecological factors in the area under research, to include all ecological and social
aspects and how these are related to each other through management. A
conceptual framework of a social-ecological system illustrating the three
16
Figure 3: Representation of a social-ecological system. Adapted from Berkes and Folke (1998) and Folke et al. (2005)
2.4 The Ecosystem Approach
In the modern environmental management era, the ecosystem approach
has encapsulated a strategy for a holistic, sustainable management of all
components of landscapes. Incorporating social, scientific, and economic
issues, this approach is described as ‘a strategy for the integrated management
of land, water and living resources that promotes conservation and sustainable use in an equitable way’ (CBD, 2000, p. 104) enabling decisions to be made for
all parts of the ecosystem (Haines-Young and Potschin, 2008). This equitable
and sustainable use of natural resources, promoting conservation of the
environment, is connected with the improvement and enhancement of human
well-being (Alfsen et al., 2011). The practical application of the ecosystem approach implies ‘intersectoral cooperation, decentralisation of benefits, and the use of adaptive management policies’ (CBD, 2000, p. 91).
Adaptive management is a crucial part of the ecosystem approach; as
relationships between various parts of ecosystems are often non-linear,
responses to management are required when such situations arise (CBD,
2000). An adaptive ecosystem approach through governance, management,
17 adaptive method: governance determines trade-offs and actions for
sustainability; management implements these actions; and monitoring provides
the necessary information to inform the effectiveness of governance, thereby
establishing optimal future management (Folke et al., 2005).
The ecosystem approach is a flexible framework; its principles, for
example, adaptive management, are integrated into management strategies to
maximise ecosystem services (Haines-Young and Potschin, 2008). Adaptive
management takes place as a fluid process; as strategies are implemented, the
results of these inform the next decision creating results which are acted upon
for the following stage (Berkes et al., 2003). Adaptive management allows
on-going decision making to take place in experimental resource policy situations
for continual learning by resource managers (Berkes et al., 2003).
The ecosystem approach and its principles in managing the environment were endorsed at the United Nations Environment Programme’s fifth
conference of parties to the Convention on Biological Diversity in Nairobi in May
2000 (CBD, 2000). Twelve complementary and interlinked principles were
adopted by the Nairobi conference. These form the backbone of the approach
(CBD, 2000):
1. The objectives of management of land, water and living resources are a
matter of societal choice.
2. Management should be decentralised to the lowest appropriate level.
3. Ecosystem managers should consider the effects (actual or potential) of
their activities on adjacent and other ecosystems.
4. Recognising potential gains from management, there is usually a need
to understand and manage the ecosystem in an economic context. Any
such ecosystem-management programme should:
a) Reduce those market distortions that adversely affect biological
diversity
b) Align incentives to promote biodiversity conservation and sustainable
18 c) Internalize costs and benefits in the given ecosystem to the extent
feasible.
5. Conservation of ecosystem structure and functioning, in order to
maintain ecosystem services, should be a priority target of the ecosystem
approach.
6. Ecosystems must be managed within the limits of their functioning.
7. The ecosystem approach should be taken at the appropriate spatial and
temporal scales.
8. Recognising the varying temporal scales and lag-effects that
characterise ecosystem processes, objectives for ecosystem management
should be set for the long term.
9. Management must recognise that change is inevitable.
10. The ecosystem approach should seek the appropriate balance
between, and integration of, conservation and use of biological diversity.
11. The ecosystem approach should consider all forms of relevant
information, including scientific and indigenous, and local knowledge,
innovations and practices.
12. The ecosystem approach should consider all relevant sectors of
society and scientific disciplines.
The emphasis within the ecosystem approach relates to the fifth principle which creates a ‘priority target’ (CBD, 2000, p. 106) and states that by conserving the
structure and functions of ecosystems, ecosystem services can be maintained
(CBD, 2000).
2.5 Ecosystem Services
2.5.1 The History and Modern Relevance of Ecosystem Services
Humans have recognised the connection between personal well-being and
19 Fisher et al., 2009). The unsustainable use of ecosystems and ignoring nature’s
benefits was noted by Diamond (2006) who used the example of the Easter Island civilisation’s unsustainable use of timber, and the resultant deforestation
and soil erosion and subsequent collapse of the population (Diamond, 2006; Fisher et al., 2009). In the modern era, Hardin’ s tragedy, wherein unmanaged
land is unsustainably used and therefore degraded to such an extent so as to
produce no benefit to people (Berkes and Folke, 1998).
Modern academic discourse and research has termed these benefits ‘ecosystem services’, the phrase first being used in 1981 (Fisher et al., 2009).
Three seminal studies have led the research into ecosystem services since
2005: The Millennium Ecosystem Assessment (MA) (MA, 2005e), the
Economics of Ecosystems and Biodiversity Study (TEEB) (TEEB, 2010d), and
the United Kingdom National Ecosystem Assessment (UK-NEA) (UK-NEA,
2011b). Ecosystem services can be enumerated, bundled, and categorised to
facilitate the ease of which these benefits are described and presented to policy
makers and society at large.
Ascribing values for ecosystem services is a mainstay of the ecosystem service approach. The monetisation of nature’s services was discussed, initially
as an abstract idea by Westman (1977), posing questions in order that objective
decisions regarding use of ecosystems could be made. The highest impact
article in the field of ecosystem services to date described an economic value
for 17 ecosystems in 16 biomes based on previously published and original
calculations (Costanza et al., 1997). This seminal work instigated much
discussion and research on ecosystem services (Fisher et al., 2009;
Gómez-Baggethun et al., 2010). Costanza et al. (1997) valued the total biosphere as at
least $33 trillion year -1 (£20.8 trillion year-1). This monetisation of ecosystem
services may create markets and an easily understandable reference point for
managing ecosystems that economists may embrace, but anthropologists and
philosophers urge restraint in simply monetising natural assets given high
intrinsic values attached to nature by non-business sectors of society (Glaeser
20 The monetisation of ecosystem services has been much debated and in some cases found to be highly questionable (Heal, 2000). Determining nature’s economic values from the philosophical ‘water-diamond paradox’, wherein the
market value of diamonds is compared to water, water clearly has more value to
sustain life (Heal, 2000). The water-diamond paradox has been used to show
how economic values of ecosystem services is a questionable precept, often
contextual, and related to market forces (Heal, 2000; de Groot, Fisher, et al.,
2010). In managing ecosystem services, economic translation is often not
required, whilst economic valuation aids decision making it is not a single
panacea (Everard, 2009).
Yet, monetary valuation is clearly valid in many cases, for example in
deferred, or avoided, costs of the Catskill and Delaware watershed case study
(Hancock, 2010). In this case, it was found that building new water filtration
infrastructure by the City of New York would have cost $6- 8 billion in contrast to
the $1.5 billion cost of restoring the watershed areas using conservation
methods (Hancock, 2010). The New York municipal authorities restored the
watershed, thereby making a substantial financial saving through avoided costs
(Hancock, 2010; Liu et al., 2010). This is a very good example of how the
economic valuation of ecosystem services provides a way of communicating the
value of nature to aid decision making for economic and politically driven
governing bodies (de Groot, et al., 2010).
A seemingly exponential increase in interest and research in ecosystem
services in literature was shown by Fisher et al. (2009) and Liu et al. (2010) who carried out an ISI Web of Science® search using the term ‘ecosystem services’
up to 2007. Similarly, Potschin and Haines-Young (2011b), using the term ‘ecosystem services’ in Scopus® up to 2010, found 60% of literature to have
been published between 2006 and 2010 inclusive. The Potschin and
Haines-Young (2011b) method has been modified and is updated, the results of which
are illustrated in the linear graph in Figure 4. The results display the impact of
21
2.5.2 Ecosystem Service Definition
Various typologies and definitions have been suggested for ecosystem
services (de Groot et al., 2002; Wallace, 2007; Fisher et al., 2009) and
discussion in the research literature often revolves around semantic differences
between ecosystem services, processes, and functions (Fisher et al., 2009).
The Millennium Ecosystem Assessment (MA), which set the modern benchmark for ecosystem service science, posits ecosystem services as ‘the benefits
provided by ecosystems that contribute to making human life both possible and worth living’ (MA, 2005c, p. 300). Costanza et al. (2007) define ecosystem services as ‘ecosystem goods (such as food) and services (such as waste
assimilation) which represent the benefits human populations derive, directly or indirectly, from ecosystem functions’; while (Fisher et al., 2009, p. 645) use this definition: ‘ecosystem services are the aspects of ecosystems utilised (actively or passively) to produce human well-being’. Hooper et al. (2005) define
ecosystem services as properties of ecosystems (hydrological cycles,
[image:37.595.90.511.75.335.2]0 200 400 600 800 1000 1200 1400 1600 19 84 19 90 19 91 19 92 19 93 19 94 19 95 19 96 19 97 19 98 19 99 20 00 20 01 20 02 20 03 20 04 20 05 20 06 20 07 20 08 20 09 20 10 20 11 20 12 Sc o p u s® r e co rd o f p u b lic ation s Year
22 processing and cycling of nutrients, pollination, and air and water purification)
which directly benefit human requirements (food, fibre, wood for construction, and leisure). Liu et al.’s (2010, p. 54) definition perhaps best simplifies all of the above as ‘the benefits people obtain from ecosystems’.
The underlying theme of these definitions is an anthropocentric
perception: services are explicitly provided by nature to humans (Egoh et al.,
2007). A primary precept of the ecosystem service paradigm and one on which
this thesis rests, is that ecosystem services can only be described and received
if human recipients are identified (Potschin and Haines-Young, 2011a). A
simple way to view this precept is that while nature continuously creates and
provides function and structure, in a world devoid of humans, there would be no
services (Fisher et al., 2009). The delineation between ecosystem processes
and functions, and ecosystem services, is the presence of human beneficiaries (Chan et al., 2006). The ecosystem service approach’s uniqueness rests with
the presence of human beneficiaries.
Concomitant with scientific literature, government and organisations have readily embraced the ecosystem service concept. The UK’s Department for
Environmental, Food and Rural Affairs (DEFRA) implemented the ecosystem
services approach in 2007 as a means of effective environmental management
(Everard, 2009). The current UK Government, in a discussion document
published in July 2010, acknowledged the close link between a healthy natural
environment and human happiness, prosperity, and well-being, citing the
ecosystem services framework as a valuable conservation approach (Crown,
2010). The United Kingdom National Ecosystem Assessment (UK-NEA),
discussed below, was the first full national ecosystem assessment carried out at the instigation of a government, illustrating the United Kingdom’s high
commitment to the concept (UK-NEA, 2011b). Using ecosystem services as a
toolkit for management of ecosystems to enhance benefits was recognised by the incorporation of the MA’s recommendations into the Convention on
Biological Diversity, and the RAMSAR Convention on Wetlands, within a year of the MA’s publication (Tallis and Polasky, 2009). In addition, the structure and
aims of the MA were incorporated into the AICHI Biodiversity targets, a list of 20
23 Biological Diversity to halt losses in biodiversity and enhance ecosystem
services through the Living in Harmony with Nature (UNEP, 2010).
In ecosystem service management, ecosystems are viewed as
environmental assets, comparable with capital assets and as such, a
sustainable, integrated method of management not degrading their value is
required (Defra, 2007; TEEB, 2010a). At present, conservation practice using
the ecosystem service concept is a growing field with gaps in areas of research
(Egoh et al., 2007) for example, cultural services of salt marsh (Everard, 2009).
Ecosystem services should be seen as bundles which provide a range of
services, the level and quality of which is dependent on management of the
services, where effort is placed, and the interaction of the services with each
other, and exogenous drivers of change (Bennett et al., 2009; TEEB, 2010a).
Linking ecosystem services, science, policy makers and interest groups
creates a strong and robust management system. The ecosystem service
framework has the capacity to investigate relationships between land use
change and the delivery of services to society (Bennett et al., 2009). While
theoretical approaches abound, questions remain regarding integrating decision
making and ecosystem services so that landscape management for multiple
ecosystem services can be attained (Egoh et al., 2007; Bennett et al., 2009). A
methodological problem within the ecosystem service framework is the different
perspectives between natural and social scientists and the search for
generalisation in the approach to managing for ecosystem services
(Haines-Young and Potschin, 2013). Generalisation of the approach is recommended so
that ideas are made testable, but also so that the research experience can be
transferred between assessments and case studies (Haines-Young and
Potschin, 2013).
Two seminal assessments now guide the ecosystem service approach
globally and nationally, these are the MA and the UK-NEA respectively. The
importance of their findings should not be underestimated. Therefore, these two
assessments are discussed here.