© 2017, IRJET | Impact Factor value: 5.181 | ISO 9001:2008 Certified Journal
| Page 1162
Cloud Based Disaster Detection & Management System using WSN
M Chaitra
1, Dr. B Sivakumar
21
M. Tech Student , Department of Telecommunication Engineering, Dr. Ambedkar institute of
Technology,Bangalore-560056
2
Professor, Department of Telecommunication Engineering, Dr. Ambedkar institute of
Technology,Bangalore-560056
---***---Abstract
- Natural disasters and unreal conflicts typically generate Brobdingnagian volumes of debris/dust. Destruction of homes and public infrastructure as a result of a flood, earthquake, landslide or conflict will contribute to insecurity, loss of life, displacement of populations, and therefore the interruption of public services. Wireless Sensor Networks play a crucial role in disaster debris detection and management system. Debris flows square measure a sort of mass movement that happens in mountain torrents. They comprise a high concentration of solid material in water that flows as a wave with a steep front. Debris flows may be thought-about a development intermediate between landslides, earthquake and water floods. They are amongst the foremost venturesome natural processes in mountainous regions and should occur due to completely different weather conditions. Their quality is attributable to completely different factors: their capability of transporting and depositing Brobdingnagian amounts of solid materials, which can additionally reach giant sizes (boulders of many three-dimensional meters square measure ordinarily transported by dust flows), their steep fronts, which can reach many meters of height and additionally their high velocities. A disaster management system is designed using mote and N-gateway such that the flow of debris can be measured and alert is sent to the public and rescue team by using cloud services in advance so that there is less loss of life and property.Key Words
:
WSN, Debris flow, N-mote, N-gateway, alert, Cloud services.
1.
INTRODUCTION
Wireless Sensor systems for debris stream observing and cautioning assume an essential part among non-auxiliary measures expected to decrease debris flow chance. Specifically, debris flow warning frameworks can be subdivided into two primary classes: advance warning and event warning. These two classes utilize distinctive sorts of sensors. Advance warning systems depend on checking causative hydro meteorological procedures (commonly precipitation) and plan to issue a notice before a conceivable debris stream is activated.
Event warning systems depend on distinguishing debris streams when these procedures are in advance. They have a significantly littler lead time than preemptive guidance ones but at the same time are less inclined to false cautions.
Advance warning for debris flows utilizes sensors and systems, including measuring precipitation by methods for rain guages and climate radar and observing water release in headwater streams.
Event warning systems use different types of sensors, encompassing ultrasonic or radar gauges, ground vibration sensors, video cameras, avalanche pendulums, photocells, trip wires etc. Event warning systems for debris flows have a robust linkage with debris-flow monitoring that is carried out for analysis purposes: the same sensors are often used for both monitoring and warning, though warning systems have higher requirements of robustness than monitoring systems.
Debris flows are a kind of mass movement that accommodates extremely focused dispersions of poorly sorted sediment (from clay- to boulder-sized particles) in water that will move at terribly high speeds and have nice harmful power. Debris flows typically seem as waves (surges) that have steep fronts consisting principally of boulders. Behind the boulders front, the stage height and variety of boulders bit by bit decrease, and therefore the surge is charged with pebble-sized fragments then becomes a lot of and a lot of dilute till it finally seems as muddy water.
Conditions needed for debris flow occurrence embrace the supply of relevant amounts of loose rubble, high slopes and sharp water inflows which will return from intense rainstorms, collapse of channel obstructions, rapid snowmelt, glacial lakes outburst floods, etc. These needs square measure met in several mountainous basins below different atmospheric condition, creating rubble flows a widespread development worldwide.
By using various sensors for measuring different parameters of debris flow, a system is designed such that it alerts the public as well as the rescue team like weather forecast department before and after the event has occurred so that there will be less loss of life and property.
© 2017, IRJET | Impact Factor value: 5.181 | ISO 9001:2008 Certified Journal
| Page 1163
The need to assess debris flow hazards and scale back the associated risk urges a stronger data of those processes and also the implementation of effective management measures. Observance and warning systems play a vital role within the analysis on debris flows and as a nonfunctional live to attenuate risks, severally.
2.
LITERATURE REVIEW
i. Neural network-based early warning system for debris flow disaster.
The key techniques of building a period forecast model for debris flow disaster victimization neural network (NN) technique square measure explained, as well as the determination of neural nodes at the input layer, the output layer and also the implicit layer, the development of information supply and also the initial weight values and then on.
ii. Reliability and effectiveness of early warning systems for natural hazards: Concept and application to debris flow warning.
The system dependableness is classically drawn by the likelihood of Detection (POD) and likelihood of False Alarms (PFA). The EWS effectiveness, that could be a live of risk reduction, may be developed as a perform of POD and PFA is incontestable. To model the EWS and reckon the dependableness, a frame work supported Bayesian Networks is developed, that is more extended to a choice graph, facilitating the optimization of the warning system. In an exceedingly case study, the frame work is applied to the assessment of associate existing debris flow EWS.
iii. GIS-based susceptibility mapping and zonation of debris flows caused by Wenchuan Earthquake.
Debris flow susceptibility zonation (DBSZ) is critical for disaster management and coming up with development activities in mountainous regions. The results of a pilot study for assessing debris flow hazards exploitation geographicsystem (GIS) techniques is given. The debris flow caused by earthquake in Wenchuan County was known on the premise of remote sensing pictures interpretation and field investigation. The debris flow nominal status issue technique has been applied for DBSZ mapping in Wenchuan county.
iv. Disaster Management System Using GSM.
In this five sensors are used, those are angle or tilt sensing element which supplies the readings of slope angle if
there's any movement because of the landslide and it's conjointly used for tidal wave alerting purpose, rain gage sensing element is employed to gather the depth of water at the mountains, soil drift sensing element is employed for
detection of landslide, earthquake sensing elements area unit used for earthquake detection purpose and temperature sensor is employed for collecting the temperature.
v. Natural Disasters Alert System Using Wireless Sensor Network.
The sensor nodes are custom-developed float sensors and acceleration sensors and a low power readout ASIC circuit for a long life. The accelerometers are used to measure the seismic response of the earthquake. They detect vibrations during an earthquake event and send data to remote base station where multiple sensors data across the town is collected. A RF module provides low power network architecture is implemented over an 802.15.4.
vi. Development of Wireless Sensor Node for Landslide Detection.
This system is based on the wireless sensor network (WSN) that is composed of sensor nodes, gateway, and server system. Sensor nodes comprising sensing and communication part are implemented to detect ground movement. A sensing part is designed to measure inclination angle and acceleration accurately, and a communication part is deployed with Bluetooth (IEEE 802.15.1) module to transmit the data to the gateway. To verify the feasibility of this landslide prediction system, a series of experimental studies was performed at a small-scale earth slope equipped with an artificial rainfall dropping device. It is found that sensing nodes planted at slope can detect the ground motion when the slope starts to move.
3.
SYSTEM OVERVIEW
Initially the sites prone to disaster are examined. The sensors to measure different parameters of debris flow are employed at sites which are prone to disaster. These sensors are in turn connected to microcontroller (N Mote) which controls and collects data from the sensors.
Communication from N-Mote to N-Gateway is done using ZigBee protocol (802.15.4). ZigBee is used for short range communication i.e 600mts Line of sight (LOS) and 200mts Non-Line of sight (NLOS) communication.
© 2017, IRJET | Impact Factor value: 5.181 | ISO 9001:2008 Certified Journal
| Page 1164
Fig 1: System architecture for detecting and monitoring debris.
A. Measurement of Flow Depth.
Ultrasonic sensor is employed to measure the flow depth of debris. Ultrasonic sensors hung over the channel measure the distance between the flow surface and the sensor itself, making it possible to record debris flow hydrographs
These sensors are also used to measure the water level in rivers; however, the strong and rapid variability of flow height with time in debris flows requires much shorter logging intervals between two consecutive recordings (typically 1 second).
B. Measurement of Ground Vibration.
Accelerometer sensor is used for measuring ground vibration. An important advantage of ground vibration sensors is that they can be installed at a safe distance from the channel bed.
This overcomes an important shortcoming of other types of sensors, like the ultrasonic gauges, which need to be hung over the channel and thus are more prone to damage.
C. Measurement of pressure of debris flow.
Pressure transducers installed at the bottom of the channel make it possible to measure basal pore fluid pressure. Debris flows exert huge impact forces on all obstacles in their path,
such as bridge piles, defensive walls and buildings.
The impact force of debris flows consists of two components: the dynamic pressure of fluid and the collisional force of single boulders.
D. Measurement of Soil moisture.
Soil moisture sensor is used to measure the amount of water content. If there is large amount of water content in mountainous regions there are chances of occurring of debris flows.
If there is large amount of water content in the soil then the sensor outputs low voltage , if the water content is less, then the output of the sensor reads high voltage.
E. N- Mote Section Sensors
:
Are used by wireless sensor nodes to capture datafrom their environment. They are hardware devices that produce a measurable response to a change in a physical condition like temperature or pressure. Sensors measure physical data of the parameter to be monitored and have specific characteristics such as accuracy, sensitivity etc. Controller (Atmega128):The controller performs tasks, processes data and controls the functionality of other components in the sensor node. All the data coming from sensors are extracted and stored in microcontroller’s memory and it is sent to ZigBee receiver which is present inside the n-mote module.
[image:3.595.56.289.123.298.2]Zigbee transceiver: A ZigBee module is present inside the n-mote which receives the data coming from the sensors and transmits to ZigBee present in n-gateway wirelessly. This is done using a software XCTU, where coding is done for sender and receiver separately so that both the ZigBee module can communicate wirelessly.
Fig 2: N-Mote section Flow chart.
Sensor data
Atmega128
Xbee Receiver
Transmitter
1
Gmail
Mobile
UBIDOTS IBM BLUEMIX/
CLOUD
N GATEWAY N MOTE
sensor soil moisture Accelerometer
Pressure sensor Ultrasonic sensor
Zigbee
[image:3.595.393.493.539.707.2]© 2017, IRJET | Impact Factor value: 5.181 | ISO 9001:2008 Certified Journal
| Page 1165
F. N- Gateway Section.
[image:4.595.321.546.98.364.2]The data sent form ZigBee present in n-mote is acquired by ZigBee receiver present in gateway. N gateway has n-mote and an additional process inside it. The processor used here is Orange pi, uses Armbian operating system which processes the data coming from the ZigBee receiver and send it to cloud. There is terminal display where all the data coming from ZigBee can be viewed by running the python script in linux operating system. The received serial data is sent to cloud by using Ethernet or Wifi through gateway.
Fig 3: N-Gateway section Flow chart.
G. Cloud Section
The N-gateway is used to connect a different device which uses different protocols. Here an n-gateway is used to connect mote to cloud. The sensor data coming from n-mote is sent to n-gateway and from n-gateway it is sent to cloud using python scripting.
The data which is sent to cloud is stored in cloud database. An initial threshold value is set, if the threshold is reached i.e if a disaster is likely to occur then the cloud sends messages to user mobile phone, gmail account and to weather forecast department.
A reverse process is set wherein if the threshold value is reached a reverse signal from cloud is sent back to sensor node where an alarm is set to alert the public in case of emergency.
N
Y Cloud
Database
If Threshold value is reached
Mobile Gmail WeatherForecast
[image:4.595.80.236.244.485.2]Department 2
Fig 4: Cloud section Flow chart.
4. WORKFLOW LANGUAGES
Embedded C is a set of language extensions for the C Programming language by the C Standards committee to address commonality issues that exist between C extensions for different embedded systems. Historically, embedded C programming requires nonstandard extensions to the C language in order to support exotic features such as fixed-point arithmetic, multiple distinct memory banks, and basic I/O operations.
In 2008, the C Standards Committee extended the C language to address these issues by providing a common standard for all implementations to adhere to. It includes a number of features not available in normal C, such as, fixed- point arithmetic, named address spaces, and basic I/O hardware addressing.
Embedded C uses most of the syntax and semantics of standard C, e.g., main() function, variable definition, datatype declaration, conditional statements (if, switch case), loops (while, for), functions, arrays and strings, structures and union, bit operations, macros, etc.
Python
is
a widely usedhigh-level programming languageforgeneral-purpose programming, created byGuido van Rossumand first released in 1991. Aninterpreted language.Python has a largestandard library, commonly cited as one of Python's greatest strengths,providing tools suited too many tasks. This is deliberate and has been described as Ethernet/ Wifi
Xbee Receiver
Atmega128
Terminal display
Received Serial data
Cloud 1
© 2017, IRJET | Impact Factor value: 5.181 | ISO 9001:2008 Certified Journal
| Page 1166
batteries included Python philosophy. For Internet-facing applications, many standard formats and protocols (such asMIMEandHTTP) are supported.
Modules for creatinggraphical user interfaces, connecting torelational databases,generating pseudorandom numbers, arithmetic with arbitrary precision decimals,manipulatingregular expressions, and doingunit testingare also included. Some parts of the standard library are covered by specifications (for example, theWeb Server Gateway Interface(WSGI) implementation wsgiref follows PEP 333), but most modules are not. They are specified by their code, internal documentation, and test suites (if supplied).
However, because most of the standard library is cross-platform Python code, only a few modules need altering or rewriting for variant implementations.
5.
RESULTS
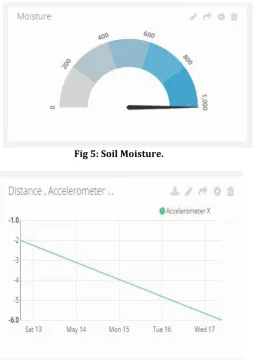
[image:5.595.310.560.79.250.2]The various data collected from the sensors at different time intervals stored in ubidots cloud is shown below.
Fig 5: Soil Moisture.
[image:5.595.314.562.287.444.2]Fig 6: Accelerometer X-axis.
[image:5.595.34.556.368.756.2]Fig 7: Accelerometer Y-axis
Fig 8: Accelerometer Z-axis.
Fig 9: Distance.
6.
CONCLUSION AND DISCUSSION
[image:5.595.42.308.380.741.2] [image:5.595.308.561.477.657.2]© 2017, IRJET | Impact Factor value: 5.181 | ISO 9001:2008 Certified Journal
| Page 1167
Finally, the need for a careful management and maintenance of debris flow warning systems must be stressed. The presence of a debris flow warning system could actually induce a feeling of safety, which is justified only if proper and continuous operation of the system is ensured.
REFERENCES
[1] Qiu J, Xiao B, Lv K,“Design and implementation of the short-term forecasting and environmental monitoring system over WSN for urban special site,” IEEE Fifth International Conference on Advanced Computational Intelligence (ICACI), pp. 756-759.
[2] Roy J K, Gupta D, Goswami S, “An improved flood warning system usingn WSN and Artificial Neural Network, ”India Conference (INDICON), pp. 770-774, 2012.
[3] Mittal R, Bhatia M P S, “Wireless sensor networks for monitoring the environmental activities,” IEEE International Conference on Computational Intelligence and Computing Research (ICCIC), pp. 1-5, 2010
[4] Lee H C, Banerjee A, Fang Y M, et al, “Design of a multifunctional wireless sensor for in-situ monitoring of debris flows,” IEEE Transactions on Instrumentation and Measurement, , 2010.
[5] Liu Z, Liu Y, Gong X, et al, “A monitoring and warning system for brae debris flow with multi-sensor network,” Chinese IEEE on Control and Decision Conference (CCDC), ,pp. 3781-3785, 2011
[6] Motegi S, Yoshihara K, Horiuchi H. Proposal,” Multipath Routing for Adhoc Networks,” Institute of Electronics, Information and Communication Engineers Technical Study Report, pp. 51-56, 2002
[7] Bletsas A, Khisti A, Reed D P, et al.” A simple cooperative diversity method based on network path selection,” IEEE Journal on Selected Areas in Communications, pp. 659-672, 2006
[8] Jing Y, Jafarkhani H. Single and multiple relay selection schemes and their achievable diversity orders, IEEE Transactions on Wireless Communications, pp. 1414-1423, 2009
[9] Michalopoulos D S, Karagiannidis,”G K. PHY-layer fairness in amplify and forward cooperative diversity systems,” IEEE Transactions on Wireless Communications, pp. 1073-1082, 2008
[10] Liu J, Lu K, Cai X, et al “Regenerative cooperative diversity with path selection and equal power consumption