http://dx.doi.org/10.4236/wja.2015.51005
How to cite this paper: Kodavalla, V., Rajkumar, H., Rachakulla, H., Saride, P.V.P., Kallam, S. and Ginnela, B.N.V. (2015) Identification of Socio-Demographic, Behavioral Patterns and Their Relationship with HIV Status among Female Sex Work-ers. World Journal of AIDS, 5, 41-49. http://dx.doi.org/10.4236/wja.2015.51005
Identification of Socio-Demographic,
Behavioral Patterns and Their Relationship
with HIV Status among Female Sex Workers
Venkaiah Kodavalla1*, Hemalatha Rajkumar1, Harikumar Rachakulla1,
Paleswara Vara Prasad Saride1, Srinivasan Kallam2,
Brahmam Narsimhachari Veera Ginnela1
1National Institute of Nutrition, Hyderabad, India 2FHI30, New Delhi, India
Email: *kodalivenkaiah@yahoo.com
Received 7 February 2015; accepted 25 March 2015; published 26 March 2015
Copyright © 2015 by authors and Scientific Research Publishing Inc.
This work is licensed under the Creative Commons Attribution International License (CC BY). http://creativecommons.org/licenses/by/4.0/
Abstract
The prevalence of HIV in high risk population is influenced significantly the behavioral and socio- demographic characteristics. However, considering the complexity of behavior among female sex workers, the relationship between a particular behavioral pattern and the HIV status of this “at risk” population assumes significance. Data generated in a community-based cross-sectional study earlier carried out to assess the prevalence estimates, at district level, of HIV status in eight dis-tricts of State of Andhra Pradesh, India was used to carry out factor analysis to explore the role of demographic and behavioral pattern and their relationship with the HIV status among female sex workers. Data on 3083 female sex workers in the study revealed that there existed nine patterns among demographic and behavioral characteristics, which explained 62% of the total variation through factor analysis. Further, cluster analysis was performed to identify the groups of individ-uals having similar characteristics. Two of those clusters had sizeable numbers having similar characteristics. FSWs belonging to cluster 2 had significantly high risk factors compared with Cluster 1. The overall prevalence of HIV was 11.4% (10.6% in cluster 1 and 15.9% in cluster 2) among high risk population. There exists a strong relationship between behavioral patterns and HIV positive.
Keywords
Behavioral Patterns, Community-Based Cross-Sectional Studies, Principal Component Analysis (PCA), Factor Analysis, Cluster Analysis, HIV Status
1. Introduction
India, the second-most populous country in the world, has been experiencing a highly varied HIV epidemic, in the past two decades. HIV in India is concentrated mainly among “high-risk” populations such as Female Sex Workers (FSWs), Men having Sex with Men (MSM) and Injecting Drug Users (IDUs). Targeted interventions (TIs) among these populations have been a major aspect of India’s National AIDS Control Programme (NACP). The recent HIV estimates showed a reduction in the adult HIV prevalence from 0.41% in the year 2000, through 0.36% in 2006 to 0.31% in 2009. The estimated number of new annual HIV infections declined from 2.7 lakh in 2000 to 1.2 lakh in 2009 [1].
New infections reduced by 50% during this period. Therefore sustained focus on prevention is envisaged by NACO.
Andhra Pradesh (AP) has been categorised as “A” with HIV prevalence among FSW > 1% and the state re-mains to be critical in the spread & control of the epidemic. The state has the second highest estimated adult HIV prevalence of 0.90% after Manipur (at 1.40%). While India has an estimated 24 lakh people living with HIV/AIDS in 2009, AP tops the list of states with about 5 lakh people living with HIV/AIDS; followed by 4.2 lakh in Maharashtra, 2.5 lakh in Karnataka and 1.5 lakh in Tamil Nadu. Of the estimated people living with HIV/AIDS, 9.3 lakh (39%) are women [1].
HIV prevalence among Female Sex Workers (FSW) in Andhra Pradesh increased from 7.3% in 2006 to 9.7% in 2007. Sentinel surveillance data of 2007 also depicted Andhra Pradesh as the only state with >1% prevalence among ANC attendees [2]. (HIV Sentinel Surveillance and HIV Estimation in India 2007. A Technical Brief- NACO.)
Targeted interventions by the Andhra Pradesh AIDS Control Society (APSACS) and Avahan by Bill and Melinda Gates Foundation (BMGF) are the two major HIV/AIDS prevention programs currently in operation in the state [3]. The state government (in partnership with NACO) has been implementing prevention, care and treatment programs since 1999, which have resulted in significant gains. However, the epidemic continues to be of serious concern, as recent surveillance rounds reveal that, across Andhra Pradesh, prevalence levels continue to display an upward trend, pointing to the need for intensifying preventive intervention programmes.
In this backdrop, the present paper utilizes the “Integrated Behavioral and Biological Assessment” (IBBA) data to analyze and identify the demographic, behavioral and biological patterns among FSWs that contribute or relate to the HIV prevalence in the State of Andhra Pradesh [4].
Objective
The objective of the present communication is to identify behavioral patterns of FSWs and study their relation-ship with HIV status.
2. Methodology
2.1. Sampling & Sample Size
Considering consistent use of condom by 50% FSWs with the clients during round 1 with 15% increase during round 2, with 95% CI, 90% power and 1.7 as design effect the required sample size is 385, rounded-off to 400, which adds up to 3200 FSWs for 8 districts [4]. Sampling frame consisting of different sites of solicitation was developed for each district, a fortnight before commencing the actual survey. Probability sampling method with varied sampling approaches was used to select the site as Primary Sampling Units (PSUs) at the first stage. Conventional Cluster Sampling (CCS) as well as Time-Location Cluster Sampling (TLCS) approaches were adopted, based on the characteristics of the different FSW sub-groups in various districts [5]. FSWs who oper-ated from home were grouped as “home based”, while those who operoper-ated from other places/fixed locations such as brothel, dabha, lodge, or rented room were grouped as “brothel based”. The sex workers who were mo-bile and operated in public places such as street, bus stand, railway station and others were grouped as public place-based sex workers. The CCS approach was used for selecting brothel and home-based FSWs, while TLCS method was used to select public place-based sex workers [5].
2.2. Coverage
Guntur and Prakasam from Costal Region, Chittoor District from Rayalseema Region were covered in the sur-vey, which were under the Avahan interventions, having a high number of Key populations (KPs), diversity among different socio-cultural strata in the region and with a goal of modeling Avahan’s impact in different types of settings. A total of 3083 FSWs were covered from 8 districts in the State.
For the study, FSWs were operationally defined as “any female, ≥18 years, either brothel based (working/ living/operating in red light/brothel areas), home based or public place based (soliciting male clients on the street or in other non-brothel settings), who sold sex in exchange for cash at least once in the last one month”.
The potential risk variables considered in the present analysis included demographic variables such as 1) age 2) literacy, 3) marital status 4) age of initiation of sex work and duration in sex work, the behavioral variables such as 1) having regular clients, 2) having regular unpaid partners, 3) having other regular unpaid partners, 4) having occasional clients, 5) wanted to use condom but could not use due to several reasons, 6) dependency on sex work, 7) had sex during travel, 8) client volume per week, 9) carrying condom at the time of interview, 10) exposed to any interventions, 11) correct knowledge of HIV/AIDS, 12) obtained condom from peer educator and the biological parameters such as 1) history of having any STI during past 12 months and suffering from any STI (syphilis or NG or CT) at the time of interview.
The study was approved by the Health Ministry Screening Committee, Government of India, Family Health International’s Protection of Human Subjects Committee and Andhra Pradesh State AIDS Control Society, the Government of Andhra Pradesh. In addition, the Scientific Advisory Committee of National AIDS Research In-stitute (NARI) approved the IBBA protocol, and National InIn-stitute of Nutrition (NIN) Ethics Committees re-viewed and approved the consent forms, study instruments, Standard Operating Procedures (SOPs) and field manuals.
2.3. Statistical Analysis
The percentage distributions of different demographic, behavioral and biological variables were calculated. Be-havioral patterns were obtained by exploratory factor analysis for 20 potential risk variables considering simul-taneously [6]. The principal component analysis (PCA) technique, followed by factor analysis was used to transform a large set of correlated variables into smaller sets of non-correlated variables, called principal com-ponents or factors [7]. The factor analysis of the data objectively points out characteristics those are clustered. The aim of this technique is to identify the underlying structure in data matrix, by summarizing and consigning data to arrive at a systematic measurement of the behavior. To summarize data, factor analysis requires dimension that, when interpreted and understood, describes it in terms of a much smaller number of significant variables than a host of variables.
For the applicability of factor analysis, the uniformity of sample was tested by examining the distribution of variables in a loading plot, contrasting the value observed against those expected in a normal distribution which was verified by Kaiser-Meyer-Olkin (KMO) measurement of adequacy [8]. A KMO value of more than 0.50 was considered acceptable. The presence of correlations between demographic, behavioral and biological va-riables was tested using the Bartlett test of sphericity (homogeneity of variance). The Bartlett test statistic is ap-proximately distributed with chi-square and was accepted at a minimum significance level of p < 0.05. Principle Component Analysis was used for extraction of factors and orthogonal rotation (varimax option) to derive non-correlated factors, to minimize the number of indicators that have high loading on one factor. The first fac-tor extracted is the one that accounts for the maximum possible variance in the dataset. The second component, independent of the first, will be the one that explains the largest possible share of the remaining variance and so on, without the components being correlated with each other. While deriving behavioral patterns for FSWs da-taset, the variable, viz., current HIV status is not included in the analysis as it is intended to study the relation-ship between behavioral patterns vis-à-vis HIV status.
Kaiser criterion, namely Eigen value of >1.0, is widely-used for choosing the number of factors in the factor analysis. It was also based on the Eigen plot (scree plot), which shows the total variance associated with each other.
Discriminant function analysis was used for studying the relationship between the demographic, socioeco-nomic and behavioral variables with HIV status. The factor scores obtained by the factor analysis for these va-riables were considered as continuous independent vava-riables, and HIV status of the female sex workers was considered as dichotomous dependent variable. Sensitivity and Specificity of the discriminant function was also calculated. The statistical analysis was performed using SPSS [10].
3. Results
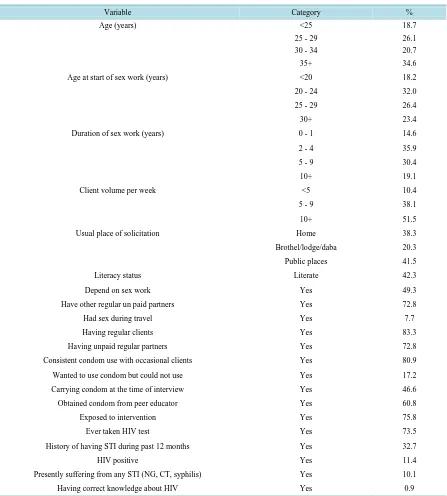
[image:4.595.92.539.222.718.2]The distribution of FSWs according to demographic and behavioral characteristics is presented in Table 1. Ma-jority (42%) of FSWs solicit their clients in public places. About 19% FSWs were in the age group of <25 years,
Table 1. Frequency (%) distribution of FSWs according to their demographic, Behavioral and biological profile (n = 3083).
Variable Category %
Age (years) <25 18.7
25 - 29 26.1
30 - 34 20.7
35+ 34.6
Age at start of sex work (years) <20 18.2
20 - 24 32.0
25 - 29 26.4
30+ 23.4
Duration of sex work (years) 0 - 1 14.6
2 - 4 35.9
5 - 9 30.4
10+ 19.1
Client volume per week <5 10.4
5 - 9 38.1
10+ 51.5
Usual place of solicitation Home 38.3
Brothel/lodge/daba 20.3
Public places 41.5
Literacy status Literate 42.3
Depend on sex work Yes 49.3
Have other regular un paid partners Yes 72.8
Had sex during travel Yes 7.7
Having regular clients Yes 83.3
Having unpaid regular partners Yes 72.8
Consistent condom use with occasional clients Yes 80.9
Wanted to use condom but could not use Yes 17.2
Carrying condom at the time of interview Yes 46.6
Obtained condom from peer educator Yes 60.8
Exposed to intervention Yes 75.8
Ever taken HIV test Yes 73.5
History of having STI during past 12 months Yes 32.7
HIV positive Yes 11.4
Presently suffering from any STI (NG, CT, syphilis) Yes 10.1
about 47% were in the age group of 25 - 34, while 35% were in the age group of 35+ years. Majority (50%) of FSWs started commercial sex work before 25 years about 50% reported a duration of >5 years of sex work, While half of the FSWs reported that their volume of clients was >10 per week.
About 42% of FSWs were literates and 56% were married and staying with their family. Majority of FSWs had regular unpaid partners (72.8%) and regular clients (83.3%). Majority of the FSWs (81%) reported that they were using condom consistently with occasional clients, about 17.2% reported that they wanted to use condom but could not use due to various reasons and very few (7.7%) reported had sex during last travel. About 47% of FSWs were carrying condom at the time of survey, while 61% reported that they obtained the condom from peer educator. About 33% of FSWs reported the history of having any STI (NG, CT, and Syphilis), while 10.1% were currently suffering from STIs. Only 1% of the FSWs had correct knowledge on HIV. While majority of FSWs (73.5%) reportedly undergone HIV testing, 11.4% of them were HIV positive.
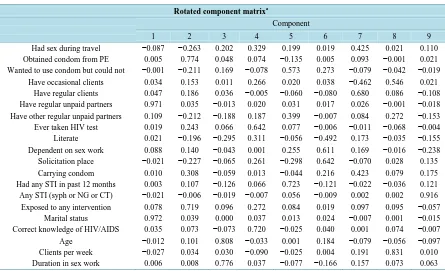
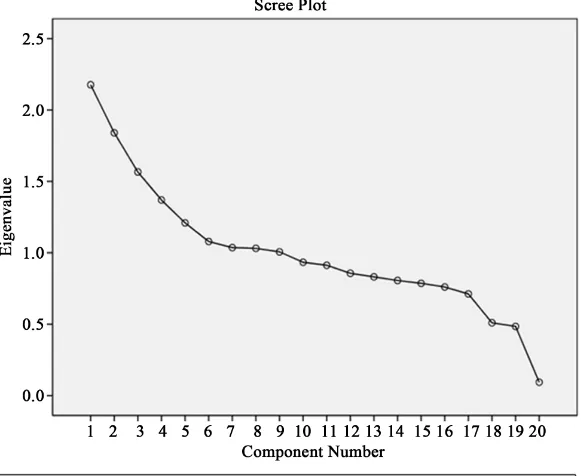
[image:5.595.92.537.436.707.2]Analysis reveals that nine components for high risk population were extracted by factor analysis using Prin-cipal Component Analysis with varimax rotation for demographic, socioeconomic and behavioral variables (Table 2). These nine components (factors) in the initial solution have an Eigen value over 1, and they account for about 62% of the observed variation in the behavioral pattern among female sex workers. The parallel line to horizontal at Eigen value equaling to 1 in scree plot showed that nine factors will be extracted for this population (Figure 1). The first factor, which accounted for 10.9% of the total variance among the female sex workers was labeled as having unpaid regular partners. High factor loading observed for those FSWs who are either married or having a regular unpaid male partner characterized these factors. The second factor explained 9.2% of the to-tal variance and was labeled as exposure to intervention (exposed to any type of intervention and obtained con-dom from peer educator employed by the NGOs working in that area). The third factor which accounted for 7.8% of the total variance was characterized by the age of the FSW and duration in sex work was labeled as age & duration of sex work. The fourth factor explained 6.8% of the total variance was done labeled as correct know-ledge of HIV/AIDS and getting HIV testing done voluntarily. The fifth factor accounted for 6.0% of the total variance and characterized having any STIs for the past 12 months and wanted to use condom but could not use and it was labeled as suffering from STIs. The sixth factor explained 5.4% of the total variance and was labeled as dependency (majorly depend up on sex work and the place of solicitation). The seventh factor accounted for 5.2% of the total variance and was characterized by single variable namely having regular clients who pay every
Table 2.Rotated component matrix for socio-demographic, behavioral and biological parameters.
Rotated component matrixa
Component
1 2 3 4 5 6 7 8 9
Had sex during travel −0.087 −0.263 0.202 0.329 0.199 0.019 0.425 0.021 0.110 Obtained condom from PE 0.005 0.774 0.048 0.074 −0.135 0.005 0.093 −0.001 0.021 Wanted to use condom but could not −0.001 −0.211 0.169 −0.078 0.573 0.273 −0.079 −0.042 −0.019
Have occasional clients 0.034 0.153 0.011 0.266 0.020 0.038 −0.462 0.546 0.021 Have regular clients 0.047 0.186 0.036 −0.005 −0.060 −0.080 0.680 0.086 −0.108 Have regular unpaid partners 0.971 0.035 −0.013 0.020 0.031 0.017 0.026 −0.001 −0.018 Have other regular unpaid partners 0.109 −0.212 −0.188 0.187 0.399 −0.007 0.084 0.272 −0.153 Ever taken HIV test 0.019 0.243 0.066 0.642 0.077 −0.006 −0.011 −0.068 −0.004 Literate 0.021 −0.196 −0.295 0.311 −0.056 −0.492 0.173 −0.035 −0.155 Dependent on sex work 0.088 0.140 −0.043 0.001 0.255 0.611 0.169 −0.016 −0.238 Solicitation place −0.021 −0.227 −0.065 0.261 −0.298 0.642 −0.070 0.028 0.135 Carrying condom 0.010 0.308 −0.059 0.013 −0.044 0.216 0.423 0.079 0.175 Had any STI in past 12 months 0.003 0.107 −0.126 0.066 0.723 −0.121 −0.022 −0.036 0.121 Any STI (syph or NG or CT) −0.021 −0.006 −0.019 −0.007 0.056 −0.009 0.002 0.002 0.916 Exposed to any intervention 0.078 0.719 0.096 0.272 0.084 0.019 0.097 0.095 −0.057
Marital status 0.972 0.039 0.000 0.037 0.013 0.024 −0.007 0.001 −0.015 Correct knowledge of HIV/AIDS 0.035 0.073 −0.073 0.720 −0.025 0.040 0.001 0.074 −0.007 Age −0.012 0.101 0.808 −0.033 0.001 0.184 −0.079 −0.056 −0.097 Clients per week −0.027 0.034 0.030 −0.090 −0.025 0.004 0.191 0.831 0.010 Duration in sex work 0.006 0.008 0.776 0.037 −0.077 −0.166 0.157 0.073 0.063
Figure 1. Socio-demographic, behavioral and biological characteristics of
FSWs.
time which was labeled as regular clients. The eighth factor also explained 5.2% of the total variance and was labeled as having occasional clients (having occasional clients and the volume of these occasional clients per week). The ninth and the last factor explained 5.0% of the total variance and was labeled as positive for STIs (at the time of survey positive).
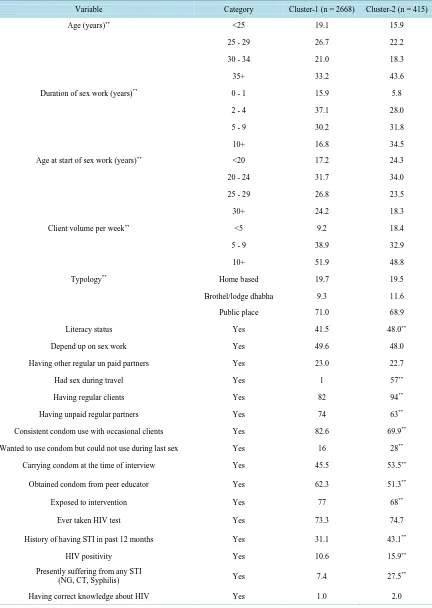
In the present analysis, two clusters were formed with sizeable numbers in each of the cluster for further analysis. Cluster 1 was formed with 2668 subjects and cluster 2 with 415 subjects. The distributions of the FSWs according to their back ground characteristics in these two clusters were tabulated and look for significant difference in the proportions are presented in Table 3. The data revealed significant (p < 0.01) differences in all the variables studied except dependency on sex work, having other regular unpaid partners, ever taken HIV test and having correct knowledge regarding HIV/AIDS between clusters (formed on the basis of behavioral pat-terns). The FSWs belongs to cluster 2 had higher age, about 35% had 10+ years of sex work, 24% had started at early age (<20 years). The literacy status of FSWs of cluster 2 was higher (48% vs 42%) had sex during travel (1% vs 57%), having regular clients (82% vs 94%) and consistent condom use with occasional clients (83% vs 70%) compared to cluster 1. Twenty eight percent of FSWs of cluster 2 reported that they want to use condom but could not use due to various reasons during last sex act, 54% were carrying condom at the time of interview and 51% of respondents were obtained condom from peer educator compared to 62% which is lower than that of FSWs belongs to cluster 1. Exposed to intervention by the FSWs belong to cluster 2 was less (68% against 77%) of cluster 1. Significantly high proportion of FSWs of cluster 2 against of cluster 1 had the history of STIs (43% vs 31%) as well as currently suffering 28% vs 7%). The overall prevalence of HIV was 11.4% and the preva-lence was significantly high (15.9%) among FSWs belongs to cluster 2 compared to cluster 1 (10.6%). These findings indicate that the FSWs of cluster-2 had different socio-demographic, behavioral characteristics which are likely be the risk factors for STIs and HIV positivity and can be named as relatively bad cluster.
[image:6.595.155.449.88.326.2]Table 3. Distribution (%) of FSWs by their background characteristics by clusters 1 & 2.
Variable Category Cluster-1 (n = 2668) Cluster-2 (n = 415)
Age (years)** <25 19.1 15.9
25 - 29 26.7 22.2
30 - 34 21.0 18.3
35+ 33.2 43.6
Duration of sex work (years)** 0 - 1 15.9 5.8
2 - 4 37.1 28.0
5 - 9 30.2 31.8
10+ 16.8 34.5
Age at start of sex work (years)** <20 17.2 24.3
20 - 24 31.7 34.0
25 - 29 26.8 23.5
30+ 24.2 18.3
Client volume per week** <5 9.2 18.4
5 - 9 38.9 32.9
10+ 51.9 48.8
Typology** Home based 19.7 19.5
Brothel/lodge dhabha 9.3 11.6
Public place 71.0 68.9
Literacy status Yes 41.5 48.0**
Depend up on sex work Yes 49.6 48.0
Having other regular un paid partners Yes 23.0 22.7
Had sex during travel Yes 1 57**
Having regular clients Yes 82 94**
Having unpaid regular partners Yes 74 63**
Consistent condom use with occasional clients Yes 82.6 69.9**
Wanted to use condom but could not use during last sex Yes 16 28**
Carrying condom at the time of interview Yes 45.5 53.5**
Obtained condom from peer educator Yes 62.3 51.3**
Exposed to intervention Yes 77 68**
Ever taken HIV test Yes 73.3 74.7
History of having STI in past 12 months Yes 31.1 43.1**
HIV positivity Yes 10.6 15.9**
Presently suffering from any STI
(NG, CT, Syphilis) Yes 7.4 27.5
**
Having correct knowledge about HIV Yes 1.0 2.0
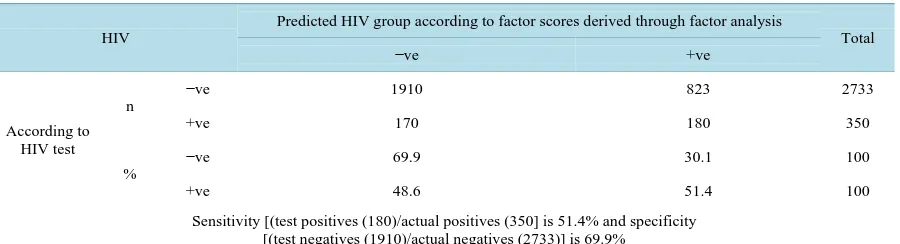
Table 4. Classification of subjects with HIV and without HIV using observed HIV and predicted HIV using scores derived
from factor analysis for demographic & behavioral characteristics.
HIV
Predicted HIV group according to factor scores derived through factor analysis
Total
−ve +ve
According to HIV test
n
−ve 1910 823 2733
+ve 170 180 350
%
−ve 69.9 30.1 100
+ve 48.6 51.4 100
Sensitivity [(test positives (180)/actual positives (350] is 51.4% and specificity [(test negatives (1910)/actual negatives (2733)] is 69.9%
4. Discussion
In India, Andhra Pradesh is one of the high prevalence States with an estimated 16 per cent prevalence among commercial FSWs, ranging from 8 - 41 per cent. The present study reported 11.4% prevalence of HIV varying from district to district. Half of the FSWs in the present study had their first sexual debut at a very young age (<25 years). Similar observations were made in a survey carried out in 2006 [11].
The extent of condom use at with occasional clients reported in the present study was similar to an earlier report [11]. With HIV prevalence being high among FSWs, it is important to promote condom use in all types of sexual relationships, including regular, occasional partners and non commercial partners, since even non commercial partners might have risky sexual behaviours such as unprotected sex with multiple partners.
Analysis of behavioral patterns may offer benefit of summarizing behavior using a small number of factors. Yet, these may be potentially of greater relevance to educate the high risk population on more healthy behavior. Both PCA and cluster analysis are useful approaches for the assessment of behavioral patterns. A commonly-cited criticism of the two techniques is that these involve several subjective—but important—decisions, such as group- ing of demographic and behaviors and possible transformations of variables. PCA involves decisions about the number of components to be retained and their subsequent labeling. Similarly, cluster analysis requires choices about the method of clustering and labeling of clusters. Another disadvantage of these techniques is that they generate patterns based on variation in the variables, with no guarantee that these patterns will be predictive of a particular health outcome. However, the techniques have the advantage that they are empirically derived and are, therefore, not limited by mere a priori knowledge.
In developing countries, studies on identifying behavioral patterns and their relationship with HIV status are scarce. Nine patterns among the variables considered explaining 62% of the total variability.
The first factor, labeled as having unpaid regular partners who accounted for 10.9% of the total variance fol-lowed by exposure to intervention 9.2%, age & duration of sex work 7.8%, knowledge of HIV/AIDS and getting HIV testing done voluntarily 6.0% and about 5.0% each by the other factors.
5. Conclusion
The data allowed identification of patterns defined by factor analysis based on the data collected from FSWs. There exists a strong relationship between specific behavior patterns and HIV status among the high risk popu-lations. These results will be useful for identifying people in the community with risk behaviors, related to HIV/AIDS, which will help the planners to develop suitable interventions for control and prevention of HIV/AIDS.
Acknowledgements
The authors thank the Director, National Institute of Nutrition for his support throughout the study and ac-knowledge the hard work and commitment of the IBBA Team at, Field Division and Microbiology Division. Financial support was provided by the Bill and Melinda Gates Foundation through Avahan, its India AIDS initi-ative.
Conflict of Interest
The authors have no conflict of interests.
References
[1] NACP (2012) Phase III State Fact Sheets. www.naco.gov.in
[2] ANC (2011) HIV Sentinel Surveillance 2010 Bulletin. Strategic Information Management Unit, APSACS, Andhra Pradesh.
[3] Chandrasekaran, P., Dallabetta, G., Loo, V., Mills, S., Saidel, T., Adhikary, R., Alary, M., Lowndes, C.M., Boily, M.C. and Moore, J., Avahan Evaluation Partners (2008) Evaluation Design for Large-Scale HIV Prevention Programmes: The Case of Avahan, the India AIDS Initiative. AIDS, 22, S1-S15.
http://dx.doi.org/10.1097/01.aids.0000343760.70078.89
[4] (2009-10) National Summary Report, Round-2. Integrated Behavioral and Biological Assessment.
[5] Saidel, T., Adhikary, R., Mainkar, M., Dale, M., Loo, V., Rahman, M., et al. (2008) Baseline Integrated Behavioral and Biological Assessment among Most At-Risk Populations in Six High-Prevalent States of India: Design and Im-plementation Challenges. AIDS, 22, S17-S34. http://dx.doi.org/10.1097/01.aids.0000343761.77702.04
[6] (2011) Guidelines for Surveys of Populations at Risk of HIV Infections. Integrated Behavioral and Biological Assess-ment. Define the Study Population. 9.
[7] Mardia, K.V., Kent, J.M. and Bibby, J.M. (1980) Multivariate Analysis. Academic Press, London, 521 p.
[8] Kleinbaum, D.G., Kupper, L.L. and Muller, K.E. (1988) Variable Reduction and Factor Analysis. Applied Regression Analysis and Other Multivariable Methods. PWS Kent Publishing Co., Boston, 595-640.
[9] Aldenderfer, N.S. and Blashfield, R.K. (1984) Cluster Analysis. Sage Publication, Beverly Hills, 7-17.
[10] SPSS Version 19.0, IBM, Armonk.
[11] (2005-7) National Summary Report, Round-1. Integrated Behavioral and Biological Assessment.