© 2018, IRJET | Impact Factor value: 6.171 | ISO 9001:2008 Certified Journal | Page 1498
INDUCTION MOTOR FAULT DIAGNOSTICS USING FUZZY SYSTEM
L.Kanimozhi
1, Manimaran.R
2, T.Rajeshwaran
3, Surijith Bharathi.S
41,2,3,4 Department of Mechatronics Engineering, SNS College Technology, Coimbatore, Tamil Nadu , India
---***---Abstract – Induction motor faults are diagnosed using
Motor Current Signature Analysis (MCSA) since the spectrum of the input stator current signals hold the information of the faults present in the motor. Frequency of the fault signals depend on the slip of the induction motor, thus it depends on the actual speed of the rotating part of the motor. It is efficient to rely on this technique to build a tool for finding the faults. Also this follows the IEEE standards, which are the base of this work. Faults of induction motor are diagnosed at the earliest stage possible since, they are the supreme clients of energy in an industry. Almost 50-60% of the total energy consumption is due to induction motors. This work is focused on a virtual fault simulator and a virtual fault analyzing tool developed using LabVIEW, analog output and input cards. Real-time validation has not been done since the limitations of this virtual tool have to be rectified. Motor Current Signature Analysis (MCSA) is suitable method to diagnose most of the faults without any sensors.
Keywords: Induction motor, Faults detection, MCSA, LabVIEW
1. Introduction:
In both induction and synchronous motors, the AC power supplied to the motor's stator creates a magnetic field that rotates in time with the AC oscillations. Whereas a synchronous motor's rotor turns at the same rate as the stator field, an induction motor's rotor rotates at a slower speed than the stator field. The induction motor stator's magnetic field is therefore changing or rotating relative to the rotor. This induces an opposing current in the induction motor's rotor, in effect the motor's secondary winding, when the latter is short-circuited or closed through external impedance. The rotating magnetic flux induces currents in the windings of the rotor in a manner similar to currents induced in a transformer's secondary winding. The currents in the rotor windings in turn create magnetic fields in the rotor that react against the stator field. Due to Lenz's Law, the direction of the magnetic field created will be such as to oppose the change in current through the rotor windings. The cause of induced current in the rotor windings is the rotating stator magnetic field, so to oppose the change in rotor-winding currents the rotor will start to rotate in the direction of the rotating stator magnetic field. The rotor accelerates until the magnitude of induced rotor current and torque balances the applied load. Since rotation at synchronous speed would result in no induced rotor current, an induction motor always operates slower than synchronous speed. The difference, or "slip," between actual
and synchronous speed varies from about 0.5 to 5.0% for standard Design B torque curve induction motors. The induction machine's essential character is that it is created solely by induction instead of being separately excited as in synchronous or DC machines or being self-magnetized as in permanent magnet motors. For rotor currents to be induced, the speed of the physical rotor must be lower than that of the stator's rotating magnetic field (ns); otherwise the magnetic
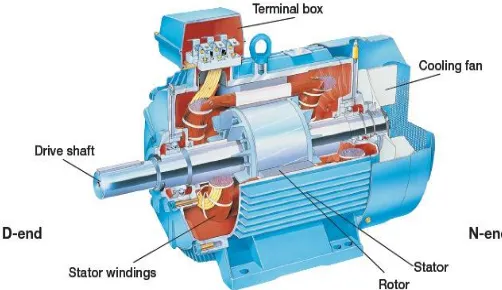
[image:1.595.308.559.435.580.2]field would not be moving relative to the rotor conductors and no currents would be induced. As the speed of the rotor drops below synchronous speed, the rotation rate of the magnetic field in the rotor increases, inducing more current in the windings and creating more torque. The ratio between the rotation rate of the magnetic field induced in the rotor and the rotation rate of the stator's rotating field is called slip. Under load, the speed drops and the slip increases enough to create sufficient torque to turn the load. For this reason, induction motors are sometimes referred to as asynchronous motors. Induction motor can be used as an induction generator, or it can be unrolled to form a linear induction motor which can directly generate linear motion. Induction motor cut way view as shown in Figure No: 1.1
Figure No.1.1 Induction Motor Cut Way view
Synchronous speed
An AC motor's synchronous speed, ns, is the rotation
rate of the stator's magnetic field, which is expressed in revolutions per minute as
Ns = 120 x f / p (Rpm)
Where f is the motor supply's frequency in hertz and p is the number of magnetic poles. That is, for a six-pole three-phase motor with three pole-pairs set 120° apart, p equals 6 and Ns
© 2018, IRJET | Impact Factor value: 6.171 | ISO 9001:2008 Certified Journal | Page 1499
2. Types of Fault in Induction Motor:
Faults in induction motor commonly categorized into two types namely electrical and mechanical faults. Electrical fault are occur due to problems occurring in winding and sometimes it related to rotor problems. Mechanical faults are occurring due to air gap eccentricity, shaft misalignment, and load faults. Faults in induction motor commonly due above faults are bearing faults, Air gap eccentricity, Short turn windings, Rotor faults, unbalanced supply voltage, Load torque fluctuation.
These faults can analyzed using various techniques such as vibration monitoring ,thermal monitoring, acoustic monitoring but problem defining that it will be working using sensors and it restricted to use real time system due to cost effective of sensors. The above types of faults such as bearing, the stator or armature faults, the broken rotor bar and end ring faults of induction machines and the eccentricity-related faults are the most prevalent ones and thus demand special attention. These faults produce one or more of the symptoms as follows:
Unbalanced air-gap voltages and line currents;
Increased torque pulsations;
Decreased average torque;
Increased losses and reduction in efficiency;
Excessive heating.
3. Current Signal Analysis:
The ‘Current Signature Analysis’ is a technique that is based on current monitoring of induction motor ; therefore it is not very expensive. The current signature analysis uses the current spectrum of the machine for locating characteristic fault frequencies. When a fault is present, the frequency spectrum of the line current becomes different from healthy motor. Such a fault modulates the air-gap and produces rotating frequency harmonics in the self and mutual inductances of the machine.
Signature analysis is the procedure of acquiring the motor current and voltage signals, performing signal conditioning and analyzing the derived signals to identify the various faults. Motor current acts as an excellent transducer for detecting fault in the motor. Spectrum analysis of the motor's current and voltage signals can hence detect various faults without disturbing its operation.
4. Faults Simulator:
Faults simulator is developed with user inputs such as amplitude and selection of faults [3,4] Addition of user inputs such as amplitude of each faults and peaks detection task is done to enhance the use of the fault simulator. The output of the simulator is fed to the DAQ assistant in LabVIEW. Thus from the card’s adapter (wiring board) inputs are taken and fed to analog input card. The communication is initially tested using an oscilloscope such
[image:2.595.312.555.141.262.2] [image:2.595.310.556.448.600.2]that the signals generated using the simulator is acquired properly. It is first developed with Matlab and reproduced in LabVIEW. The functional block diagram of the simulator developed in Matlab is shown in Figure No.1.2
Figure No.1.2 Functional block diagram of Simulator
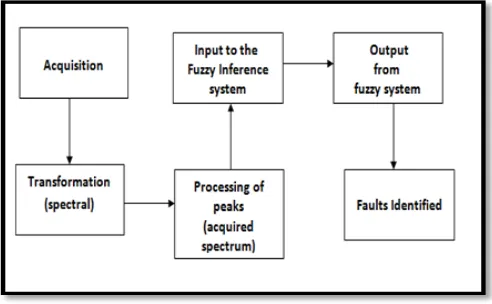
5. Faults Analyzer:
Inputs through PCI-1716 are processed to diagnose the fault present in the induction motor. Fault analyzer acquires the signal and performs spectral transformation for the same. After the transformation the significant peaks of the acquired signal is taken as a separate data, which is processed and fed to the fuzzy inference system. Fuzzy inference system analyzes the data according to the rule base and gives the final output based on the fault type. The processing of data is the key part of the fault analyzer after which the fuzzy inference system.
Figure No.1.3 Fault Analyzer Processes
6. Installation and Interfacing of DAQ Cards:
© 2018, IRJET | Impact Factor value: 6.171 | ISO 9001:2008 Certified Journal | Page 1500 Advantech cards. This is done by making proper connection
using the wiring boards, function generator and oscilloscope.
The connections are made using recommended adapters and wiring boards. As they are the vital parts for the working of the system they are set properly without any errors. These wiring boards are connected to each other such that the output from one card could be given as an input to the other. Data acquisition is another major part of the system, as the major part of system could be completed only by setting proper communication between the faults simulator and the controller. This could be done by proper selection of the card that is compatible with the software tool that is chosen for the development of the system. This can be done according the system requirements and the application specified.
6.1 PCL-726:
The PCL-726 provides 6-channel analog outputs, 16-channel digital inputs and 16-channel digital outputs add-on card for the IBM Personal Computer and compatible computers. It is designed for industrial control applications requiring analog outputs voltage and current with 12-bit resolution in rugged environment.
In addition to the 6 analog outputs, the PCL-726 has 16 digital inputs and 16 digital outputs, all of the digital channels are TTL compatible. The PCLD-782 (16-bit Isolation digital input board) and PCLD-785 (16-bit relay output board) are designed for going with the digital input and output connection.
6.2 PCI-1710
The PCI-1710/1710HG features an automatic channel/gain scanning circuit. The circuit uses software, controls multiplexer switching during sampling. The on-board SRAM stores different gain values and configuration for each channel. Thisdesign lets you perform multi-channel high-speed sampling (up to 100 kHz) with different gains for each channel with free combination of single-ended and differential inputs.The PCI-1710/1710HG has an on-board FIFO buffer which can store up to 4K A/D samples. The PCI-1710/1710HG generates an interrupt when the FIFO is half full. This feature provides continuous high- speed data transfer and more predictable performance on Windows systems. The PCI-1710/1710HG provides a programmable counter for generating a pacer trigger for the A/D conversion. The counter chip is an 82C54 or equivalent, which includes three 16-bit counters on a 10 MHz clock. One counter is used as an event counter for counting events coming from the input channels.
7 . Fuzzy Inference System:
Fuzzy inference system is another important part of this fault analyzer. The data acquire has to be processed according to the requirements of the inference system. The number of input variables and their membership functions
are taken according to the data collected for individual faults using separate simulators
7.1.1 Peak Frequency:
For every 1 percent change in slip, the difference between the lower and higher frequency of peaks changes as shown in Table No.1.7.
Faults Difference
Change(HZ)
Range(HZ)
[image:3.595.314.550.479.711.2]Rotor Bar 4 4-40 Load Torque 0.5 45-49.5 Short Run 0.5 22.5-24.75 Air Gap 0.005 0.45-0.495 Bearing Outer 0.016 1.44-1.584 Inner 0.024 2.16-2.376
Table No.1.7 Frequency Changes for faults
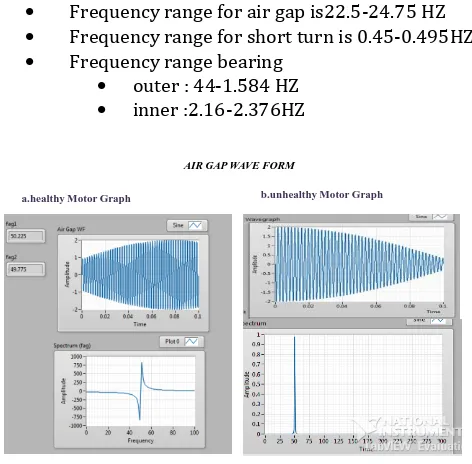
7.1.2 Analyzing Faults Frequency Range for Induction Motor:
The peaks are obtained for each of the induction motor faults that are generated using the simulator. The spectrum differs for each faults of air gap eccentricity, bearing fault, short turn fault thus it is possible to diagnosis the faults in induction motorand the healthy motor frequency should follow as mentioned below
Frequency range for air gap is22.5-24.75 HZ
Frequency range for short turn is 0.45-0.495HZ
Frequency range bearing
outer : 44-1.584 HZ
inner :2.16-2.376HZ
AIR GAP WAVE FORM
a.healthy Motor Graph b.unhealthy Motor Graph
Figure No.1.8 Air Gap Eccentricity Fault
© 2018, IRJET | Impact Factor value: 6.171 | ISO 9001:2008 Certified Journal | Page 1501
BEARING WAVEFORMS
[image:4.595.304.563.102.340.2]a. healthy motor Graph b.un healthy motor graph
Figure No.1.9 Bearing Fault
a. without fault waveform for Bearing
b. with fault waveform for Bearing
SHORT TURN WAVEFORMS b. unhealthymotor graph a. healthy motor graph
Figure no.1.10 Short Turn Faults
a. without fault waveform for short turn b. with fault waveform for short turn
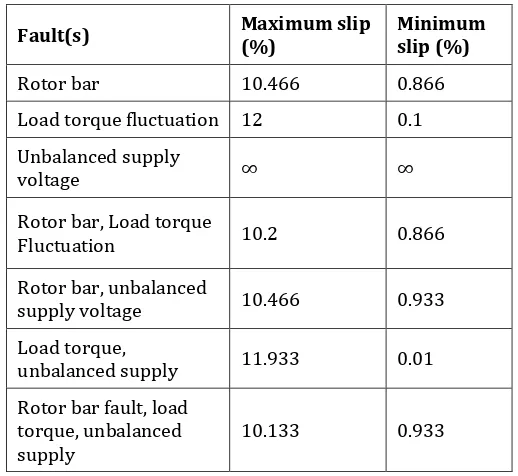
8. Working of System to Diagnosis of Rotor Bar Fault, Load Torque Fluctuation and Unbalanced Supply Voltage:
[image:4.595.40.264.105.255.2]The system was designed for a slip range of about 1-10%. On testing the system responded with some good results even beyond this limit. The Figure No 1.12 shows the faults, combinations of faults and their limits of slip to which the system responds well. Unbalanced supply voltage could be detected for all possible slip, as there are no characteristic frequency bands for that. The frequency or the peak to indicate its presence will be in multiples of fifty. These results are inferred using the faults simulator and tabulated in Table No 1.11.
Table No. 1.11 Slip observed
Fault(s) Maximum slip (%) Minimum slip (%)
Rotor bar 10.466 0.866 Load torque fluctuation 12 0.1 Unbalanced supply
voltage ∞ ∞
Rotor bar, Load torque
Fluctuation 10.2 0.866
Rotor bar, unbalanced
supply voltage 10.466 0.933 Load torque,
unbalanced supply 11.933 0.01 Rotor bar fault, load
torque, unbalanced
supply 10.133 0.933
The fault simulator is fed with the frequency spectrum expressions of the major faults of induction motor, which is the basic step for the development of simulator. The principle behind this simulator is that, it generates noise signals using the spectrum expressions. This is then added to the input signal, thus the signals of induction motor faults are created. These signals are subjected to fast Fourier transform and spectral outputs of the faults are taken as output of the simulator.
9. Future Scope:
[image:4.595.42.262.343.488.2]© 2018, IRJET | Impact Factor value: 6.171 | ISO 9001:2008 Certified Journal | Page 1502
10. Conclusion:
A new logical approach for the detection of induction motor faults was presented. Systematic flow of the approach was explained with data collected using virtual simulator developed for individual faults of induction motor. Results showed that the system could work well for faults with the specified limitations. Based on this systematic approach the fault such as air gap eccentricity fault, bearing fault , short turn fault ,rotor bar fault , load torque fluctuation, unbalanced supply voltage were diagnoized and compared with the standard analysis. This system found to work even beyond limits for certain faults provided they are not affected by some other factors such as load and noise. As the faults were simulated virtually the developed system provided better results while testing.
11. References:
1. Bouzida.,, Ahcène (2011) 'Fault diagnosis in industrial induction machines through discrete wavelet transform' Industrial Electronics, IEEE Transactions vol.58, No.5, pp. 4385-4395.
2. Campos-Delgado, Daniel U., and Diego Rivelino, Espinoza-Trejo (2011) “An observer-based diagnosis scheme for single and simultaneous open-switch faults in induction motor drives” Industrial Electronics, IEEE Transactions vol.58, No.2, pp. 671-679.
3. Mehala N. and Dahiya R. (2007)”Motor Current Signature Analysis and its Applications in Induction Motor Fault Diagnosis”, International Journal of Systems Applications, Engineering and Development, Vol. 2, No. 1, pp. 29-35.
4. Messaoudi M. and Sbita L. (2010) “Multiple Faults Diagnosis in Induction Motor, Using the MCSA Method”, International Journal of Signal and Image Processing, Vol.5, No.3, pp. 190-195.
5. Nandi S. Toliyat H. A.and Li X. (2005) “Condition Monitoring and Fault Diagnosis of Electrical Motors- A Review”, IEEE Transactions on Energy Conversion, Vol. 20, No. 4, pp. 23-35.
6. Razik H. and Silva E. R. (2009) ‘A novel monitoring of load level and broken bar fault severity applied to squirrel cage induction motor using a genetic algorithm’, IEEE transaction on industrial electronics, Vol.56, No.11, pp. 4615-4626.