© 2017, IRJET | Impact Factor value: 5.181 | ISO 9001:2008 Certified Journal | Page 2107
An Investigation in Performance Enhancement of Induced Draft
Counter Flow Wet Cooling Tower
Manoj Kumar Chopra
1, Rahul Kumar
21
Vice Principal, Dean Academic & Head, Dept. Of Mechanical Engineering,
R.K.D.F Institute of Science & Technology, Bhopal, M.P., India
2
P.G. Scholar, Dept. Of Mechanical Engineering,
R.K.D.F Institute of Science & Technology, Bhopal, M.P., India
---***---Abstract –
Cooling towers are one of the biggest heat and mass transfer devices used to transfer process waste heat to the atmosphere. Cooling towers make use of evaporation whereby some of the water is evaporated into a moving air stream and subsequently discharged into the atmosphere. As a result, the remainder of the water is cooled down significantly. The process parameters such as inlet air rate, water flow rate and fills porosity have more influence on Thermal performance of cooling tower. The Temperature of outlet water is maintained nearest to inlet air wet bulb temperature to obtain the best Thermal Performance of cooling tower. So current work is to obtain and maintaining outlet water Temperature nearest to inlet air wet bulb temperature. The Taguchi method is used to perform screening of experiments and to identify the important significant process parameters affecting outlet temperature of water. The prefix parameter (inlet water flow rate, inlet air rate and fill porosity) are used as input variable and the output parameter is outlet temperature of hot water. Three different models are made in Creo software and CFX analysis is carried out in ANSYS 12.1.Portable Minitab 16. Software is used for Taguchi analysis. Result obtained from the Taguchi analysis shows that which combination of design parameter gives the minimum temperature of outlet hot water. The exercise has been carried out at DOLPHIN PLAST PVT. LTD. at Kathwada GIDC, Ahmedabad.Key Words: Investigation, Performance, Counter Flow,
Cooling Tower, Induced Draft
1. INTRODUCTION
1.1 Blow Moulding Process
Blow molding is a manufacturing process by which hollow plastic parts are formed. In general, there are three main types of blow molding: extrusion blow molding, injection blow molding, and stretch blow molding. The blow molding process begins with melting down the plastic and forming it into a parison. The parison is a tube-like piece of plasticwith a hole in one end in which compressed air can pass through.
The parison is then clamped into a mold and air is pumped into it. The air pressure then pushes theplastic out to match
the mold. Once the plastic has cooled and hardened the mold opens up and the part is ejected.
1.2 Cooling Tower
Cooling towers are heat exchangers which are used to dissipate large heat loads to the atmosphere. It is equipment used to reduce the temperature of a water stream by extracting heat from water and emitting it to the atmosphere. They are used in a variety such as power generation and refrigeration. Cooling towers are designed for industrial plants for various purposes and sizes to provide cool water. Typically, a condenser of a power plant and or of heating ventilation, and air conditioning (HVAC) system is cooled by water.
1.3 Induced Draft
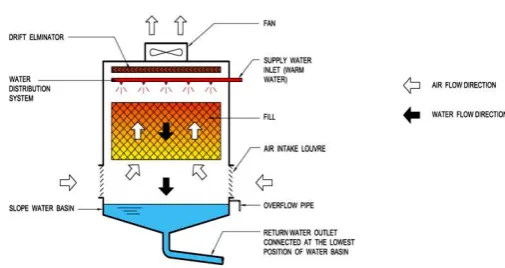
An induced draft mechanical draft tower is a draw-through arrangement, where a fan located at the discharge end pulls air through the tower. The fan induces hot moist air out the discharge. This produces low entering and high exiting air velocities, reducing the possibility of recirculation in which discharged air flows back into the air intake.
[image:1.595.305.558.557.691.2]1.4 Counter Flow Cooling Tower
Fig. -1: Counter Flow Cooling Tower
© 2017, IRJET | Impact Factor value: 5.181 | ISO 9001:2008 Certified Journal | Page 2108 through pressurized nozzles and flows downward through
the fill, opposite to the air flow.
1.5 Cooling Tower Performance
The important parameters, from the point of determining the performance of cooling towers, are:
1. "Range" is the difference between the cooling tower water inlet and outlet temperature.
2. "Approach" is the difference between the cooling tower outlet cold water temperature and ambient wet bulb temperature.
3. Cooling tower effectiveness (in percentage) is the ratio of range, to the ideal range, i.e., difference between cooling water inlet temperature and ambient wet bulb temperature, or in other words it is = Range / (Range + Approach).
4. Cooling capacity is the heat rejected in kCal/hr or TR, given as product of mass flow rate of water, specific heat and temperature difference.
5. Evaporation loss is the water quantity evaporated for cooling duty.
*Evaporation Loss (m3/hr) = 0.00085 x 1.8 x circulation rate (m3/hr) x (T1-T2) T1-T2 = Temp. difference between inlet and outlet water.
6. Cycles of concentration (C.O.C) is the ratio of dissolved solids in circulating water to the dissolved solids in makeup water.
7. Blow down losses depends upon cycles of concentration and the evaporation losses and is given by relation
:
Blow Down = Evaporation Loss / (C.O.C. – 1)
8.
Liquid/Gas (L/G) ratio, of a cooling tower is the ratio between the water and the air mass flow rates. Against design values, seasonal variations require adjustment and tuning of water and air flow rates to get the best cooling tower effectiveness through measures like water box loading changes, blade angle adjustments. Thermodynamics also dictate that the heat removed from the water must be equal to the heat absorbed by the surrounding air.2. METHODOLOGY
2.1 Design Calculation (Reference 3)
2.1.1 Cooling Tower Approach (CTA)
CTA: Cooling Tower Outlet Temperature – WBT CTA: 35 – 30
CTA: 5°C
2.1.2 Cooling Tower Range (CTR)
CTR: T1 – T2 CTR: 42 - 35 CTR: 7°C
Now, Mass of water circulated in cooling tower
Mw1= Volume of circulating water x Mass density of water Mw1 = 10.8 x 1000
Mw1 = 10800 Kg / hr
2.1.3 Heat Loss by Water (HL)
HL: Mw1x Cpw x (T1 – T2) HL: 10800 x 4.186 x (42 - 35) HL: 316461.6 KJ / hr
2.1.4 Volume of Air Required (V)
2.1.5 Heat Gain by Air (HG)
2.1.6 Mass of Air Required (M
a)
© 2017, IRJET | Impact Factor value: 5.181 | ISO 9001:2008 Certified Journal | Page 2109
2.1.7 The Quantity of Make-Up Water
Mmak = 99.85 Kg / hr
Now, taking Evaporating loss in calculation Mmak = 99.85 x [1 + (1.44 / 100)]
Mmak = 101.28 Kg / hr Mmak = 101.28 / 60 Mmak = 1.68 Kg / min
2.2.1 Cooling Tower Characteristics
Merkel gives the cooling tower characteristic equation as
1 2
w1 1 2 3 4
T - T
KaV
1
1
1
1
=
×
+
+
+
m
4
Δh
Δh
Δh
Δh
……. (a)Where,
K = Mass transfer co-efficient (Kg / hr m2) a = Constant area (m2)
V = Active cooling volume (m3) mw1 = Mass of water (Kg / hr) T1 = Hot water temperature (0 C) T2 = Cold water temperature (0 C) Δh1 = Value of Hw - Ha at T2 + 0.1 (T1 – T2) Δh2 = Value of Hw - Ha at T2 + 0.4 (T1 – T2) Δh3 = Value of Hw - Ha at T1 - 0.4 (T1 – T2) Δh4 = Value of Hw - Ha at T1 - 0.1 (T1 – T2) Calculation for Δh1
= T2 + 0.1 (T1 – T2) = 35 + 0.1 (42 - 35) = 35.700 C
Value of Hw at 35.700 C is 149.47 KJ / Kg Value of Ha at 35.700 C is 103.12 KJ / Kg Δh1 =Hw - Ha
Δh1 = 149.47 – 103.12 Δh1 = 46.35 KJ / Kg Calculation for Δh2 = T2 + 0.4 (T1 – T2) = 35 + 0.4 (42 - 35) = 37.800 C
Value of Hw at 37.800 C is 158.26 KJ / Kg Value of Ha at 37.800 C is 113.9 KJ / Kg Δh2 =Hw - Ha
Δh2 = 158.26 – 113.9 Δh2 = 44.36 KJ / Kg
Calculation for Δh3 = T1 - 0.4 (T1 – T2) = 42 – 0.4 (42 - 35) = 39.200 C
Value of Hw at 39.200 C is 164.14 KJ / Kg Value of Ha at 39.200 C is 121.63 KJ / Kg Δh3 =Hw - Ha
Δh3 = 164.14 – 121.63 Δh3 = 42.51 KJ / Kg Calculation for Δh4 = T1 - 0.1 (T1 – T2) = 42 – 0.1 (42 - 35) = 41.300 C
Value of Hw at 41.300 C is 172.86 KJ / Kg Value of Ha at 41.300 C is 134.13 KJ / Kg Δh4 =Hw - Ha
Δh4 = 172.86 – 134.13 Δh4 = 38.73 KJ / Kg
Now put all above value in equation (a) = x [ + + + ] = 0.1640
2.2.2 Effectiveness of Cooling Tower
η = 58.33%
2.2.3 Different Types of Losses Generated in
Cooling Tower
2.2.4 Drift Losses (DL)
Drift losses are generally taken as 0.10 % (Perrys chemical engineering hand book) of circulating water.
DL = 0.10 x mw1 / 100 DL = 0.10 x 10800 / 100 DL = 10.8 Kg / hr
2.2.5 Windage Losses (WL)
© 2017, IRJET | Impact Factor value: 5.181 | ISO 9001:2008 Certified Journal | Page 2110 WL = 0.005 x 10800
WL = 54 Kg / hr
2.2.6 Evaporation Losses (EL)
Evaporation losses are generally taken as 0.00085(Perrys chemical engineering hand book) of circulating water. EL = 0.00085 x mw1 x (T1 – T2)
EL = 0.00085 x 10800 x (42 - 35) EL = 64.26 Kg / hr
Water balance equation for cooling tower is M = WL + EL + DL
M = 54 + 64.26 + 10.8 M = 129.06 Kg / hr
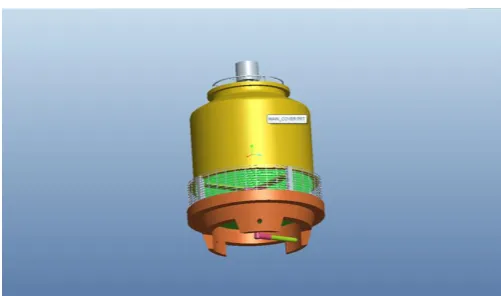
2.3.1 Modeling of Cooling Tower
For modeling of cooling tower Creo software is used. Creo is computer graphics software for modeling various mechanical designs for performing related design and manufacturing operations. The system uses a 3D solid modeling system as the core, and applies the feature base parametric modeling method. In short Creo is a feature based parametric solid modeling system with many extended design and manufacturing application.
2.3.2 Assembly of Cooling Tower
Fig. -2: Assembly of Cooling Tower
2.3.3 Assembly of Cooling Tower
[image:4.595.308.561.121.223.2]Here the CFD analysis of cooling tower is done in ANSYS12.1 work bench. Temperature distribution of cooling tower is achieved by CFD analysis in ANSYS12.1. Finite Element Analysis is a mathematical representation of a physical system comprising a part/assembly (model), material properties, and applicable boundary conditions{collectively referred to as pre-processing}, the solution of that mathematical representation {solver}, and the study of results of that solution {post-processing}.
Table -1: Input Conditions
Sr. No. Input Condition Value
1 Inlet temperature of hot water 315 K 2 Inlet velocity of air 3.2 m/s 3 Inlet air pressure 1.013 bar 4 Inlet wet bulb temperature of air 303 K
5 Fills Porosity 55 %
6 Hot water flow rate 3.0 kg/s
2.3.4 Comparison between Practical Reading and
Ansys – CFD Analysis
[image:4.595.307.569.333.398.2]The practical value of Inlet and Outlet Hot Water Temperature are showing below:
Table -2: Comparison between practical and Ansys reading (CFD)
Inlet Hot Water Temperature
Outlet Hot Water Temperature Practical Reading 315 k 308K
Ansys Result 315k 307.4K
This value is taken by temperature probe at Specified locations. From Ansys result and practical reading we can conclude that ansys result is in good agreement with the practical reading. This solid model reflects the practical set up and can be used further for different analysis.
2.3.5 Selection of Array
[image:4.595.35.286.458.606.2]In this work three parameter and three levels are used so L9 array is used for optimization. L9 array is shown below with parameter inlet water flow rate (2.0Kg/s, 2.5Kg/s, 3.0Kg/s), inlet Air rate (2.8m/s, 3.2m/s, 3.6m/s) and Fills porosity (45%, 55%, and 65%)
Table -3: Selected Array Experiment Inlet Water
Flow Rate Kg/s
Inlet Air Rate
m/s Fills Porosity %
1 2.0 2.8 45
2 2.0 3.2 55
3 2.0 3.6 65
4 2.5 2.8 55
5 2.5 3.2 65
6 2.5 3.6 45
7 3.0 2.8 65
8
3.0
3.2
45
© 2017, IRJET | Impact Factor value: 5.181 | ISO 9001:2008 Certified Journal | Page 2111
2.3.6 Analysis Performed According to Taguchi
Array (L
9)
In this work taguchi method is applied for optimization. In taguchi three parameter and three levels are used. So different model of cooling tower are made in Creo and nine analyses performed in ANSYS 12.1 WORKBENCH.
3. RESULT AND DISCUSSION
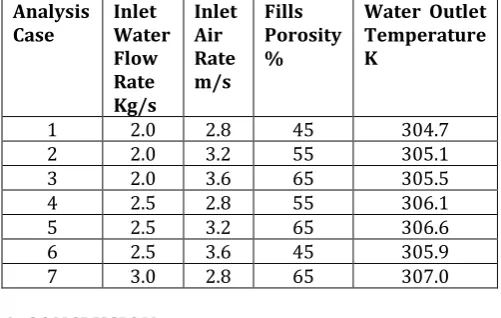
3.1 Result of Ansys
[image:5.595.35.286.296.455.2]In ANSYS 12.1 CFD analysis are performed according to taguchi L9 array and results obtained are listed in Table. Table - 4: Result of Ansys
Analysis
Case Inlet Water Flow Rate Kg/s
Inlet Air Rate m/s
Fills Porosity %
Water Outlet Temperature K
1 2.0 2.8 45 304.7
2 2.0 3.2 55 305.1
3 2.0 3.6 65 305.5
4 2.5 2.8 55 306.1
5 2.5 3.2 65 306.6
6 2.5 3.6 45 305.9
7 3.0 2.8 65 307.0
4. CONCLUSION
In addition it analytical approach, Creo, Ansys and Portable Minitab has been used. The below mentioned conclusion has been made as under:
(1) The optimum condition which gives the maximum effectiveness in counter flow FRP cooling tower was obtained with inlet water flow rate kept at level (2 kg/s), air flow rate kept at (2.8 m/s) and fill porosity at level (45%).
(3) ANSYS12.1 and MINITAB 16.1 software gives the output as Hot water outlet temperature contour for different parameters at different conditions. It reduces time for calculations.
(4) Improvement in Effectiveness of counter flow FRP cooling tower is 0.22 after taking inlet water flow rate 2.0 kg/s, inlet air rate 2.8 m/s and fill porosity 45%. (5) Cooling tower Variable Frequency Drives typically
control the fan motor based on an analog input signal from either a temperature sensor, which senses the outlet water temperature. Variable Frequency Drives reduce energy use by reducing the fan speed to match the rejected heat load requirement. For example, VFDs can reduce fan energy consumption by about 80% when operating at half speed.
(6) The results clearly demonstrate that with an increase in inlet water mass flow rate for the same fill porosity, the surface area required both for convection and evaporation is reduced, resulting in higher water outlet temperatures and reduced heat transfer rates.
REFERENCES
[1] Kloppers, J.C., and Kroger, D.G. A critical investigation into the heat and mass transfer analysis of counter flow wet cooling towers, International Journal of Heat and Mass Transfer, 48 (2005), 765–777.
[2] Ronak Sha. Thermal design of cooling tower, International Journal of Advanced Engineering Research and Studies, 1 (2012), 26-29.
[3] Ali Reza Keyvani Boroujeni. Evaluation of FRP (fiberglass reinforced plastic) and RC (rapid cooling) cooling tower, Journal of Mechanical Engineering Research, 3 (2011), 152-156.
[4] Panjeshahi, Mohammad Hassan. A Comprehensive Approach to an Optimum Design and Simulation Model of a Mechanical Draft Wet Cooling Tower, Chemical journal, 29 (2010), 1-12.
[5] A. Klimanek. A 3D CFD model of a natural draft wet-cooling tower, European conference on computational mechanics, (2010), 1-2.
[6] S.V. Bedekar, P. Nithiarasu and K.N. Seetharamu. Experimental Investigation of the Performance of a Counter-Flow, Packed-Bed Mechanical Cooling Tower Cooling tower. Energy, 23 (1998), 943-947.
[7] Dr. Jalal M. Jalil, Dr. Talib. CFD Prediction of Forced Draft Counter-Flow Cooling Tower Performance, Eng. and Tech. Journal, 28(2010), 1-18.0
[8] M. Lemouari, Thermal performances investigation of a wet cooling tower, Applied Thermal Engineering, 27 (2007), 902–909.