© 2017, IRJET | Impact Factor value: 5.181 | ISO 9001:2008 Certified Journal | Page 2937
Effect of TQM Practices on Quality Performance Through
Operating Performance – An Empirical Study
Rinoop V
1, Anu P Anil
2, Dr. Satish K P
31
M.Tech Student, Dept. of Production Engineering, GEC Trichur, Thrissur, Kerala, India
2
PhD Research Scholar, Dept. of Mechanical Engineering, GEC Trichur, Thrissur, Kerala, India
3
Professor, Dept. of Production Engineering, GEC Trichur, Thrissur, Kerala, India
---***---Abstract -
Total Quality Management (TQM) is defined as acontinuous effort by the management as well as employees of a particular organization to ensure long term customer loyalty and customer satisfaction. In the recent days TQM has generated a substantial amount of interest both among managers and researchers across the globe, but still there is a lack of a clear idea about the effect of TQM practices on Indian Manufacturing Organizations. Previous studies reported mixed results of the relationship between TQM practices and different performances. So this work is an attempt to analyze more precisely and find the relation between individual TQM practices and Quality performance through Operating performance in the Indian context. Based on the Literature study 13 TQM constructs were selected. The empirical data was collected from a survey in Indian manufacturing organizations using a self-administrated questionnaire. The reliability and validity of the practices and performance measures were evaluated. The data was analyzed and hypotheses were tested using structural equation modelling. The study showed that a positive and significant effect on quality performance by TQM practices through operating performance. Some but not all of the categories of TQM practice were particularly strong predictors. Knowledge management, continuous improvement, and customer focus were found to contribute more on quality performance through operating performance in Indian manufacturing organizations.
Key Words: Total quality management, Operating Performance, Customer satisfaction, Multiple regression, Knowledge management
1. INTRODUCTION
In the current world scenario customers are more conscious about quality more than quantity. The meaning of word quality has changed because of the evolution of the world. Many authors defined quality in different aspects. Phil Crosby said quality is conformance to specifications. On the other hand, Joseph Juran said quality is fitness for use. For every organization in order to gain competitive advantage they have to completely satisfy their customers. One happy and satisfied customer brings several new customers along with him on the other hand one disappointed customer will spread bad words and spoil the reputation of the
organization. Total Quality Management (TQM) is defined as a continuous effort by the management as well as employees of a particular organization to ensure long term customer loyalty and customer satisfaction. These days TQM practices are getting attention from management as well as from researchers because it is believed to improve customer satisfaction and is considered as a strategy for improving competitiveness around the world. Based upon the possible benefits TQM has attracted researchers around the world and gone for various studies. But there are mixed results about the relationship between TQM practices and organization’s performance. Some of the studies give positive results (Sim and Killough, 1998; Ittner and Larcker, 1995, 1997; Banker and Porter, 1993; Daniel and Reitsperger, 1992) while some found that there is no significant advantage for using TQM practices (Soltani et al. ,2005; Taylor and Wright, 2003; Sohal and Terziovski, 2000; Terziovski and Samson, 1999). Also number of researches in the Indian context is very few. So there exists a possible scope to identify the relationship between TQM practices and Organization performance. Here in this study Organization performance is measured through operating performance and quality performance. The possibility of an indirect effect on quality performance by operating performance was also evaluated. This will help managers to find out the interdependencies between the core TQM practices and their relationships with operating performance and quality performance.
2. LITERATURE REVIEW
2.1 Critical Factors of TQM
© 2017, IRJET | Impact Factor value: 5.181 | ISO 9001:2008 Certified Journal | Page 2938
Malcolm Baldrige National Quality Award (MBNQA, 2004);European Quality Award (EQA, 2004); The Deming Prize ; Kanji Business Excellence Model. These models also help in implementing TQM as well as evaluating their business performance results. The critical factors identified in the past TQM literature are given below
• Leadership and top management commitment • Rewards and recognition
• Quality improvement systems • Continuous improvement • Education and training • Role of quality department • Supplier quality
• Strategic quality planning • Quality policy
• Supplier performance
• Strategic quality management • Corporate quality culture • Customer focus
• SPC usage
• Quality management environment • Team work
• Quality information and analysis • Operational quality planning • Communication
• Quality assurance • Benchmarking
• Measurement and feedback • Quality citizenship
• Employees involvement • Quality information usage • Process management • Process and product design • Employees empowerment • Quality information availability • Product quality and innovation
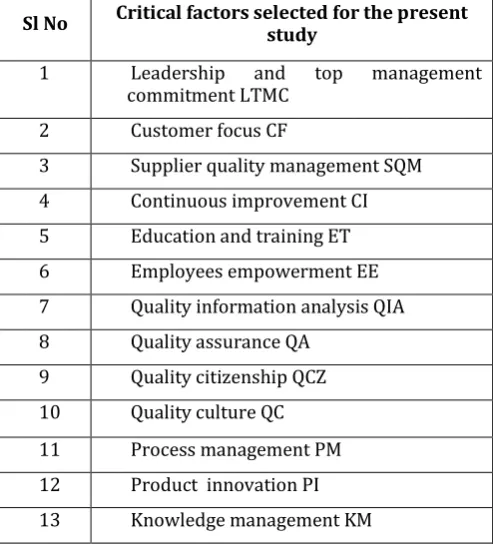
[image:2.595.318.565.136.411.2]Through the comprehensive review of the TQM literature, the present study identified a set of 13 TQM practices and it is shown in Table 1.
Table -1: Critical TQM factors selected for the present study
2.2 Performance Measure Indicators
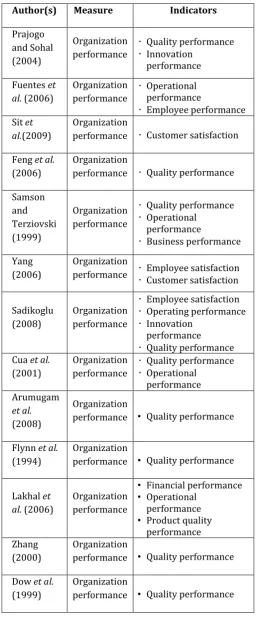
A number of studies have been carried out to find out the positive, non-significant relationships or correlations between TQM practices and various performance measures. A study on these previous researches suggests that there are various performance measure indicators. Some of them are Financial performance (Lakhal et al.,2006), Market performance (Mohrman et al.), innovation performance (Prajogo and Sohal ,2004; Sadikoglu,2008; ) Operating performance (Fuentes et al., 2006; Samson and Terziovski ,1999), Employee performance etc. (Fuentes et al., 2006; Sila ,2007, Zakuan et al. ,2010) . Table 2 shows Performance indicators selected in previous researches.
In this study, organization performance was measured through operating performance and quality performance. The intervening effect of operating performance on quality performance was main consideration of the study.
Sl No Critical factors selected for the present study
1 Leadership and top management commitment LTMC
2 Customer focus CF
3 Supplier quality management SQM 4 Continuous improvement CI 5 Education and training ET 6 Employees empowerment EE 7 Quality information analysis QIA 8 Quality assurance QA
© 2017, IRJET | Impact Factor value: 5.181 | ISO 9001:2008 Certified Journal | Page 2939
Table -2: Performance indicators selected in previousresearches.
Author(s) Measure Indicators
Prajogo and Sohal (2004)
Organization performance
• Quality performance • Innovation
performance Fuentes et
al. (2006)
Organization performance
• Operational performance
• Employee performance Sit et
al.(2009)
Organization
performance • Customer satisfaction
Feng et al. (2006)
Organization
performance • Quality performance
Samson and Terziovski (1999)
Organization performance
• Quality performance • Operational
performance
• Business performance
Yang (2006)
Organization
performance •• Employee satisfaction Customer satisfaction
Sadikoglu (2008)
Organization performance
• Employee satisfaction • Operating performance • Innovation
performance • Quality performance Cua et al.
(2001)
Organization performance
• Quality performance • Operational
performance Arumugam
et al. (2008)
Organization
performance • Quality performance
Flynn et al. (1994)
Organization
performance • Quality performance
Lakhal et al. (2006)
Organization performance
• Financial performance • Operational
performance • Product quality
performance Zhang
(2000)
Organization
performance • Quality performance
Dow et al. (1999)
Organization
performance • Quality performance
3. RESEARCH FRAME WORK AND PROPOSED
HYPOTHESES
Based on the literature review, a conceptual framework is developed to explore the relationship between identified TQM practices and organization performance. The proposed research framework is shown in figure 1. In this conceptual research framework TQM practices act as independent variable, and performance measures as dependent variable respectively.
Figure -1: Conceptual research framework
In the current study three research hypotheses were developed. They were based on the findings identified in the literature review. The first hypothesis is related to the nature of the direct effect of TQM on quality performance.
H1: TQM practices have direct and positive effects on quality performance.
The second hypothesis is focused on investigating the relationship between TQM practices and the operating performance.
H2: TQM practices have direct and positive effects on operating performance.
The third hypothesis was developed to check the intervening effect of operating performance on quality performance.
H3: TQM practices have indirect and positive effects on quality performance through operating performance.
4. LITERATURE REVIEW
[image:3.595.322.544.234.292.2]© 2017, IRJET | Impact Factor value: 5.181 | ISO 9001:2008 Certified Journal | Page 2940
contacted valid responses obtained were 260. The responserate was 38.24. These data obtained via survey was tabulated using Microsoft Excel. Then the data were analyzed using IBM SPSS statistics software and Structural Equation modeling analysis was done using AMOS 20.0 software.
4.1 Selection of Critical TQM Factors and
Organizational Performance Indicator
This study concentrates mainly on the effect of TQM
practices on quality performance through operating performance of manufacturing organizations in India. From the literature survey relevant 13 TQM practices were identified. Performance indicators selected for organization performance evaluation was quality performance and operating performance. The Sub items for performance indicators were also identified.4.2 Survey Instrument
Based on past TQM literatures (Bayraktar, E et.al,2008 ; Brah S.A et al, 2000 ; Saravanan, R. and Rao, K.S.P.,2007 ; Salaheldin, S.I, 2009) a self-administered structured instrument was designed. Modifications for instrument were done by consulting with academicians and quality experts. Initially a pilot survey was conducted and validated the instrument. The instrument developed was divided into three sections. First section deals with company profile, second section consisting of TQM practices and third section evaluates the performance of the company. A seven-point Likert scale, with 1 (Strongly disagree), 2 (Disagree), 3 (Somewhat disagree), 4 (Neutral), 5 (Somewhat agree), 6 (Agree), 7 (Strongly agree) was used in the instrument.
4.3 Data Processing and Analysis
4.3.1 Reliability Analysis
Reliability refers to the consistency of measure. The responses obtained through survey were assigned numeric codes and those data were entered into a SPSS Statistics (version 20.0) for statistical analyses. Reliability tests were conducted to examine the level of bias among the questionnaire responses. Reliability tests were performed separately for the items of each TQM practice (13 independent variables) and dependent variables (quality performance and operating performance). The Cronbach's alpha values of the study variables are summarized in Table 3 and Table 4.
Table-3: Reliability Analysis-TQM practices
TQM
Practices ItemsNo of Cronbach's Alpha
LTMC 5 0.725
CF 5 0.811
SQM 5 0.922
CI 5 0.792
EE 4 0.853
ET 4 0.837
QIA 4 0.760
QA 5 0.900
QCZ 5 0.736
QC 5 0.765
PM 4 0.785
PI 5 0.772
KM 3 0.898
Table-4: Reliability Analysis- Performance indicators
The reliability coefficients of the study variables exceeded the minimum acceptable level of 0.70, as per the suggestion made by Nunnally, J.C. and Bernstein, I.H. (1994).The alpha values range from 0.725 to 0.922, thus concluded that the scales developed were reliable.
4.3.2 Validity Analysis
The concept of validity was formulated by Kelly (1927, p. 14) who stated that a test is valid if it measures what it claims to measure. Validity is the extent to which a measurement tool measures what it's supposed to measure. There are two types validity. Content validity and construct validity. A category was considered to have content validity if there exist general agreement from the literature that the model had measurement items that cover all aspects of the variable being measured (Danny Samson, et.al (1999)). Here in our study selection of the measurement items were based on the extensive review of literature and the evaluation criteria of major international quality awards. So our measures were considered to have content validity. A measure has construct validity if it measures the theoretical construct that it was designed to measure. Principal Components Factor Analysis was used to evaluate the construct validity of each category (Hair et al., 1992).
Performance
Indicators ItemsNo of Cronbach's Alpha Operational
Performance 5 0.760
Quality
© 2017, IRJET | Impact Factor value: 5.181 | ISO 9001:2008 Certified Journal | Page 2941
4.3.3 Factor Analysis
Factor analysis is statistical tool that measures the impact of a few unobserved variables called factors on a large number of observed variables. The interrelationships among a large number of variables can be explained by Factor analysis and also it explains these variables in terms of their common underlying dimensions (constructs). It also helps reduce data that do not correlate with any of the underlying dimensions. Here in this study, principal component analysis method of FA followed by the varimax orthogonal rotation was adopted on 13 TQM practices comparing of 58 items by using SPSS 20.0 software. In order to assess th e construct validity, factor loadings are obtained for each item. Here in this study a loading 0.4 and higher on factor (Hair et al.,1998)was considered. 12 items were deleted (i.e. Leadership and top management commitment-one item; customer focus – one item; Continuous improvement –two items; Quality information analysis – one item; Quality assurance –one item; Quality citizenship-two items; Quality culture-two items; Product innovation-two items) due to low loadings. The total variance explained was 74.992 percent. The Kaiser-Meyer-Olkin (KMO) measure of sampling adequacy was 0.803 which is greater than 0.60 indicate sufficient intercorrelations while the Barlett’s test of sphericity was significant (χ2=14127.378, p=0.000< 0.01). Similarly, another FA was undertaken to see the dimensionality of the dependent variables (quality performance and operating performance A two factor solution emerged with explaining 59.562 percent of variance in the data. The KMO measure of sampling adequacy was 0.761 indicating sufficient intercorrelations, while the Barlett’s test of sphericity was significant ( χ2= 1393.282, p=0.000<0.01).
4.3.4 Structural equation modelling (SEM)
Structural Equation Modeling, or SEM, is a very general statistical modeling technique, that takes confirmatory (i.e.; hypothesis-testing) approach to the analysis of a structural theory bearing on some phenomenon. Structural relations can be modelled pictorially which helps to get a clearer concept of the theory under study. This method uses a confirmatory rather than an exploratory approach to the data analysis. Structural Equation Modeling has its roots in path analysis, which was invented by the geneticist Sewall Wright (Wright, 1921). The general SEM model considered as a combination of two sub models: a measurement model, and a structural model. The measurement model defines relations between the observed and unobserved variables. In other words, it provides the link between scores on a measuring instrument (i.e., the observed indicator variables) and the underlying constructs they are designed to measure (i.e., the unobserved latent variables). The measurement model, then, represents the CFA model, in that it specifies the pattern by which each measure loads on a particular factor. While the structural model shows the relations among the
unobserved variables and it specifies the manner by which particular latent variables directly or indirectly influence changes in the values of certain other latent variables in the model.
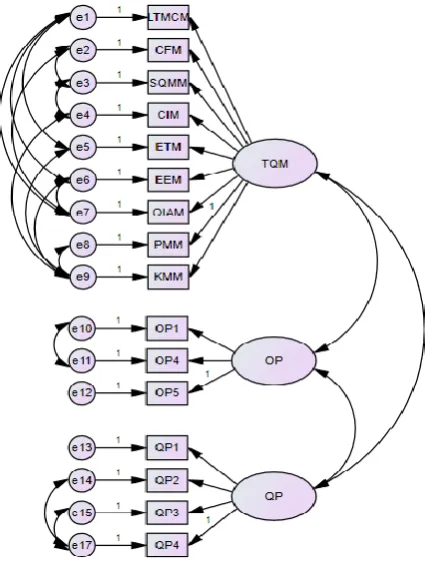
Here in this study AMOS 20.0 software was used for examining the relationship between a set of TQM practices and organizational performance indicators. The measurement model and structural models are shown in figure 2 and figure 3. This assessment of the model was done by examining the standard errors, t-values, modification indices, and a number of goodness-of-fit statistics (Fuentes-Fuentes et al., 2004).The different fit indices considered in this study are GFI, CFI, χ2/df and RMSEA.
[image:5.595.330.543.408.693.2]A comparison of goodness-of-fit statistics relating to measurement model and structural model to the recommended values of these fit indices (Table 5) reveals satisfactory fit of the both models. Some practices Quality assurance, Quality citizenship, Quality culture and Product innovation were eliminated due to low loading in the measurement model. GFI and CFI value for structural models were 0.915 and 0.910 and RMSEA value was 0.079. χ2/df value for structural model was 2.637 which was below the recommended value of 3.0.
© 2017, IRJET | Impact Factor value: 5.181 | ISO 9001:2008 Certified Journal | Page 2942
Figure-3: Structural model for effect of TQM practices onQP through OP
Table-5: Test results of the measurement model and structural model (OP on QP)
The table 6 shows that the hypotheses H1, H2, H3 were significant at p < 0.05.Which indicates TQM practices has significant and direct effect on quality performance as well as operating performance. Also according to H3, TQM practices has an indirect effect on quality performance through operating performance. Knowledge management, continuous improvement and customer focus were found to contribute more on quality performance through operating performance in Indian manufacturing organizations.
Table-6: Construct Structural Model (OP on QP)
4. CONCLUSIONS
This work has accomplished the stated objectives of the study successfully. The main aim of the study was to determine the relationship between TQM critical practices on quality performance through operating performance. The results of the analysis showed that TQM practices has positive and significant effect on quality performance and operating performance. One of the main other finding of the study is that TQM practices have an indirect effect on quality performance through operating performance. Knowledge management, continuous improvement and customer focus were found to contribute more on quality performance through operating performance in Indian manufacturing organizations. Continuous improvement practices ensure maintaining a quality based effective working procedures to meet the standards and providing clear instructions to workers. Customer focus practice makes sure that the products are meeting the customer requirements. Proper sharing of knowledge between managers and experienced employees to other employees helps to reduce defects and wastes and improve product quality. Improvements in operation performance thus lead to defect free superior quality products and ultimately customer satisfaction. So based on this it can be concluded that the above mentioned practices need to be focused more and treated carefully in order to attain good operating performance as well as quality performance in Indian manufacturing organizations.
ACKNOWLEDGEMENT
Gratitude goes to all the organizations, managers and employees of those organizations for their immense contribution towards this research.
REFERENCES
[1] Arumugam, V.,Ooi, K.-B., Teh, P.-L. and Chong, A., Y.-L.. TQM practices and its association with production workers. Industrial Management and Data Systems. ,2008,Vol. 108, No. 7, pp. 909-927.
[2] Black, S.A. and Porter, L.J. ,” Identification of the critical factors of TQM”, Decision Sciences, 1996, Vol. 27 No. 1, 1-21.
[3] Brah, S. A., Wong, J. L., & Rao, B. M. , “TQM and Business Performance in the Service Sector: A Singapore Study”. International Journal of Operations & Production Management,2000. 20(11), 1293-1312.
[4] Danny Samson , Mile Terziovski,”The relationship between total quality management practices and operational performance”. Journal of Operations Management ,1999, 17, 393–409
[5] Danny Samson ,” The relationship between total quality management practices and operational performance”, Journal of Operations Management 17,1999, 393–409.
[6] Das, A., Poul, H. and Swierczek, F. W.,” Developing and validating total quality management (TQM) constructs
Links in
the model Hypothese s
Standardiz ed parameter estimate
T
value P value Result
TQMQP H1 0.69 8.291 *** Supported
TQMOP H2 0.46 4.738 *** Supported
OPQP H3 0.15 2.249 0.024 Supported
Goodness of fit statistics
Measureme
nt model Structural model Recommended value for satisfactory fit of a model to
data
χ2/df 2.649 2.637 < 3.0
GFI 0.906 0.915 > 0.90
CFI 0.915 0.910 > 0.90
© 2017, IRJET | Impact Factor value: 5.181 | ISO 9001:2008 Certified Journal | Page 2943
in the context of Thailand’s manufacturing industry”, AnInternational Journal,2008, 15(1), 52-72.
[7] Durbin .J and G. S. Watson, “Testing for serial correlation in least squares regression.II”, Biometrika, 1951,Vol. 38, No. 1/2 , 159-177.
[8] Faisal Talib, Zillur Rahman, M.N. Qureshi,”Assessing the awareness of total quality management in Indian service industries An empirical investigation”, Asian Journal on Quality,2011. Vol. 12 No. 3, pp. 228-243.
[9] Fuentes-Fuentes M M, C.A. Albacete-Sáez, and F.J. Lloréns-Montes,”The impact of environmental characteristics on TQM principles and organizational performance,” Omega, 2004,32 (6), 425-442.
[10] Hair, J.F. Jr, Black, W.C., Babin, B.J., Anderson, R.E. and Tatham, R.L., Multivariate Data Analysis, Pearson Prentice-Hall, Upper Saddle River, NJ,2006.
[11] Hoang, D.T., Igel, B. and Laosirihongthong, T.,“The impact of total quality management on innovation: findings from a developing country”, International Journal Quality and Reliability Management, 2006,Vol. 23 No. 9, pp. 1092-117.
[12] Hu, L.T. and Bentler, P.M. ,” Cutoff Criteria for Fit Indexes in Covariance Structure Analysis: Conventional Criteria Versus New Alternatives”, Structural Equation Modeling, 1999, 6 (1), 1-55.
[13] Kelley, T.L., Interpretation of educational measurements. New York: World Book Company,1927.
[14] Keng-Boon Ooi, TQM: A facilitator to enhance knowledge management? A structural analysis. Expert Systems with Applications , 2014, 41 5167–5179.
[15] Kline, R. B., Principles and practice of structural equation modeling, NY: Guilford Press., 1998.
[16] Lin, C., Chow, W.S., Madu, C.N., Kuei, C.H. and Yu, P.P., “A structural equation model of supply chain quality management and organizational performance”, International Journal of Production Economics, 2005, Vol. 96, 355-365.
[17] M.S, Bartlett,”Tests of significance in factor analysis”, British Journal of Mathematical and Statistical Psychology,1950, Volume 3, Issue 2 , 77–85.
[18] Nunnally, J.C. and Bernstein, I.H., Psychometric Theory, McGraw-Hill, New York, NY,1994.
[19] Sadikoglu, E., “Total quality management practices and performance”, The Business Review, 2008, Cambridge, Vol.10, No.2, pp. 60- 68.
[20] Samson, D. and Terziovski, M., “The relationship between total quality practices and operational performance”, Journal of Operations Management, Vol. 17,1999, No. 4, pp.393–409.
[21] Samson, D. and Terziovski, M. ,”The relationship between total quality practices and operational performance”, Journal of Operations Management, Vol. 17, No. 4,1999, pp.393–409.
[22] Saraph, J. V., Benson, P. G. and Schroeder, R. G.. “An instrument for measuring the critical factors of quality management”, Decision Sciences, 1989),Vol.20, No.4, pp. 810-829.
[23] Sila, I. and Ebrahimpour, M.. An investigation of the total quality management survey based research published between 1989 and 2000: a literature review. International Journal of Quality and Reliability Management, 2002 ,Vol.19, No.7, pp. 902-970.
[24] Sureshchandar, G.S., Chandrasekharan, R., Ananthearaman R.N. and Kamalanabhan, T.J.. Management’s perception of total quality service in the banking sector of developing economy: a critical analysis. International Journal of Bank Marketing, 2002,Vol.20, No.4, pp.181-196.