U1218076
Page 1 MKM227 Postgraduate Dissertation
Student Number: u1218076
Comments Max
Mark
Actual Mark
Introduction
Identification of a valid topic, research question and
objectives framed to Masters Level standard with academic rationale developed, clear industry contextualisation of the research topic
Supervisor Comments:
10% 2nd marker Comments:
Critical Literature Review
Depth and breadth of
Supervisor Comments:
U1218076
Page 2 literature search, engagement
with seminal authors and papers, evidence of a critical approach toward the scholarly literature
2nd marker Comments:
Research Methodology
Evaluation of research
philosophies and perspectives. Justification of methodological approach, sampling strategy, data analysis and reliability and validity measures as applicable
Supervisor Comments:
15% 2nd marker Comments:
Supervisor Comments:
U1218076
Page 3 Data Analysis and
Interpretation
Evidence of rigor in data analysis and interpretation procedures, identification of key patterns and themes in the research data, integration of academic theory into
explanation of findings
2nd marker Comments:
Conclusions and Recommendations
Research question and objectives addressed with implications to theoretical and managerial concepts
considered. Recommendations provided for theory, practice and future research
Supervisor Comments:
U1218076
Page 4 Organisation, presentation
and references.
Well structured and ordered dissertation with correct use of grammar and syntax. In-text citation and bibliography
Supervisor Comments:
5% 2nd marker Comments:
Total
First Marker Total
100%
U1218076
Page 5
Supervisor General Comments: Agreed Mark:
2nd Marker General Comments:
U1218076
Page 6
IS IT WORTH IT TO INVEST THROUGH FUND MANAGERS?
TEST OF MONTE CARLO SIMULATION ON UK, USA, GERMANY, EUROPE, NIGERIA AND EMERGING MARKET FUNDS.
(2008-2012).
A dissertation submitted in partial fulfilment of the requirements of the Royal Docks Business School, University of East London for the degree of
Masters in Finance and Risk
September, 2013
U1218076
Page 7
I declare that no material contained in the thesis has been used in any other submission for an academic award
U1218076
Page 8 Dissertation Deposit Agreement
Libraries and Learning Services at UEL is compiling a collection of dissertations identified by academic staff as being of high quality. These dissertations will be included on ROAR the UEL Institutional Repository as examples for other students following the same courses in the future, and as a showcase of the best student work produced at UEL.
This Agreement details the permission we seek from you as the author to make your dissertation available. It allows UEL to add it to ROAR and make it available to others. You can choose whether you only want the
I DECLARE AS FOLLOWS:
That I am the author and owner of the copyright in the Work and grant the University of East London a licence to make available the Work in digitised format through the Institutional Repository for the purposes of non-commercial research, private study, criticism, review and news reporting, illustration for teaching, and/or other educational purposes in electronic or print form
That if my dissertation does include any substantial subsidiary material owned by third-party copyright holders, I have sought and obtained permission to include it in any version of my Work available in digital format via a stand-alone device or a communications network and that this permission encompasses the rights that I have granted to the University of East London.
That I grant a non-exclusive licence to the University of East London and the user of the Work through this agreement. I retain all rights in the Work including my moral right to be identified as the author.
That I agree for a relevant academic to nominate my Work for adding to ROAR if it meets their criteria for inclusion, but understand that only a few dissertations are selected.
That if the repository administrators encounter problems with any digital file I supply, the administrators may change the format of the file. I also agree that the Institutional Repository administrators may, without changing content, migrate the Work to any medium or format for the purpose of future preservation and accessibility.
U1218076
Page 9
That I understand that the University of East London does not have any obligation to take legal action on behalf of myself, or other rights holders, in the event of infringement of intellectual property rights, breach of contract or of any other right, in the Work.
I FURTHER DECLARE:
That I
anyone worldwide using ROAR without barriers and that files will also be available to automated agents, and may be searched and copied by text mining and plagiarism detection software.
That if I do not choose the Open Access option, the Work will only be available for use by accredited UEL staff and students for a limited period of time.
/cont
U1218076
Page 10 Field Name Details to complete
Title of thesis
Full title, including any subtitle
IS IT WORTH IT TO INVEST THROUGH FUND MANAGERS?
TEST OF MONTE CARLO SIMULATION ON UK, USA, GERMANY, EUROPE, NIGERIA AND EMERGING MARKET FUNDS 2008-2012.
Author
Separate the surname (family name) from the forenames, given names or initials with a comma, e.g. Smith, Andrew J.
Ajidahun, Adebola Oluwakemi
Supervisor(s)/advisor
Format as for author.
Dr. Peiyi Yu
Author Affiliation
Name of school where you were based
University of East London
Qualification name
E.g. MA, MSc, MRes, PGDip
MSc Finance and Risk
Course Title
The title of the course e.g.
Finance and Risk
Date of Dissertation
Date submitted in format: YYYY-MM
2013-09
Do you want to make the
dissertation Open Access (on the public web) or Closed Access (for UEL users only)?
Open Closed
U1218076
Page 11 detailed above. I understand inclusion on and removal from ROAR is at
Name: Adebola Oluwakemi Ajidahun
Signature: Adebola O. Ajidahun Date: 2013-09-03
U1218076
Page 12 ROYAL DOCKS BUSINESS SCHOOL
POSTGRADUATE DISSERTATION SMM227
PROGRAMME: (MSC) FINANCE AND RISK
DISSERTATION TITLE:
IS IT WORTH IT TO INVEST THROUGH FUND MANAGERS?
TEST OF MONTE CARLO SIMULATION ON UK, USA, GERMANY, EUROPE,NIGERIA AND EMERGING MARKET FUNDS 2008-2012.
STUDENT NO: U1218076
PAPER ID: 25745043
DUE DATE: 3rd September, 2013
U1218076
Page 13 Abstract
In the wake of financial crisis, many investors are faced with the uncertainty in investment decision as a result of the volatility in the market. In an attempt to reduce this risk of uncertainties, investors have therefore provided different method of risk management.
Past studies has shown the importance of fund managers in the management of funds while some proves that fund managers are not necessary in investment. This study carries out an in depth analysis in answering the questions asked by investors; is it worth it to hire a fund manager in investment in funds? This study tests the use of Monte Carlo simulation method on mutual fund data in a practical way.
The research studies mutual funds in the United Kingdom, United States of America, Germany and Nigeria.
The study also went ahead into analyzing emerging market funds and European fund to create an in depth analysis of mutual fund and its performance. It also shows how an efficient portfolio construction can help
market conditions. The study was carried out giving emphasis to the
importance of diversification. The result arrived at after the Monte Carlo simulation was applied to mutual fund data were organized in form a histogram in tabular form in other to carry out a precise analysis on the result of the simulation.
U1218076
Page 14 Acknowledgement
I would like to thank Dr. Peiyi Yu my dissertation advisor for the support, guidance and encouragement in the course of this research.
I also want to thank my parents, Dr. and Mrs Ajidahun for their love and support. My appreciation also goes to my siblings for their encouragement.
U1218076
Page 15 Table of Contents
Abstract ... 13
Chapter 1 : Introduction ... 19
1.1 Justification of Research ... 20
1.2 Definition of Mutual Funds ... 21
1.2.1 Mutual Fund Classification ... 22
1.3 History of Mutual Fund ... 23
1.3.1 Mutual Fund Managers: ... 24
Chapter 2 Critical literature Review ... 26
2.1 Literature review ... 26
2.1.1 Fund Performance ... 26
2.1.2 Mutual Fund Performance and Fund Managers Tenure... 29
2.2 Mutual fund and Risk ... 29
2.2.1 Mutual Fund Risk ... 29
2.2.2 Types of Mutual fund risk... 30
2.3 Mutual Fund Risk Ranking ... 30
2.4 Types of Mutual Funds ... 32
2.5 Effect of Risk Shifting on Mutual Fund Performance ... 34
2.6 Other factors that influence the Performance of a Mutual Fund ... 35
Chapter 3 Theoretical Orientation and Research ... 38
Methodology ... 38
3.1 Model Specification ... 38
3.1.1 Mean Variance Model ... 38
3.1.2 Monte Carlo Simulation Technique ... 41
3.1.3 Brief Overview of Mutual Fund Performance Worldwide ... 42
U1218076
Page 16
3.2.1 Data Collection ... 45
Chapter 4 : Result and Analysis ... 48
4.1 Data ... 48
4.1.1 Summary of All Funds ... 48
4.2 Analysis ... 57
4.2.1 United Kingdom ... 57
4.2.2 United States Of America ... 61
4.2.3 GERMANY ... 63
4.2.3.1 Germany funds compared to DAX Index ... 63
4.2.4 European Funds ... 65
4.2.5 EMERGING MARKET ... 67
4.2.7 Key Conclusion From The Analysis ... 72
Chapter 5 Conclusion ... 75
5.1 Introduction ... 75
5.2 Recommendation ... 76
BIBLIOGRAPHY AND APPENDICES ... 79
U1218076
Page 17 List of Figures
Figure 1.1: The mutual fund operation flow chart (Source: www.slideshare.net) ... 22
Figure 2.1: Table showing the USA fund 1, 3 and 5 years active performance (Source: http://awealthofcommonsense.com/do-your-mutual-funds-outperform-the-market) ... 28
Figure 2.2: Types of funds ranking (Source: Navnit P. Kasundra, performance
evaluation of mutual fund (2012)) ... 31 Figure 3.1: Graph showing correlation of two assets (Source: Group coursework Report 2012 FNM 120). ... 40
Figure 3.2: Percentage of world mutual fund assets (Source: Worldwide Mutual Fund Assets And Flows First Quarter 2013 Report from Investment Company Institute) .. 46 Figure 4.1: Graph showing the return of selecting 10 funds from 12 funds (10/12) 57
Figure 4.2: Graph showing the return of selecting 8 funds from 12 funds (8/12) .... 58
Figure 4.3: Graph showing the return of selecting 4 funds from 12 funds (4/12) .... 59
Figure 4.4: A graph that shows the trend of FTSE 100 RETURN from 2007 t0 2012 (Source: Bloomberg Finance LP (2013)) ... 60 Figure 4.5: Graph showing the comparison between the FTSE 100 and Oxford
Technology Venture Capital Trust PLC (Source: Yahoo Finance echarts (2013)). ... 61
Figure 4.6: Graph showing the return of selecting 8 funds from 10 funds (8/10) ... 62 Figure 4.7: Graph showing the return of selecting 4 funds from 10 funds (4/10) ... 62
Figure 4.8: Graph showing the comparison between the S&P 500 and Direxion Daily Small Cap Bull 3X Shares (Source: Yahoo Finance echarts) ... 63
Figure 4.9: Graph showing the return of selecting 4 funds from 10 funds (4/10) ... 64
Figure 4.10: Graph showing the return of selecting 8 funds from 10 funds (8/10) .. 65 Figure 4.11: Graph showing the return of selecting 8 funds from 10 funds (8/10) .. 66
U1218076
Page 18 List of Tables
Table 3.1: National mutual funds (Source: National mutual fund associations) ... 43
Table 4.1: Table showing the total return on United Kingdom Mutual fund
investment (Source: Authors compilation). ... 49
Table 4.2: Table showing the summary of oxford technology venture capital trust Plc performance (Source: Bloomberg). ... 50
Table 4.3: Table showing the total return on U.S Mutual fund investment (Source: on). ... 50 Table 4.4: Table showing the summary of Direxion Daily Small Cap Bull 3X Shares performance (Source: Yahoo Finance). ... 51
Table 4.5: Table showing the summary of Direxion Daily Small Cap Bull 3X Shares performance (Source: Bloomberg) ... 52
Table 4.6: Table showing the total return on Germany Mutual fund investment ( ... 53 Table 4.7: Table showing the summary of Trinity Capital PLC/Fund performance .... 53
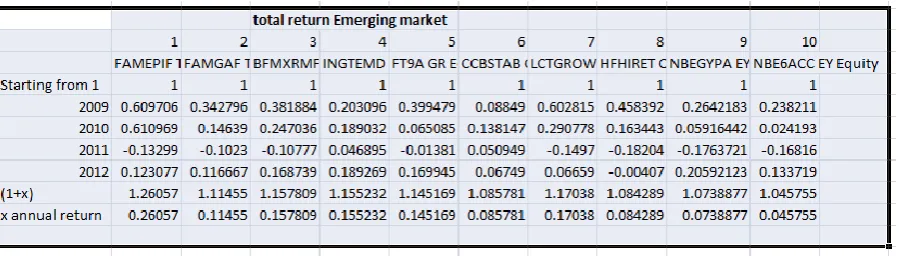
Table 4.8: Table showing the total return on Emerging Market fund (Source: Authors compilation). ... 54 Table 4.9: Table showing the total return on Europe mutual fund
compilation). ... 55
Table 4.10: Table showing the total return on Nigerian mutual fund (Source:
... 56 Table 4.11: Table showing the result of the analysis according to each simulation. 73
U1218076
Page 19 Chapter 1: Introduction
The stock market is a vital aspect of the economy. It is one of the indicators of economic progress and could serve as a pointer to potential financial crisis or otherwise. Several studies in the past have shown investment in funds as a source of long-term profitable investment in the financial markets. These investments usually come with risk.
Financial portfolio management has been a means for investors to create a risk-return balance in the market with the use of selected risk management method to maximize return at the least possible risk.
There are majorly two types of investors: the risk-averse investor and the risk neutral investors. The risk neutral investor is an investor that is indifferent or insensitive about the degree of risk that he is likely incur in his investment while a risk-averse investor prefers a less risky investment and he can only take on risky securities if the expected return is high enough to cushion the adverse effect of the involved.
Keith Pilbeam 2010 (p158) defines a risk-averse investor that given the same expected return an investor will show preference for a security with less risk while a risk neutral investor will be indifferent about the level of risk at a given level of expected return.
Therefore, a risk averse investor has no fear for excess or positive returns but seeks to avert or reduce to minimum the negative effect volatility in the stock market might have on expected returns. In the situation of strong economic conditions and market volatility, risk management has been a means of achieving expected returns while cushioning the adverse effect market volatility might have on expected return. A risk-averse investor is involved in the active management of investment.
An investor might need the help of experienced investment professional/financial intermediaries in allocating funds into profitable securities. This depends on the type of management the investor is involved in that is, the active management of fund or passive management of funds.
U1218076
Page 20
The active management of investment involves active monitoring and evaluating the market and making decisions on the evaluation of the prevailing market on the best funds to include in the portfolio created to minimize risk.
However, due to limited knowledge on the market some individual investors need the help of fund managers in managing their funds using their expertise.
These financial intermediaries make use of various innovations such as arbitrage innovation, market-broadening innovations, pricing innovations, marketing innovations and risk-management innovations via diversification and divisibility. An example of investment that is characterized by its nature of diversification is the mutual fund.
Over the years, theories have been established relating to the importance of fund managers. Some ordinary investors believe the market can be outperformed which is contrary to the theory of efficient market hypothesis which assumes a perfect market where arbitrage opportunities are not possible. Investors who perform passive management of funds invest directly in the stock market index mostly without the help of a fund manager believing the market cannot be outperformed.
Investing through a fund manager would provide opportunities for smaller venture who cannot afford to invest in a fund on their own would add their fund to a pool of funds.
Therefore, the goal of this research is to
1. Determine whether there is a need for the expertise of a fund manager
in the investment management and decisions in investing in funds
2. Determine if ordinary investors in the stock market can beat fund
performance.
3. Decide while testing the Monte Carlo simulation method the best kinds
of funds to invest in terms of their location/countries
4. Outline and probe into the factors that affect funds performance.
5. mutual fund performance using the Monte Carlo simulation method
and to find out if ordinary investors can
1.1 Justification of Research
U1218076
Page 21
However in recent times investors shifted to alternative means of investment in other to minimize risk due to reasons such as fluctuation of interest rates, series of bank scams that led to distrust from the people in the banking sector. Investors were not certain of the genuineness of the transparency in the banking sector. A lot of investors were let down in the course of scam putting them at a great loss, thereby losing their trusts in the management of the banking sector. One major reason for investors search for alternative investments was the financial crisis in 2008.
For this reasons, mutual funds industry has a very important role to
play in providing an avenue of alternative investment for a vast array of investors in a professional manner.
1.2 Definition of Mutual Funds
Mutual fund is a pool of money or investment brought together to invest in a portfolio of profitable ventures or to raise capital in other to invest in various companies. Mutual fund stocks are very liquid and are used in buying or selling shares which yield dividends that are distributed amongst shareholders. Dividends are received on the shares held and capital gains or loss are realised on the traded securities.
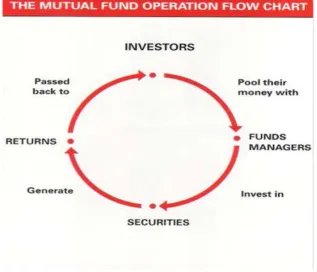
Navnit P. Kasundra (2012 p5) listed the processes of mutual fund investment as follows:
Steps of mutual fund investment:
1. Gather funds from various investors
2. Invest
3. Earning from the fund are classified as dividend or asset appreciation.
4. Earnings are redeemable by investors at a specified time in close end funds and anytime in open end funds
U1218076
[image:22.595.139.457.53.325.2]Page 22
Figure 1.1: The mutual fund operation flow chart (Source: www.slideshare.net)
1.2.1 Mutual Fund Classification
Mutual funds are named according to their management pattern. There are majorly two types of funds, namely; open end funds and closed end funds.
Open end funds are funds that issue shares at their net asset value (NAV). It allows investors to cash out their funds by selling their shares back to the fund at the net asset value.
Closed end funds are funds whose shares are traded on organized exchange like every other common stock at a price different from the net asset value. It does not allow investors who cash out their funds to sell it back instead they sell to different investors.
U1218076
Page 23
Investment in mutual funds provide smaller venture the opportunity of partaking in the returns on big investment which they cannot afford to invest in on their own.
Mutual funds are operated by investment companies who are financial intermediaries that gather funds from individual investors to create a pool of assets and invest this fund in a range of securities that are expected to perform well. These funds are known as managed funds. These Mutual funds are classified according to their investment policy, that is they are identified by the sector or asset they are invested in such as money market funds; funds that invest in money market securities, equity funds, sector funds, bond funds, balanced funds, index funds to mention a few.
1.3 History of Mutual Fund
Funds investment has been ongoing and growing for over 20 years. In fact, the first investment of pooled asset was first mentioned s back as 1774 by a Dutch merchant named Adriaan van Ketwich. The first modern mutual fund went public in 1924 and the mutual fund industry has expanded since then; surviving the stock market crash of 1929 although some closed-end funds could not survive the crash.
Mutual funds got the attention of the public, especially investors in when investment in mutual fund provided investors with an exceedingly high return due to its outperformance in the market.
Hence, Mutual funds have gone through various structural changes and it has been able to plant its feet firmly in the finance industry. Mutual funds are now a dominant investment pooling company. Statistics shows that the United States of America mutual fund industry manages assets of over $8 trillion as at 2005.Therefore, mutual funds are known to reduce risk of total loss, that is, it lessens the weight of an investment loss on investors through diversification.
Nevertheless, the risk involved in investment, that is both the systematic (undiversified risk) and unsystematic risk (diversified risk) cannot be ignored. Although, mutual funds are assumed to be risk free in its mode of management and investment as a result of diversification allowing investors the opportunity to invest in diverse market sectors.
One major advantage of mutual fund investment is that it serves as a source of capital outflow and in flow in the economy.
U1218076
Page 24
also contribute vigor to the security markets where their investment is focused, as a result adding to the liquidity strength of the market and its price discovery. Instead of the locking up a substantial amount of money or assets in unproductive physical capital such as gold, the mutual funds serves as a significant factor in the channeling of money in the market.
Other Advantages of Mutual Funds
Opportunity of Professional management
Transparency of returns
Diversification
Ease of administration
Tax benefits
Organized regulation of the industry
Source of capital flow in the economy; mutual funds increase the level
of risk capital that is existing in the economy to fund enterprise.
Mutual funds also contribute to the liquidity and price discovery of the security market they are invested in, thereby, channeling more money into the market.
However, critiques of mutual funds have stated disadvantages of mutual funds. Some of mutual funds drawbacks are highlighted as follows;
The cost of administration fee and commissions of mutual is too high
and sometimes reduces the return when the cost incurred is deducted from the total return.
There is no guarantee on the returns to be expected as a result of
effects on systematic risks on investments.
Fund managers decision; the expected return possible depends on the
experts decision so there is risk if the fund manager is not efficient enough.
1.3.1 Mutual Fund Managers:
U1218076
Page 25
require a fee for the services carried out and this fee is a percentage of the fund's average assets under management.
Accordingly, an investor paying a fund manager to perform his duties on
the investors fund will be concerned about the fund efficiency in
earning a profitable return. The investors will ask the following questions
use of a fu
Hence, to answer and confirm above questions, this paper will draw a string from many researches that have been carried out on mutual funds performance over the years which have given birth to a variety of efficient portfolio risk management models/theories.
The theory used in this research is the Monte Carlo simulation model and the Mean Variance approach by Markowitz.
This paper will focus on efficiency of portfolio risk management in minimizing risk with focus on mutual fund, that is, providing a benchmark from which investors can make comparison that will guide in the portfolio decision making.
This dissertation will apply fundamental statistical analysis (Monte Carlo simulation) to analyze investment in the fund by getting data on top performing funds in the United Kingdom, United States of America, Germany, European funds, Nigerian funds, Emerging market funds and yearly data for five years on mutual funds from 2008 to 2012.
Therefore, I will apply the Monte Carlo simulation method to explain and appraise fund management with focus on the best possible fund portfolio that will yield optimum profit at low risk keeping in mind the effect of financial crisis on the correlation of asset.
U1218076
Page 26 Chapter 2Critical literature Review
2.1 Literature review
Application of portfolio risk management on mutual funds is a profound topic in the financial market. So far, research has been made involving mutual fund performance using different portfolio theories. The Modern Portfolio Theory also known as the mean variance approach formulated by Harry Markowitz was initially mentioned in the Journal of Finance published in 1952. The base of the theory was later established and expanded upon by William Sharpe, who propounded the Capital Asset Pricing Model (CAPM). These theories have been tested by different researches in Journals and articles.
Tze Leung et al. (2011) shed light on the mean variance approach as a single-period theory on the choice of portfolio weights that provide the best possible trade-off between the mean which represents profit and the variance that serves as a measure of risk for a potential portfolio return.
Recent study was carried out by Nargis, Hasinur Rahaman, Hasina and Khan and they were able to show the efficiency frontier as a combination of the portfolio with minimum risk and portfolio with maximum return.
However in their study, it was difficult to show exactly where the efficiency frontier is as a result of the number of assets involved.
2.1.1 Fund Performance
Fund performance has been classified into two forms by mutual fund authors as positive fund performance and negative fund performance.
Mukta, Sweta and Rahul (2012) explains that a relationship exists between past performance of fund and its future performance, that is when a mutual fund performs well in the past, it is likely it performs well in the future. This
Hence, they went ahead to explain that a mutual fund that has performed well in the past will continue to outperform in the future, this condition is called the positive persistence of the mutual fund. Likewise, negative persistence means that if a mutual fund has not performed well in the past then it will continue to underperform in the future as well.
U1218076
Page 27
However, Jan and Hung (2004) claimed that if there is mutual fund performance persistence in the short run, it should also occur in the long run. They proved their finding that if persistence occurs in a current year then it should persist into the following year and that process should continue on a rolling year basis. Their research confirmed that short run and long run performance of fund is very important in security selection of funds.
In contrast, another study done by Jan and Hung (2003) did not support the performance persistence in the mutual funds. Carhart (1997) detected an insignificant proof of skilled mutual fund managers regarding to persistence of the performance.
These authors focused on the performance of mutual funds in terms of factors affecting mutual fund returns. Meanwhile, the authors did not include studies on the need of fund managers in the managing mutual funds and the possibilities of outperforming the market in relation to these factors.
According to Wermers (2000 p. 35) stated results arrived at between the year 1975 and 1994 implies that indicate that mutual funds held in stock portfolios outperform the benchmarket market index by 1.3 percent per This outperformance is due to the quality of stocks funds invest in
In addition, Wermers (1997) and Grinblatt et al (1993) also confirmed
For instance, funds who invest in stocks with higher average returns tend to outperform the passive stock market.
U1218076
[image:28.595.140.495.52.263.2]Page 28
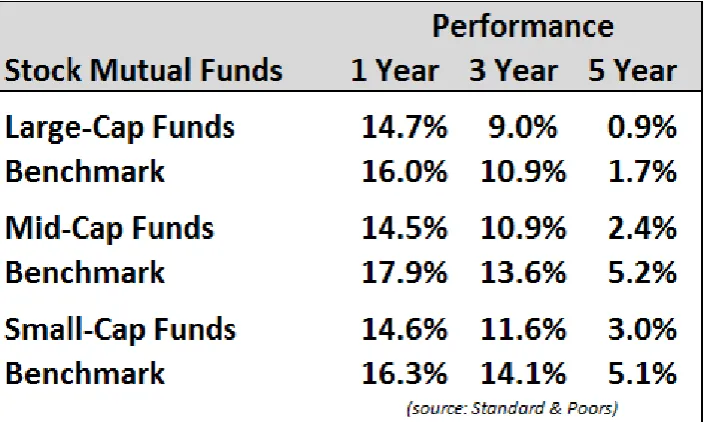
Figure 2.1: Table showing the USA fund 1, 3 and 5 years active performance (Source:
http://awealthofcommonsense.com/do-your-mutual-funds-outperform-the-market)
Hence, these studies shows that fund managers possess the capacity to outperform the market especially before the deduction of operation and/or commission fees are deducted.
Nevertheless, a number of studies carried outperformance of active fund performance concluded that mutual funds on average underperform the market index or benchmark. Partly, this may reflect the costly and unproductive efforts made by mutual funds to outperform the market volatile markets.
A study on mutual fund from 1985 to 1994 by Gruber (1996) had shown that the passive market index outperformed the average mutual funds by 65 basis points.
In addition, Carhart (1997) finds that the more active management of
mutual fund is, t -adjusted net return to
investors . He also explained performance in terms of other factors that accrue to the performance of fund and the efficiency of the fund manager in
terms of market timing and style analysis. Prior to Carhart study, Jensens
(1968) discovered that market timing skills are not efficient in
U1218076
Page 29
2.1.2 Mutual Fund Performance and Fund Managers Tenure
According to Lee and Rahman (1990) mutual fund managers are able to time the market well and achieve significant result through effective security analysis.
Consequently, studies on active and passive mutual fund performance have been carried out regarding the impact of mutual fund performance in
terms of fund tenure.
With the use of a different means, Mishelson and Wagner (1999) discovered that there is no evidence of any relationship between mutual fund manager tenure and its performance. According to this study, choosing a mutual fund with regards to manager tenure is not the best form of investment. As fund manager's tenure does not have any impact on its performance.
In a different study by Costa et al. (2006), it was concluded that manager tenure is not a significant factor when looking for superior mutual fund investment returns. They also concluded that a fund managers experience with fund is not a factor to be considered in the achieving a well adjusted risk-return trade off in investment. This can be attributed to the market volatility.
2.2 Mutual fund and Risk
Mutual funds are not in total risk free as it is exposed to both systematic and unsystematic risks. Different funds are exposed to varying level of risks and fund managers attempt to minimize the risk.
In an earlier study, Kim (1978) studied mutual fund data from 1969 to 1975 and realised that most of the funds were outperformed by it benchmark portfolio emphasizing the investment experience of the analyzed period is consistent with the efficient market hypothesis, as many previous studies of mutual funds were.
The study went further to compare returns on mutual fund with high risk and their benchmark portfolio concluding that the gap between the returns on the mutual funds of high risk and their benchmark portfolios is likely to reduce if the mutual fund is compared to a more risky market index.
2.2.1 Mutual Fund Risk
U1218076
Page 30
risk cannot be separated from financial gains, that is, research on investment risk is as important as the research on its return.
In other words, risk is the likelihood that an investment may not perform as well as expected or it may reduce in its value unexpectedly. As mentioned earlier, no investment is risk free irrespective of its location or allocation. For example, money kept securely in the bank in a savings account is exposed to inflation risk.
2.2.2 Types of Mutual fund risk
1. Credit Risk: This is also known as default risk. It is the likelihood or possibility that the company the funds are invested in will not pay dividend due or the principal amount after maturity of the contract. Investors can avoid this by carrying out a thorough research on the creditworthiness of the firm.
2. Inflation risk: This is the risk that money held today will worth less
than worth today. It is the risk that the dollar gotten when sold will
buy less than the dollar originally invested.
3. Interest rate risk: This is the risk of a sudden increase in interest rates.
4. Market Risk: This is the risk that the value of investment will decrease.
In a very recent study by Navnit P. Kasundra (2012 p.21), Navnit laid more emphasis on risk return trade off in mutual fund performance by analysing different types of risk involved in investment in fund. He stated that Mutual Funds do not guarantee expected returns and these returns are an indicator of the fund performance.
Mutual funds are invested into various risky assets. The value of the fund will depend on the performance of the organization/security they are invested and the likelihood of this organization to default in payment of dividend, interest and or principal is called credit risk.
Apart from the above, risk could come from new regulations from the government which may adverse effect on a particular class of industry. All these are issues influencing Mutual Funds performance.
2.3 Mutual Fund Risk Ranking
U1218076
[image:31.595.112.475.88.385.2]Page 31
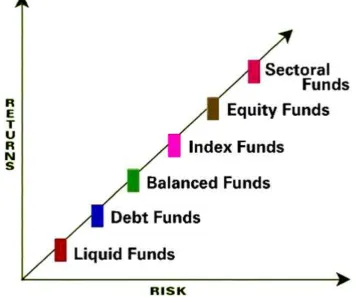
Figure 2.2: Types of funds ranking (Source: Navnit P. Kasundra, performance
evaluation of mutual fund (2012))
The above graph shows that liquid funds are less risky than debt funds and other types of fund because of its early maturity. The property of a mutual fund as a short term investment reduces the effect of market volatility in its return. In ascending order debt funds are exposed to a lesser risk than balanced fund likewise index funds are less risky than equity fund. As a result sectoral risk is the most risky mutual fund.
One fundamental rule applies to all investments. The lesser the risk accrued to an investment or a fund, the smaller the expected return. The more the risk accrued to an investment or a fund, the higher the expected return.
ready to talk on.
U1218076
Page 32
everyday to return the health of the nation to its peak. Despite the irregularities in the stock market, it has risen in the last few years.
2.4 Types of Mutual Funds
Bodie et al(2011 p. 124-126) classified mutual funds into eight(8) types of funds namely; money market fund, balanced funds, equity funds, sector funds, international funds, bond funds, asset allocation and flexible funds and index fund.
Navnit P. Kasundra (2012 p.21) also characterised fund in terms of its objectives and scheme. Mutual funds Scheme are open ended funds and close end funds.
Mutual fund in terms of its objectives
(a)Liquid fund/ Money Market funds
Liquid funds are short term funds with a maturity that is less than a year, ranging from three (3) months to a year. It gives investors the opportunity to claim their funds whenever the needs arise without penalty. It is advantaged because it allows the investors the opportunities of earning a return on their investment without holding the asset for a long time. Money Market funds are short term funds such as commercial paper, certificates of deposits and repurchase agreement. Money market funds usually offer check-writing features and net asset values is fixed at $1 per share. Furthermore, it reduces They are used in place of short term fix deposits.
(b)Equity funds are funds that invest majorly in stock. It might also be invested in fixed- income or other types of securities at the fund
maagers choice. In other to provide liquidity equity funds holds up to 5% of its total assets in the money market. Their main objective is to make available capital appreciation over the medium and long term period of investment. Equity funds are sometimes known as growth funds. The returns in this type of funds are volatile because the fund is directly linked to the stock market.
Navnit P. Kasundra (2012 p.21) categorized the types of equity funds as, Sector specific funds, diversified funds and Index based funds
(i) Sector funds: They are types of equity fund that focuses on a
U1218076
Page 33
biotechnology, utilities, precious metals or telecommunications, that is, their investment are restricted to a specific segment or sector in the economy.
Sector funds tend to be more volatile than other funds that are more diversified in investing in many industries. Such diversified portfolios possess higher probabilities of producing remarkable gains or losses, depending on whether the chosen sector is in or out of favour. Sector mutual funds provide a risk-return reward and are not attractive to risk averse investors.
By and large, mutual fund institutes evade beginning with sector funds because they are nomadic in nature and perform well only in phases/cycles. Hence the sector funds focus on a single sector of the economy, thereby limiting diversification and the fund
ther sectors, if the specific ector is doing very well and it has a potential long term growth, it advisable not to trade in sector funds.
(ii)Index funds are types of equity funds that attempt to match the performance of the broad market index. Index fund are planned to equal the expected returns on a stock market index. They can also be defined as mutual funds whose portfolio and performance is equivalent to the portfolio of a broad market index, for example, the Dow Jones index. Indexing is a passive form of fund management that is a base of argument and research by many authors. The argument is that the index funds outperform most actively managed funds. The major advantage of indexing is the opportunity of a lesser operational cost. Many actively managed mutual funds do not outperform the market indexes because of the reduction in returns by higher expense ratios.
(a)Bond funds: this funds specializes in the fixed- income sector. However, there is considerable room for further specialization. It is a mutual fund that lays emphasis on income in relation to risk rather than growth. Bond funds are invested in corporate, municipal, or US government debt obligations, or some combination of them. Gains are shared in terms of dividends calculated from coupon payments and principal at the maturity of the bonds. A bond mutual fund tends to yield more dividends more often than an individual bond. Bond mutual funds are composed of either each of convertible, treasury, mortgage or municipal bonds or a portfolio of these bonds.
U1218076
Page 34
market funds. From a United State perspective, International funds are funds that invest in companies or securities international to the United States. Global funds invest in securities worldwide including the country which the fund is domicile. Regional funds are focused on a particular part of the world. Finally, emerging market funds are funds that invest in securities of developing countries.
(c)Balanced Funds: These funds exhibit both the characteristics of both equity funds and bond funds. They invest in equity shares as well as fixed-income instruments in different or same proportion. Balanced fund reduces the volatility of the fund and it provides a steady return for investors. This type of fund is usually recommended to investors with a moderate level of risk tolerance for medium to long term period.
(d) Asset allocation funds and flexible funds are similar to balanced funds in that they are both invested in stocks as in equity funds and bond as in bond funds. It also reduces volatility of funds in the market. Their weights of allocation vary in proportion relative to the portfolio manager or fund manager decisions.
2.5 Effect of Risk Shifting on Mutual Fund Performance
Jennifer Huang et al (2011) went further in the analysis of mutual fund by examining the effect of risk shifting on the performance of mutual funds. He explained that mutual fund changes its risk overtime and this can be as a result of unguided trade of unskilled fund managers who only trade for their own individual gain. On the contrary, risk shifting can also occur when fund managers make use of all opportunities of their stock selection abilities in investment.
Furthermore, this study investigates the cost of risk shifting on mutual fund performance and the economic incentive associated with risk-shifting behaviour. They used a holding-based gauge of risk shifting and concluded that funds with stable risk perform better than funds that increases risk exposure. This result suggests that risk shifting indicates the inferior ability of the fund manager.
In addition, it could also be inferred that risk shifting is one of the factors to be considered in mutual fund performance appraisal.
Besides risk shifting; the performances of Mutual funds are subjective to activities and the state of the stock market and the economic conditions in its totality.
U1218076
Page 35
Equity Funds are largely affected by the stock market. Bond-funds are subject to changes in interest rates and credit quality. A rise in the interest rates will cause the price of bond to fall and when interest rate falls, bond price increases. In the same vein, changes in the economy do not have great influence on bonds with high credit ratings.
2.6 Other factors that influence the Performance of a Mutual Fund
1. Tenure: Managers tenure is the number of years a particular fund manager handles a particular fund. Whenever a well performing fund is discovered, attention will be drawn to the fund manager who is responsible for the impressive returns.
Demissew and Raja (2009, p103-112) studied the effect of managerial tenure on the performance of mutual funds. They examined the diverse aspects of the mutual funds and relate its performance to their
fund tenure. Finally, they concluded that managerial tenure
has a positive impact on mutual fund performance.
has a statistically significant effect on the three to five years annualized returns and positive statistically insignificant on the 10 year returns. This is because long-term performance will reflect no significant information about future performance if the manager has only been managing the fund for one year. Manager tenure is especially important when analyzing actively-managed funds.
2. Expense Ratio: This is the cost incurred in the management of fund and it has an on impact on the fund performance. The expense ratio
accumulates daily. Their relationship shows an indirect
proportionality. Therefore over a long period of time such as 10years, the funds with the lowest expense ratios are frequently those with the best performance. It represents the percentage of cost incurred in an investment each fiscal year. It comprises of all the cost incurred by the fund, this costs include the management fees, administrative fees and the operating costs. Portfolio transaction fees and sales charges are not included in the expense ratio.
assets, the expense ratio tends to be high. On the other hand
accompanied by a smaller percentage of expense ratios as charges are allocated over a wider base. Some funds might decide not to claim all or a fraction of the expenses that is composite of the overall expense ratio.
U1218076
Page 36
turnover ratio is determined by the type of mutual fund, objective of the mutual fund and the investment style of a fund manager. A high turnover ratio indicates frequent trading, which can drive expenses and relative risk higher. For example, a stock index fund will be characterised by a small turnover rate, but a bond fund, either on a passive or an active management, will possess a high turnover because bond investments are characterized by active trading. Furthermore, a large- cap value stock fund tends to have a lower turnover ratio when compared to an aggressive small-cap growth stock.
Ceteris Paribus, investors should favour funds with low turnover. High turnover results in higher transaction fees, which on a net return basis would reduce the return on fund. Turnover ratios for a mutual fund will be different from year to year, but the universal range can be measured by studying the values over a considerable number of years.
4. Tax Cost: If you have investment assets in a taxable account, you'll want to be careful not to place too many funds that generate taxes, such as dividend mutual funds, in the account. Investors are bound to pay on any gains they realize on an investment. Consequently, over the course of a year, investors must include the capital gain realized/ achieved in the filing of income tax. For this reason, it is very
important for a fund manager to be able to accurately calculate the likely cost basis that might be incurred on an investment and
especially a mutual fund investment.
The actual worth of an asset adjusted for stock splits, dividends and capital distributions is referred to as the cost basis. The cost basis is extremely significant for the calculation of tax from the capital gain. The calculation of cost basis becomes rather complicated in the case of mutual fund as a result of dividend payment and the reinvested of capital gain.
You may also consider using some of the best index funds, which naturally have low expenses, low turnover and good tax efficiency.
From above stated studies, evidence do not pose an encouraging picture of mutual funds, rather, the studies conclude that it is better to invest directly in the stock market. Despite all this research investors still continue to invest heavily into actively managed funds in other to achieve optimum or desired performance.
U1218076
Page 37
U1218076
Page 38 Chapter 3 Theoretical Orientation and Research
Methodology
Mutual fund existence and importance in the last few decades has caused investors, stock analysts and fund managers to seek dependable means of achieving their stipulated future risk and return of a portfolio of securities. The researches were carried out having in mind that;
All investment are prone to risk
It is possible to apply statistical analysis on historical data
Due to variability and volatility, it is possible to maximize return and minimize risk.
Therefore, the above mentioned assumptions illustrate the Modern Portfolio Theory (Mean Variance Approach) by Harry Markowitz mentioned in
1952 in the Journal of Finance. William Sharpe the founder of the Capital
Asset Pricing Model expanded on the foundation theories of Mean Variance Model.
3.1 Model Specification
3.1.1 Mean Variance Model
According to Myles E. (2013, p.60), Markowitz assumed that:
Investors are rational.
Investors are willing to take on higher risks only if they a higher expected return is certain.
information concerning investment decision are gathered by investors; an investor would want to have a clue on the potential return the investment would yield and at the level of risk
The theory also assumed that there is a chance of a risk free asset, that is, government Treasury bill.
Preferences are given to the risk - return trade off, that is, at a given level of expected return, an investor would prefer a lower risk and at a given level of risk, an investor would require a higher level of return.
It is assumed that investment occur in a perfect capital market with no transaction costs.
U1218076
Page 39
Next, thereby creating the best/optimum portfolio. The goal of the research is to create a benchmark portfolio to compare with stocks current price, with the aim of figuring out what stock to invest in.
The mean-variance approach makes use of risk and expected return trade off as indicators in analyzing investment performance. Hillier et al. (2008, p.243) stated the measures of risk as variance and standard deviation.
A. The port
Where:
depicts the return of company
depicts the weight allocated to the company
represents the potential return on portfolio
N represents the number of companies in the portfolio
B.
Where:
represents the company weight for company x represents the company weight for company y Cov(x, y) represents the covariance of company x and y N represents the number of companies in the portfolio
Hillier et al. (2008, p.256) also described standard deviation and
variance as an indicator of return, describing
U1218076
[image:40.595.121.476.54.288.2]Page 40
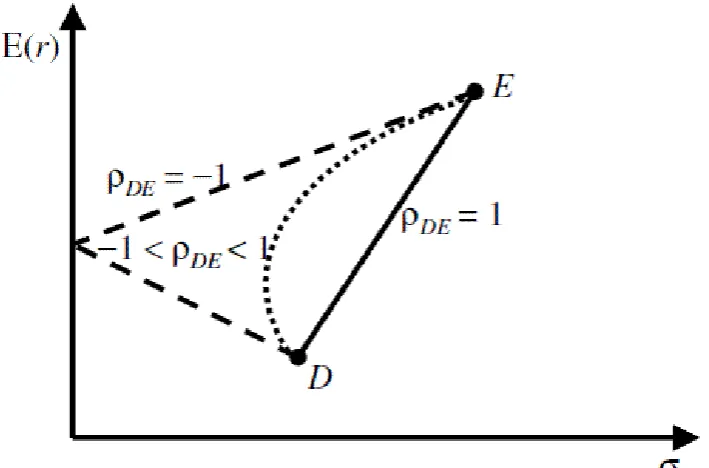
Figure 0.1: Graph showing correlation of two assets (Source: Group coursework Report 2012 FNM 120).
The graph on Figure 3.1 shows the correlation of two assets and the result of diversification.
=
-
-1 represents perfect negative correlation
1 represents perfect positively correlation
0 represents no correlation
Markowitz argues that investing in different types of assets that are not perfectly positively correlated can minimize portfolio risk that is, investors can minimize excess risk that is likely to occur from holding an individual asset by making a choice of investing in a diversified asset.
Fabozzi et al. (2002) explained diversification by relating it to a common
U1218076
Page 41
therefore be explained as investing in various assets with different kinds of risk.
However, recent studies, have extensively criticized these assumptions. Some of the criticisms accrued to this model include:
First, the assumption of market efficiency was challenged by studies and real life occurrence of market bubbles, boom and the recent financial crisis. The criticism and events in the market has been able to prove the inefficiency of the market.
Second, fund managers and investors possess different degree of information. This is called information asymmetry. The form of access to information is contrary to the assumption of perfect information by Markowitz. The sources and degree of information affects mangers decisions on investment.
Third, the assumption of a perfect capital market with no taxes and transaction cost has been criticized based on the argument that mutual fund investment is subject to tax, operational cost and commission fees.
assumption that investors usually seek out to maximize return and minimize risk has been criticised based on the argument that, investors prefer to invest in popular sector and the market in boom because of speculated excess return (Myles, 2013, p.67).
3.1.2 Monte Carlo Simulation Technique
In the light of above stated criticism, this research will use the Monte simulation technique in other to have an in-depth research.
The Monte Carlo technique was introduced during the World War II by a scientist working on the atomic bomb. Since its existence, it has been used tremendously in the field of finance and other science fields. David B. Hertz originally introduced the Monte Carlo methods to finance in 1964 by in an article written in the Harvard Business Review.
U1218076
Page 42
Furthermore, Monte Carlo simulation method is a mathematical process that allows the decision maker, investor or fund manager in this case a series of possible outcome and probabilities of occurrence for any investment decision. Monte Carlo simulation techniques allows for random selection of a series of data in creating a portfolio of investment. Monte Carlo simulation technique is popular in other professional fields apart from finance such as engineering, project management, energy, oil industry, research and development, transportation and insurance.
Therefore, Monte Carlo technique advantage over other techniques becomes more significant as the sources of uncertainty, volatility and ambiguity in the market increases.
3.1.2.1 Steps to Monte Carlo simulation
1. Specify the model
The author selected mutual fund data on the last price, 12 months dividend per share and the total return index gross dividend which is used for the total return of the period given. The model estimates the probability of choosing a company and earning an expected return that will outperform the market provided equal weights are given to each asset in the portfolio.
2. Simulate a draw from the data and estimate the model using the
simulated data.
The author selects 10 assets, 8 assets and 4 assets each at different interval of simulation from sample funds from each regions from which the mutual fund is domicile.
3. The author repeated the step three times each for each sample region
of study and saved the result for each simulation
4. I stored the data in tabular forms and histogram for better analysis
3.1.3 Brief Overview of Mutual Fund Performance Worldwide
U1218076
Page 43
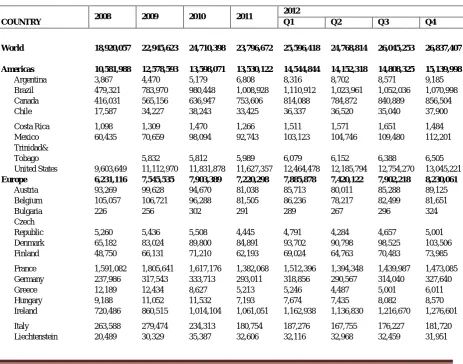
At the end of the first quarter of 2013, mutual fund assets have increased by 3.8 percent globally to $27.86 trillion. The net cash flow worldwide to all funds increased to $339 billion in the first quarter of 2013 when weighed against to the net cash flow at the end of 2012 which was $427 billion. Long-term funds rose to $447 billion early 2013 which is recorded has the highest so far in the history of long term funds. Equity funds had the largest net inflow globally, calculated to be $144 billion in early 2013 which happens to be the highest since 2006.
The bond fund went down from $217 billion to $189 billion in the first quarter of 2013. The bond fund did not perform well when compared to other funds in the market. The money market funds also did not perform well as it dropped from $137 billion in 2012 to $109 billion in the first quarter of 2013.
[image:43.595.71.535.397.761.2]The table below shows the performance of funds worldwide.
Table 0.1: National mutual funds (Source: National mutual fund associations)
TOTAL NET ASSETS IN U.S. DOLLARS
Millions, end of period
COUNTRY
2008 2009 2010 2011 2012
Q1 Q2 Q3 Q4
World 18,920,057 22,945,623 24,710,398 23,796,672 25,596,418 24,768,814 26,045,253 26,837,407 Americas 10,581,988 12,578,593 13,598,071 13,530,122 14,544,844 14,152,318 14,808,325 15,139,998
Argentina 3,867 4,470 5,179 6,808 8,316 8,702 8,571 9,185
Brazil 479,321 783,970 980,448 1,008,928 1,110,912 1,023,961 1,052,036 1,070,998
Canada 416,031 565,156 636,947 753,606 814,088 784,872 840,889 856,504
Chile 17,587 34,227 38,243 33,425 36,337 36,520 35,040 37,900
Costa Rica 1,098 1,309 1,470 1,266 1,511 1,571 1,651 1,484
Mexico 60,435 70,659 98,094 92,743 103,123 104,746 109,480 112,201
Trinidad&
Tobago 5,832 5,812 5,989 6,079 6,152 6,388 6,505
United States 9,603,649 11,112,970 11,831,878 11,627,357 12,464,478 12,185,794 12,754,270 13,045,221
Europe 6,231,116 7,545,535 7,903,389 7,220,298 7,885,878 7,420,122 7,902,218 8,230,061
Austria 93,269 99,628 94,670 81,038 85,713 80,011 85,288 89,125
Belgium 105,057 106,721 96,288 81,505 86,236 78,217 82,499 81,651
Bulgaria 226 256 302 291 289 267 296 324
Czech
Republic 5,260 5,436 5,508 4,445 4,791 4,284 4,657 5,001
Denmark 65,182 83,024 89,800 84,891 93,702 90,798 98,525 103,506
Finland 48,750 66,131 71,210 62,193 69,024 64,763 70,483 73,985
France 1,591,082 1,805,641 1,617,176 1,382,068 1,512,396 1,394,348 1,439,987 1,473,085
Germany 237,986 317,543 333,713 293,011 318,856 290,567 314,040 327,640
Greece 12,189 12,434 8,627 5,213 5,246 4,487 5,001 6,011
Hungary 9,188 11,052 11,532 7,193 7,674 7,435 8,082 8,570
Ireland 720,486 860,515 1,014,104 1,061,051 1,162,938 1,136,830 1,216,670 1,276,601
Italy 263,588 279,474 234,313 180,754 187,276 167,755 176,227 181,720
U1218076
Page 44
As a result of this vast increase in the number of funds worldwide, the decision making by investors have become difficult, therefore the need of a fund manager. In contrast, some investors believe that the increase in the numbers of mutual fund is an open door to more effective diversification advantages.
However, the likelihood of selecting the most excellent active mutual funds is low since most of these funds could not outperform the market over a period of time. Statistics for active mutual fund performance in the U.S stock mutual funds shows that above 60% of large-cap funds, 67% of small-cap funds and above 70% of mid-small-cap funds have been unable to beat failed to outperform the broad market index 2012.
According to Standard & report in 2012, the review of mutual
funds in the U.S were not impressing for the year period ending in 2012 as the large, mid and small-cap active mutual funds underperformed for the five year period.
However, these reports only cover for the United State of America and not other countries in the world.
Luxembourg 1,860,763 2,293,973 2,512,874 2,277,465 2,489,170 2,343,636 2,510,001 2,641,964
Malta 2,132 2,335 2,905 3,002 3,033
Netherlands 77,379 95,512 85,924 69,156 73,564 66,819 70,634 76,145
Norway 41,157 71,170 84,505 79,999 90,151 84,077 93,890 98,723
Poland 17,782 23,025 25,595 18,463 22,138 20,193 22,554 25,883
Portugal 13,572 15,808 11,004 7,321 7,547 6,598 6,987 7,509
Romania 326 1,134 1,713 2,388 2,244 2,251 2,400 2,613
Russia 2,026 3,182 3,917 3,072 3,508 2,877
Slovakia 3,841 4,222 4,349 3,191 3,076 2,803 2,882 2,952
Slovenia 2,067 2,610 2,663 2,279 2,474 2,226 2,340 2,370
Spain 270,983 269,611 216,915 195,220 204,754 183,537 188,660 191,284
Sweden 113,331 170,277 205,449 179,707 198,752 182,366 199,454 205,733
Switzerland 135,052 168,260 261,893 273,061 301,256 294,112 310,504 310,686
Turkey 15,404 19,426 19,545 14,048 14,820 14,993 15,862 16,478
United
Kingdom 504,681 729,141 854,413 816,537 903,832 857,999 938,834 985,517
Asia and Pacific 2,037,536 2,715,234 3,067,323 2,921,276 3,030,867 3,067,208 3,196,427 3,322,198
Australia 841,133 1,198,838 1,455,850 1,440,128 1,526,808 1,535,778 1,610,190 1,667,128
China 276,303 381,207 364,985 339,037 336,108 371,150 373,519 437,449
India 62,805 130,284 111,421 87,519 84,044 97,841 110,021 114,489
Japan 575,327 660,666 785,504 745,383 750,512 731,386 753,552 738,488
Korea, Rep.
of 221,992 264,573 266,495 226,716 243,157 240,881 255,419 267,582
New Zealand 10,612 17,657 19,562 23,709 26,846 27,085 30,020 31,145
Pakistan 1,985 2,224 2,290 2,984 3,419 3,764 3,214 3,159
Philippines 1,263 1,488 2,184 2,363 2,737 2,956 3,210 3,566
Taiwan 46,116 58,297 59,032 53,437 57,236 56,367 57,282 59,192
Africa 69,417 106,261 141,615 124,976 134,829 129,166 138,283 145,150
U1218076
Page 45
3.2 Methodology
Most researches carried out on active mutual fund performance have not included the use of Monte Carlo simulation technique in achieving their objectives neither have they compared mutual fund performance of different countries worldwide. The author wishes to evaluate the performances of mutual funds and compare to the selected index as benchmarks by reviewing broad studies that cover the vital issues of the research topic.
With an aim of researching beyond the usual jurisdiction, the author focuses on the Developed market, Frontier market, Emerging market and some other selected countries, laying emphasis on funds domicile in the United Kingdom, United States of America mutual as developed market, European fund market, Germany funds and emerging market funds and Nigeria as the Frontier Market. Nigeria could also be classified as an Emerging Market.
The research material has been acquired by reviewing existing literature and collection of secondary data.
3.2.1 Data Collection Secondary Data Collection:
Secondary data was collected using the Bloomberg terminal to create a quantitative analysis. In addition, reports from articles, journals, previous research topics relating to the research focus were consulted.
The data collected were of top performing mutual funds using the Bloomberg fund ranking by location.
The author collected twelve (12) mutual fund data from United Kingdom, ten (10) each from United States of America, Germany, Europe (European funds), emerging market and five(5) in Nigeria as a result of limitation in the availability of data in Nigeria. Data from the United States of America, emerging markets were obtained in dollars. Other countries data were collected in their home currencies. All the data collected can be found in appendix 7.
U1218076
[image:46.595.211.461.91.253.2]Page 46
Figure 0.2: Percentage of world mutual fund assets (Source: Worldwide
Mutual Fund Assets And Flows First Quarter 2013 Report from Investment Company Institute)
According to the chart on Figure 3.2, almost 40 percent of mutual fund assets worldwide were held in equity funds at the end of the first quarter of 2013. 26 percent of the asset share is allocated to the bond funds and 12 percent of the asset share is allocated to balanced/mixed funds was 12 percent. Money market fund assets are represented by 17 percent of the worldwide total.
In addition, data on relative index were also gathered in order to create the benchmark to which the portfolio of fund s will be compared. The stock market data were gathered of FTSE100, S&P 500, MSCI Emerging market index.
However, adjustment was made in the data collection according to ranking in that some of the funds that were pioneered within the last five years were not included in the data despite their ranking because yearly data was acquired from 2008 to 2012.
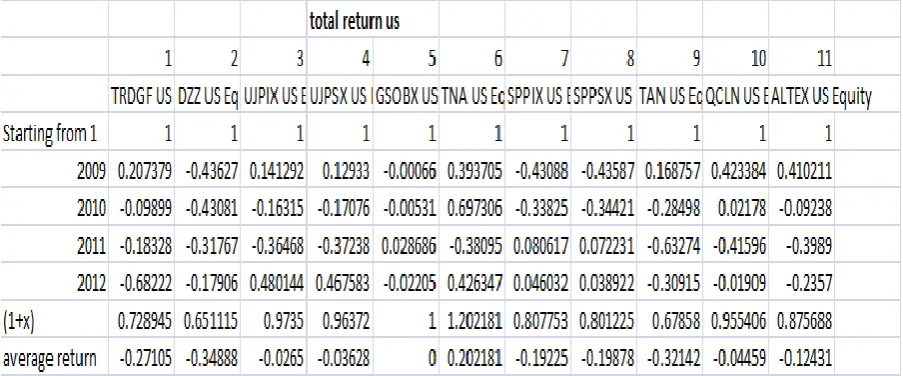
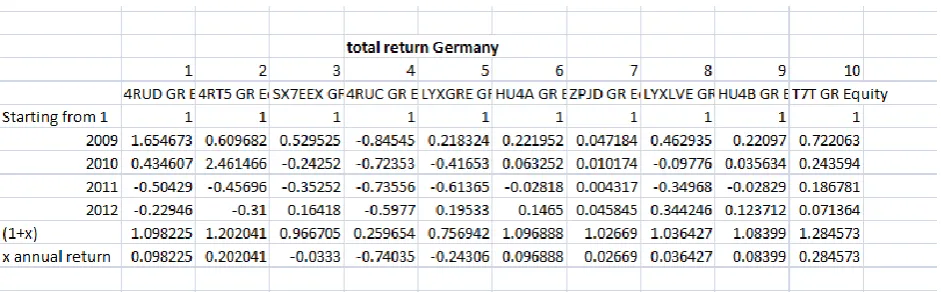
Therefore, data on yearly Total return index gross dividend was collected and average return of each mutual fund was calculated using the following formula:
Return on portfolio = (Ve Vb)/Vb
Or
(Ve/Vb) - 1
U1218076
Page 47
Vb = Beginning value of return
The objective of this data was
To make a quantitative application of Monte Carlo simulation techniques on mutual fund
To create a well structured portfolio from selected mutual funds
To analyse risk-return of such portfolios and compare with market index
To emphasize the importance of diversification in investment management
To ensure optimum funds utilization.
To determine the effectiveness of fund managers in investors return both in the short term and the long term.
To determine how realistic the portfolio risk management theory, that is Monte Carlo simulation method is in mutual fund investment.
U1218076
Page 48 Chapter 4: Result and Analysis
This analysis has been carried out to test the following hypothesis It is possible for a fund manager to outperform the market.
It is better to invest in the stock market than investing in the mutual fund.
It is more risky to invest in the market than in mutual funds.
The diversification effect is more effective in the mutual fund than in the stock market.
It is not worth it to invest through a fund manager.
Diversification improves the performance of funds of funds.
4.1 Data
The author collected data on UK funds, USA funds, Germany funds, European funds, Nigerian funds and emerging market funds.
4.1.1 Summary of All Funds
United Kingdom
According to Bloomberg ranking, I collected data on the following funds:
Oxford Technology Venture Capital Trust PLC (OXT: LN EQUITY),
Perpetual Income and Growth Investment Trust PLC (PLIS: LN EQUITY), TP70 VCT PLC (TPV: LN),
Henderson Opportunities Trust PLC (HOTS: LN),
Legg Mason Funds ICVC - Japan Equity Fund (LMJEBAA: LN),
Legg Mason Funds ICVC-Japan Equity Fund (LMJEQAA: LN),
Baillie Gifford Japan Trust PLC (BGFD: LN),
JPMorgan Income & Growth Investment PLC (JIGC: LN),
Scottish Equitable Baillie Gifford Japan Pension (SCEBGJP: LN),
Skandia INVESCO Japanese Small Cos Pension (SKIJSCP: LN),
INVESCO PERPETUAL Small Co and Market Investment Series - Japanese Small Co Fund (INVJSCA: LN) and
U1218076
Page 49
Oxford Technology Venture Capital Trust PLC has the highest average return over the years of study with a return of 58% while Baillie Gifford Shin Nippon PLC (BGS: LN) has the least return in the portfolio with an approximate negative return of -2.19.
Table 4.1: Table showing the total return on United Kingdom Mutual fund investment (Source: Authors compilation).
.
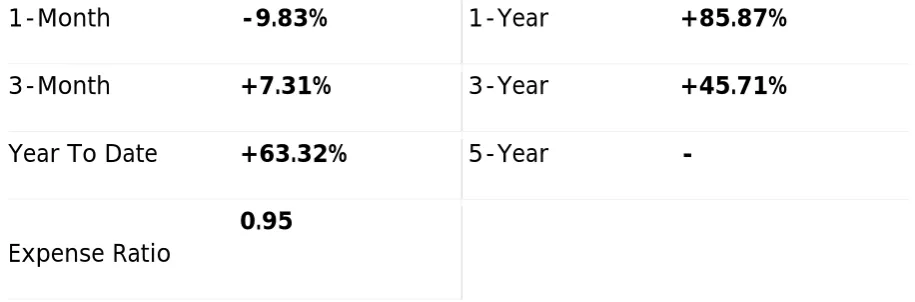
Brief overview of Oxford Technology Venture Capital Trust PLC (OXT: LN EQUITY)
Oxford Technology Venture Capital Trust plc is a closed-end equity fund domicile in the United Kingdom. The fund aims to create a portfolio composed of eligible securities towards achieving the potential return.