Maintenance Analysis using Decision Making Grid & Jack Knife
Diagram: Implementation in a DRP 500 TPD Unit
Ramesh Ku Pandey
1Dr. R. K. Dwivedi
21
M. Tech Student
2Associate Professor
1,2
Department of Mechanical Engineering
1,2
MANIT, Bhopal, Madhya Pradesh, India
Abstract— The paper discusses about the various methods of optimization in equipment maintenance. Greater attention is paid to methods of decision making strategy in maintenance and priority based maintenance. Decision making Grid is used as a bi-criteria decision making tool followed by priority based maintenance using Jack Knife Diagram. Besides, an analysis on the shutdown repairs of a DRP unit within the premises of JNIL, Raipur is also done.
Keywords: DMG, JKD, ELECTRE, TOPSIS, GA, SHELO, LUMS
I. INTRODUCTION
British Standards. BS 3811 (1984) defines maintenance as: “The combination of technical and associated administrative actions intended to retain an item in, or restore it, to a state in which it can perform its required function”. Thus, an optimization needs to be achieved in order to utilize available resources optimally. Such an optimization can be accomplished by the aid of various mathematical, logical, or empirical models, as seen from the work of researchers, with varying parameters taken into consideration. Some of such optimization models have been discussed in this paper.
A. Former studies on multi criteria decision making using DMG
Arash Shahin et al[1] improved DMG by recognizing interdependence among failures. In this grid, decision making was performed based on two indicators of Mean Time to Repair (MTTR) and frequency of failures. Fault Tree Analysis and Reliability Block Diagram had been applied for improving DMG. The proposed approach has been examined on eight equipment of the steel making and continuous casting plant of Mobarakeh Steel Company
Turuna seecharan et al[2]compared DMG & JKD methods, using case studies, to allocate maintenance strategies while prioritizing performance based on frequency and downtime or Mean Time to Repair: the Decision Making Grid (DMG) and Jack-Knife Diagram ( JKD)
Findings-JKD- Used to rank machines
DMG- Used to determine maintenance strategy
Calvin Stephen et al.[3] proposed the usage of a hybrid of techniques as complementary tools in decision analysis for learning from failures and the reason behind systems failure. The literature demonstrated the applicability of these tools through an aviation case study, where an accident investigation report was obtained from the Directorate of Accident Investigation in the Ministry of Transport and Communications in Botswana to provide as a basis for the application of the model. The report included all the factual information required to carry out the investigation using the hybrid of FTA, RBD, AHP, HoQ and the DMG tools.
Findings -The ZS-CME serious incident has been investigated using the proposed model which showed that the causal factors number 3(Design object debris) and 4(design error) should be given high priority when devising preventive measures as they fall in the high safety Impact and high probability of re-occurrence cell in the modified DMG. The results from the HoQ indicates that even though event 3 and 4 are given the same priority in the DMG event 4 should be given the utmost priority as it has a high value of relative importance. For Indirect causes, the modified DMG shows that event 7(unserviceable runway sweeper) needs more priority as compared to event 6(unserviceable PA system) because it falls under the high probability of re-occurrence region as compared to high safety Impact region. This is so because the AHP model for indirect causes of the failure have been awarded a high weight to probability of re-occurrence rather than safety impact, as it is the case with direct causes
Arash Shahin et al[4]proposed an innovative solution for determining proactive maintenance tactics based on mean time between failures (MTBF) and mean time to repair (MTTR) indicators. First, the influence of MTTR and MTBF indicators on proactive maintenance tactics was computed. The tactics included risk-based maintenance (RBM), reliability-centered maintenance (RCM), total productive maintenance (TPM), design out maintenance (DOM), accessibility-centered maintenance (ACM) and business-centered maintenance (BCM). Then, the tactics were allocated to the cells of a DMG with MTTR and MTBF axes. The proposed approach was examined on 32 pieces of equipment in oxygen workshop of the Esfahan Steel Company (ESCO) and appropriate maintenance tactics were consequently determined.
Findings - DOM, BCM, RBM and ACM tactics with weights of 0.86, 0.94, 0.68 and 1.00 were located at the corners of the DMG, respectively. The two remaining tactics of TPM and RCM were located at the middle corners. Also, the results indicate that the share of tactics per spotted equipment in the grid as 62, 22 and 16 percent for RCM, DOM and BCM, respectively
Alberto Martinetti et al.[5] proposed a framework to provide a structured method of determining a scalable maintenance program for UAS based on an RCM approach. Besides this, the scaling approach was realized on a three level analysis. It allows UAS manufactures to determine maintenance policies for the most critical components first, which can later be expanded to less critical components, identifying and prioritizing different aspects of the maintenance program
specifically the subsystem level with the component level. This study will also help to extend CBM policy solutions, exploring feasible data acquisition techniques and new analysis domains in the physical degradation models of the components
Eleonora Bottani et al.[6] focussed on main topics of maintenance, an empirical methodology based on responses to various questionnaire set
Findings-Maintenance policies varied as per the size and responsiveness of clusters in Italy
Hani Shafeek [7] established relationships between maintenance, management, maintenance practices and maintenance improvement on the basis of 15 maintenance areas by the aid of maintenance management questionnaire design and testing method.
Findings-Using the maintenance management system in the cement industry, it was possible to measure and improve about 15 percent maintenance performance which can be achieved by enhancing maintenance in the suggested areas.
Hamid Reza et al.[8] Determined optimal replacement threshold and optimal inspection interval for an item subjected to condition-based maintenance (CBM) . A trade-off between cost of inspection and reduction in failure cost it may yield.
Findings-The mathematical formulation required for the determination of optimal replacement threshold and optimal inspection interval for an item subjected to CBM under the assumption of non-decreasing failure cost is provided
Behnam Emami-Mehrgani et al.[9] advocated the influence of human error on lockout/tagout as well as on preventive maintenance activities. Numerical methods were used to obtain machine age-dependent optimal control policies (production and preventive maintenance rates with lockout/tagout). Numerical examples and sensitivity analysis were presented to illustrate the usefulness of the proposed approach. The system capacity was described by a finite-state Markov chain.
Findings-Demonstrated clearly that human error during maintenance activities can increase the production cost while reducing the safety of workers.
Marina Marinelli et al[10] presented an artificial neural network (ANN) model that predicts earthmoving trucks condition level using predictors like capacity, age, Kms. travelled and maintenance level
Findings- Predictive accuracy was outstanding; 36 out of 38 cases or 94.7 percent .Thus, the model’s performance at the three condition levels reached 92.3, 93.8 and 100 percent, respectively
Piyush Gupta et al.[11] Proposed a digraph model to evaluate the annual maintenance budget (AMB) for a plant system as a percentage of its asset replacement value (ARV).
Findings- AMB found to be 3.5% of ARV Alessio Ishizaka et al.[12] developed ELECTRE-SORT,a new sorting method that was able to consider an unlimited number of criteria in order to assign machines to incomparable strategies. A case study illustrates that ELECTRE-SORT provides more precise and flexible maintenance strategies than the Decision Making Grid.
Hussan S. Al-Chalabi et al.[13] analyzed and compared the downtime of four drilling machines used in two underground mines in Sweden. The downtime of these machines was compared to show what problems affect downtime and which strategies should be applied to reduce it. The study collects failure data from a two-year period for four drilling machines and performs reliability analysis. It also performs downtime analysis utilizing a log-log diagram with a confidence interval.
Findings –. The downtime analysis of drilling machines showed a significant difference between the three machines used in same mine (mine Y) in the downtime of components A (rock drill), C (hoses) and E (boom). There was no significant difference between these machines in the downtime of component D (accumulators). The analysis also found differences in the downtime of components B (feeder) and F (cables). Components A and B used in mine X had less downtime than the same components used in the machines of mine Y, most probably as a result of the differences in the rock properties between the two mines. There was a significant difference in the downtime of component G (steering system) found in machines used within a single mine and across mines. In contrast, there was no significant difference in the downtime of component I (hydraulics) found in machines 1 and 2 used in different mines
Yeh Lam [15] introduced the GP and its application to maintenance model. Assumed that a replacement policy N was applied by which the system would be replaced by a new, identical one following the Nth failure
Findings- The literature presented the model for a system that is deteriorating due to the internal cause, the ageing effect or accumulated wear
Xufeng Zhao et al.[14] advocated that each job causes some damage to the system and these damages are additive, and the system fails when the total damage has exceeded a failure level K. Hence, used techniques of cumulative damage models, the maintenance is made at the N-th completion of working time for the first model and at a damage level Z with a limit number of working times N for the second model
Findings-The system is maintained at the first completion of the working time over time T for the third model. The system fails with probability p(x) when the total damage is x and undergoes minimal repair at failure for the fourth model. The expected cost rates are obtained and optimal maintenance policies are discussed analytically and computed numerically. Consequentlly, four maintenance policies for an operating system which works at successive random times for jobs, where the system fails due to damage that can be additive caused by jobs
Xiaojun Zhou et al.[17] developed a dynamic opportunistic preventive maintenance model for a multi- component system with considering changes in job shop schedule. Whenever a job is completed, preventive maintenance opportunities arise for all the components in the system. An optimal maintenance practice is dynamically determined by maximizing the short-term cumulative opportunistic maintenance cost savings for the system
the other two maintenance models. This implies that the proposed model is effective in the PM optimization for multi-component systems under changing job shop schedule
Kamran S. Moghaddam et al.[19] presented mathematical models and a solution approach to determine the optimal preventive maintenance schedules for a repairable and maintainable series system of components with an increasing rate of occurrence of failure (ROCOF). The cases of minimizing total cost subject to a constraint on system reliability, and maximizing system reliability subject to a budgetary constraint on overall cost have been modeled. A dynamic programming combined with branch-and-bound method is utilized and the effectiveness of the approach is presented through the use of a numerical example
Findings-Two non-linear mixed-integer
optimization models were used for preventive maintenance and replacement scheduling of multi-component systems. These models seek to minimize the total cost subject to achieving some minimal reliability and maximize the total reliability of the system subject to a budgetary constraint. the complexity of the models with hundreds of components and/or periods can be dealt using heuristic and meta-heuristic procedures
Nafisah Aslam Zainuddin et al.[20] advocated the applicability of the Decision Making Grid (DMG) and its usefulness, in practice, in the maintenance of rolling stock in the railway industry. The Class 319 fleet operated by First Capital Connect (FCC) was used to demonstrate the application of the DMG.The level of use of the data recorded in the CMMS, in the decision making process for reviewing, and updating the maintenance policy, was established through discussions with senior management at FCC. Available decision support systems were then researched, with emphasis on the DMG concept. The advantages of using the DMG and its application in the real world using data for the Class 319 fleet were then explored and discussed
Findings – This paper advocated the value in applying the DMG concept in the decision-making process for prioritizing systems and the work that should be done to ensure the maintenance policy takes into account the performance of the units of rolling stock against the most important criteria for FCC. Through the research carried out, it was established that the existing CMMS already records the data required for the application of the DMG, although in itself, the CMMS does not have any decision support capabilities. This paper, thus, explores the use of the DMG concept to demonstrate the use of data recorded in the CMMS to develop a more effective maintenance policy and to determine exactly which maintenance activities need to be carried out in order to remedy the worst performing systems in terms of the most important criteria as identified by the business
R. Pascual et al. [22] proposed the usage of a hybrid of techniques as complementary tools in decision analysis for learning from failures and the reason behind systems failure. Findings-They demonstrated the applicability of these tools through an aviation case study, where an accident investigation report was obtained from the Directorate of Accident Investigation in the Ministry of Transport and Communications in Botswana to provide as a basis for the application of the model. The report included all the factual
information required to carry out the investigation using the hybrid of FTA, RBD, AHP, HoQ and the DMG tools.
Hajime Yamashina et al.[29] developed a cost-optimized after-sales strategy for the maintenance of an elevator part. First, in order to find an optimum maintenance method, the replacement probability and the inspection probability of the part are theoretically derived using each of the three maintenance methods: Time Based Maintenance (TBM), Condition Based Maintenance (CBM), and Breakdown Maintenance (BM). Then, the approach to plan a cost-optimized maintenance method is presented and the relationship between the failure characteristics of the part and the cost-optimized maintenance method is discussed. The results of using the proposed approach are compared with those obtained by Online Quality Engineering (Taguchi methods)
Findings- The maintenance method with minimum maintenance cost was achieved.
A.Pillay et al.[30] suggested that Delay time = time between 1st identification of abnormalities and the actual failure time. Proposed approach was shown by a flowchart Findings- The example of brake seal failure, with the integration of delay –time the % of failures going unnoticed is expected to be as low as 5% to 10 % depending on the probability density function used(pdf). Weibull and standard normal distribution gave optimum, exponential distribution – not very useful
Peter F. Knights[32] advised an alternative method for analyzing equipment downtime and repair costs using logarithmic scatter plots. By applying limit values, log scatter plots can be divided into four quadrants enabling failures to be classified according to acute or chronic characteristics and facilitating root cause failure analysis. Besides this, Knights provided examples of practical application of log scatter plots by a number of mining companies and mining equipment suppliers in Chile.
Findings- Log scatter plots permit the identification of frequently occurring failures that consume relatively little repair cost or downtime, yet cause frequent operational disturbances leading to production losses. In addition, by graphing the trend of failure data over successive time periods log scatter plots provide a useful visual means of evaluating the performance of maintenance improvement initiative Similarly, different researchers across the world have used different methods in optimization of maintenance procedure. Thus, the figures in the following table represents the number of papers published on various maintenance optimization techniques since 2000.
O EE
TOP SIS
SHE LO
G
A JK
D D M G
A N N
ELEC TRE
LU MS
17 19 6 2
[image:3.595.309.550.620.677.2]0 1 8 5 4 19
Fig. 1: Trend in techniques used by researchers to optimize maintenance programs
B. Analysis of shut down repairs of a DRP-500 TPD using Decision Making Grid
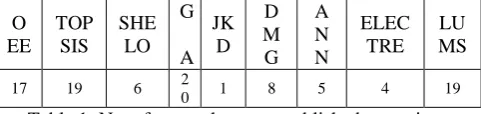
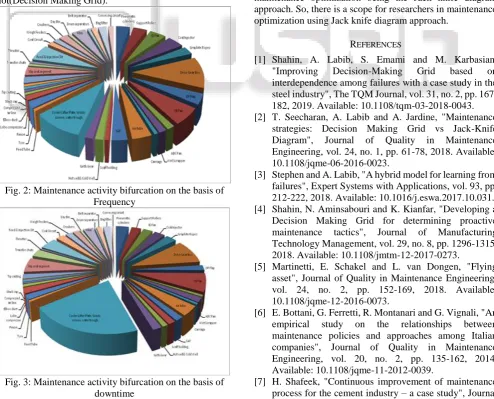
The graphs in the subsequent parts represent the analysis on shut down repairs that were held within a time spanning from December 2017 to November 2018. Figure 2 represents the bifurcation in the maintenance activity on the basis of failure frequency. Figure 3 represents the bifurcation in the maintenance activity on the basis of downtime. Figure 4 represents the maintenance strategy to be followed on the failure codes indicated as numerals inside the Scatter Plot(Decision Making Grid).
[image:4.595.311.544.64.247.2]Fig. 2: Maintenance activity bifurcation on the basis of Frequency
[image:4.595.52.547.370.769.2]Fig. 3: Maintenance activity bifurcation on the basis of downtime
Fig. 4: Decision Making Grid
II. CONCLUSIONS
Researchers have given their contribution in this field from time to time but to predict the present trend papers only after 2000 have been considered. Fig.-1 represents the current favorite of researchers in optimization. Thus, a total of 99 papers have been considered. The GA technique stands the highest with around 20% followed by LUMS(Lean Tool) method with around 19%. The least researched technique in maintenance optimization being the Jack knife diagram approach. So, there is a scope for researchers in maintenance optimization using Jack knife diagram approach.
REFERENCES
[1] Shahin, A. Labib, S. Emami and M. Karbasian, "Improving Decision-Making Grid based on interdependence among failures with a case study in the steel industry", The TQM Journal, vol. 31, no. 2, pp. 167-182, 2019. Available: 10.1108/tqm-03-2018-0043. [2] T. Seecharan, A. Labib and A. Jardine, "Maintenance
strategies: Decision Making Grid vs Jack-Knife Diagram", Journal of Quality in Maintenance Engineering, vol. 24, no. 1, pp. 61-78, 2018. Available: 10.1108/jqme-06-2016-0023.
[3] Stephen and A. Labib, "A hybrid model for learning from failures", Expert Systems with Applications, vol. 93, pp. 212-222, 2018. Available: 10.1016/j.eswa.2017.10.031. [4] Shahin, N. Aminsabouri and K. Kianfar, "Developing a
Decision Making Grid for determining proactive maintenance tactics", Journal of Manufacturing Technology Management, vol. 29, no. 8, pp. 1296-1315, 2018. Available: 10.1108/jmtm-12-2017-0273.
[5] Martinetti, E. Schakel and L. van Dongen, "Flying asset", Journal of Quality in Maintenance Engineering, vol. 24, no. 2, pp. 152-169, 2018. Available: 10.1108/jqme-12-2016-0073.
[6] E. Bottani, G. Ferretti, R. Montanari and G. Vignali, "An empirical study on the relationships between maintenance policies and approaches among Italian companies", Journal of Quality in Maintenance Engineering, vol. 20, no. 2, pp. 135-162, 2014. Available: 10.1108/jqme-11-2012-0039.
[image:4.595.50.304.377.760.2]of Quality in Maintenance Engineering, vol. 20, no. 4, pp. 333-376, 2014. Available: 10.1108/jqme-07-2013-0047.
[8] H. Reza Golmakani and M. Pouresmaeeli, "Optimal replacement policy for condition-based maintenance with non-decreasing failure cost and costly inspection", Journal of Quality in Maintenance Engineering, vol. 20, no. 1, pp. 51-64, 2014. Available: 10.1108/jqme-12-2012-0044.
[9] Emami-Mehrgani, S. Nadeau and J. Kenné, "Optimal lockout/tagout, preventive maintenance, human error and production policies of manufacturing systems with passive redundancy", Journal of Quality in Maintenance Engineering, vol. 20, no. 4, pp. 453-470, 2014. Available: 10.1108/jqme-10-2012-0035.
[10]M. Marinelli, S. Lambropoulos and K. Petroutsatou, "Earthmoving trucks condition level prediction using neural networks", Journal of Quality in Maintenance Engineering, vol. 20, no. 2, pp. 182-192, 2014. Available: 10.1108/jqme-09-2012-0031.
[11]P. Gupta, S. Gupta and O. Gandhi, "Annual maintenance budget estimation for a plant system", Journal of Quality in Maintenance Engineering, vol. 20, no. 2, pp. 193-210, 2014. Available: 10.1108/jqme-04-2013-0015.
[12]Ishizaka and P. Nemery, "Assigning machines to incomparable maintenance strategies with ELECTRE-SORT", Omega, vol. 47, pp. 45-59, 2014. Available: 10.1016/j.omega.2014.03.006.
[13]H. S. Al-Chalabi, J. Lundberg, A. Wijaya and B. Ghodrati, "Downtime analysis of drilling machines and suggestions for improvements", Journal of Quality in Maintenance Engineering, vol. 20, no. 4, pp. 306-332, 2014. Available: 10.1108/jqme-11-2012-0038.
[14]Van Horenbeek and L. Pintelon, "Development of a maintenance performance measurement framework— using the analytic network process (ANP) for maintenance performance indicator selection", Omega, vol. 42, no. 1, pp. 33-46, 2014. Available: 10.1016/j.omega.2013.02.006.
[15]Y. Lam, "A geometric process maintenance model and optimal policy", Journal of Quality in Maintenance Engineering, vol. 19, no. 1, pp. 50-60, 2013. Available: 10.1108/13552511311304474.
[16]X. Zhao, S. Nakamura and T. Nakagawa, "Optimal maintenance policies for cumulative damage models with random working times", Journal of Quality in Maintenance Engineering, vol. 19, no. 1, pp. 25-37, 2013. Available: 10.1108/13552511311304456. [17]X. Zhou, Z. Lu and L. Xi, "Preventive maintenance
optimization for a multi-component system under changing job shop schedule", Reliability Engineering & System Safety, vol. 101, pp. 14-20, 2012. Available: 10.1016/j.ress.2012.01.005.
[18]M. Fitouhi and M. Nourelfath, "Integrating noncyclical preventive maintenance scheduling and production planning for a single machine", International Journal of Production Economics, vol. 136, no. 2, pp. 344-351, 2012. Available: 10.1016/j.ijpe.2011.12.021.
[19]K. Moghaddam and J. Usher, "Preventive maintenance and replacement scheduling for repairable and
maintainable systems using dynamic
programming", Computers & Industrial Engineering, vol. 60, no. 4, pp. 654-665, 2011. Available: 10.1016/j.cie.2010.12.021.
[20]N. Aslam‐Zainudeen and A. Labib, "Practical application of the Decision Making Grid (DMG)", Journal of Quality in Maintenance Engineering, vol. 17, no. 2, pp. 138-149, 2011. Available: 10.1108/13552511111134574.
[21]R. Pascual, G. Del Castillo, D. Louit and P. Knights, "Business-oriented prioritization: A novel graphical technique", Reliability Engineering & System Safety, vol. 94, no. 8, pp. 1308-1313, 2009. Available: 10.1016/j.ress.2009.01.013.
[22]K. Liang, "Optimizing unilever's capital and emergency spare stocksizes", Undergraduate, Department of Mechanical and Industrial Engineering.
[23]Lapa, C. Pereira and M. de Barros, "A model for preventive maintenance planning by genetic algorithms based in cost and reliability", Reliability Engineering & System Safety, vol. 91, no. 2, pp. 233-240, 2006. Available: 10.1016/j.ress.2005.01.004.
[24]J. Duarte, J. Craveiro and T. Trigo, "Optimization of the preventive maintenance plan of a series components system", International Journal of Pressure Vessels and Piping, vol. 83, no. 4, pp. 244-248, 2006. Available: 10.1016/j.ijpvp.2006.02.016.
[25]O. Fernandez, A. Labib, R. Walmsley and D. Petty, "A
decision support maintenance management
system", International Journal of Quality & Reliability Management, vol. 20, no. 8, pp. 965-979, 2003. Available: 10.1108/02656710310493652.
[26]H. Yamashina and S. Otani, "Optimal preventive maintenance planning for multiple elevators", Journal of Quality in Maintenance Engineering, vol. 7, no. 2, pp.
128-150, 2001. Available: