Copyright © 2001, American Society for Microbiology. All Rights Reserved.
Replicate PCR Testing and Probit Analysis for Detection and
Quantitation of
Chlamydia pneumoniae
in
Clinical Specimens
M. SMIEJA,1* J. B. MAHONY,1,2C. H. GOLDSMITH,3S. CHONG,1A. PETRICH,1,2 ANDM. CHERNESKY1,2
Hamilton Regional Laboratory Medicine Programme1and Departments of Pathology and Molecular Medicine2and
Clinical Epidemiology and Biostatistics,3McMaster University, Hamilton, Ontario, Canada
Received 28 July 2000/Returned for modification 27 November 2000/Accepted 5 March 2001
Nucleic acid amplification of clinical specimens with low target concentration has variable sensitivity. We examined whether testing multiple aliquots of extracted DNA increased the sensitivity and reproducibility of Chlamydia pneumoniaedetection by PCR. Nested and non-nestedC. pneumoniaePCR assays were compared using 10 replicates of 16 serial dilutions ofC. pneumoniaeATCC VR-1310. The proportion positive versus the C. pneumoniaeconcentration was modeled by probit regression analysis. To validate the model, 10 replicates of 26 previously positive patient specimens of peripheral blood mononuclear cells (PBMC), sputum, or nasopharyngeal swabs (NPS) were tested. The proportion of replicates that were positive varied with the concentration ofC. pneumoniaein the sample. At concentrations above 5 infection-forming units (IFU)/ml, both nested and non-nested PCR assay sensitivities were 90% or greater. The nested PCR was more sensitive (median detection, 0.35 versus 0.61 IFU/ml; relative median detection, 0.58; 95% confidence interval, 0.31 to 0.99;Pⴝ0.04). In clinical specimens, replicate PCR detected 15 of 26 (nested) versus 1 of 26 (non-nested,P< 0.001). For PBMC specimens, testing 1, 3, or 5 replicates detected 3, 5, or 9 of 10 positive specimens, respectively. Median C. pneumoniaeconcentrations were estimated at 0.07 IFU/ml for PBMC and at <0.03 IFU/ml for NPS specimens. We conclude that performing 5 or 10 replicates considerably increased the sensitivity and reproducibility ofC. pneumoniaePCR and enabled quantitation for clinical specimens. Due to sampling variability, PCR tests done without replication may miss a large proportion of positive specimens, particularly for specimens with small amounts of targetC. pneumoniaeDNA present.
Controversy surrounds the association ofChlamydia
pneu-moniaewith atherosclerotic heart disease (7, 9, 18), asthma (1,
10), multiple sclerosis (11, 22), and Alzheimer’s disease (8, 16, 19), primarily because of the lack of a definitive test for de-tecting C. pneumoniae. Culture is performed successfully by few laboratories and was much less sensitive than PCR for detection in vascular tissue (13). Serology has been considered the “gold standard” for the diagnosis of infection (12) but did not correlate with the presence of C. pneumoniae DNA or antigen in tissue (5, 13, 17). A superior marker of current or recent infection is required to clarify the clinical importance of
C. pneumoniaeinfection in chronic diseases such as
atheroscle-rosis.
Nucleic acid amplification tests such as PCR enable the detection of low concentrations of organism in clinical speci-mens. However, great variability of detection has been re-ported. For atherosclerotic tissue, reports of between 0 and 100% detection have been published, as recently summarized (3, 13). Similarly, the prevalence ofC. pneumoniae DNA in peripheral blood mononuclear cells (PBMC) varied between 9% (27) and 59% (4) among patients with proven atheroscle-rotic heart disease. Some of this discrepancy may be attribut-able to differences between assays, but sampling variability is
an alternative explanation. Whether replicate testing improves sensitivity or reproducibility has not, to our knowledge, been systematically examined forC. pneumoniaenucleic acid ampli-fication tests.
In a previous study, we compared fiveC. pneumoniaePCRs for both analytical and clinical sensitivity (15), and we noted a major discrepancy between the tests. Despite relatively similar analytical test sensitivities, only the nested PCR based on the
ompAgene (23) routinely detected a number of PBMC posi-tives. We hypothesized that sampling variability as well as differences in PCR performance explained the results, and we inferred that clinical specimens had low concentrations of
C. pneumoniaeDNA.
We test here these hypotheses with probit regression anal-ysis. Specifically, we sought to determine the following. (i) Can replicateC. pneumoniaePCR increase test sensitivity over test-ing a stest-ingle time (analytical sensitivity)? (ii) Does replicate testing increaseC. pneumoniaedetection in clinical specimens (clinical sensitivity)? (iii) Can probit analysis quantitateC.
pneu-moniaein clinical specimens?
MATERIALS AND METHODS
PCR methods.A comparison of five PCRs forC. pneumoniaewas previously described (15), and two of these PCRs—a nested (23) and a non-nested proce-dure (6)–were used in this study. Samples (200l) of laboratory-cultured strains or clinical specimens (see details below) were extracted using QIAamp DNA Mini-Kits (Qiagen, Mississauga, Ontario, Canada) following a tissue or blood extraction protocol and eluted in 100l of buffer. PCR was performed on 2.5-l purified DNA samples in a total volume of 25l. The components of the reaction mixture and thermocycling conditions were previously described by Campbell et
* Corresponding author. Mailing address: Laboratory Medicine L424, St. Joseph’s Hospital, 50 Charlton Ave. East, Hamilton ON L8N 4A6, Canada. Phone: 905-522-1155 (5140). Fax: 905-521-6083. E-mail: [email protected].
1796
on May 15, 2020 by guest
http://jcm.asm.org/
al. (6) for the non-nested PCR and by Tong and Sillis (23) for the nested PCR. The non-nested procedure consisted of 40 rounds and amplified a 437-bp cloned
PstI fragment. The nested PCR consisted of 40 rounds of amplification of a 333-bp fragment of theompAgene, followed by 30 rounds of amplification of a 207-bp internal fragment. AmpliTaq Gold (Perkin-Elmer, Branchburg, N.J.) was used for all amplifications. All amplification products were analyzed by 2% (wt/vol) agarose gel electrophoresis followed by ethidium bromide staining. Stringent procedures to minimize or detect contamination included extraction and amplification in separate rooms after changing gloves and lab coats, use of plugged pipette tips and positive displacement pipettors, and insertion of at least one blank every 5 to 10 tubes. Every fifth blank was left open during specimen addition to detect aerosol contamination.
Dilution series ofC. pneumoniae.C. pneumoniaeATCC VR-1310 was cultured in U-937 human mononuclear cells for 40 to 48 h and then spiked into a repeatedly negative volunteer-derived PBMC fraction (CPT tube; BD Vacu-tainer Systems, Franklin Lakes, N.J.). In PCR replicates of two, serial 10-fold dilutions were tested to establish an upper threshold (all tests positive) and lower thresholds (all tests negative) of test sensitivity as 4 inclusion forming units (IFU)/ml (0.01 IFU/2.5-l PCR) and 0.04 IFU/ml (0.0001 IFU/2.5-L PCR), respectively. For each of the non-nested and nested PCRs, we performed 10 replicates of six dilutions between 4 and 0.04 IFU/ml and, at a separate time, 10 replicates of 10 dilutions between 4 and 0.008 IFU/ml. The final probit regression model included data from both of these two dilution series (total of 160 tests for each of the nested and non-nested PCRs).
Clinical validation.For the clinical validation set, 26 clinical specimens (each from unique patients) were tested in 10 replicates by both PCR assays (total of 520 PCR tests): 10 PBMC specimens from patients undergoing elective coronary angiography, 6 pediatric and 8 adult nasopharyngeal specimens (NPS) from patients with acute respiratory symptoms, and 2 sputum specimens from adults with chronic airway limitation. A patient’s specimen was considered positive if one or more of the 10 individual determinations were positive. All specimens were previouslyC. pneumoniaepositive in at least one of three replicates using the nested PCR and were confirmed by Southern blotting and oligonucleotide hybridization withC. pneumoniae-specific probe.
Statistical methods.The relationship between the proportion positive from each replicate of 10 and the corresponding log concentrations ofC. pneumoniae
was examined using probit regression analysis (SPSS for Windows 10.0; SPSS, Inc., Chicago, Ill.). Using the probit model, the two tests were compared, the median detection concentration ofC. pneumoniaewas estimated, and the con-centrations corresponding to probits of 0.01 to 0.99 were calculated. Proportions were tested with StatXact version 3.02 (Cytel Software Corp., Cambridge, Mass.). APvalue of⬍0.05 was taken as statistically significant (two tailed). The relationship between replicate number and test sensitivity was calculated in Excel 97 (Microsoft Corp., Redmond, Wash.), using the calculated probit at a given concentration and the following formula: probability of at least one positive inn
replicates⫽1⫺(1⫺probit)n. To estimate medianC. pneumoniaeconcentration in clinical specimens, the concentration corresponding to the observed propor-tion positive of 10 replicates was interpolated from the nested PCR probit analysis table.
RESULTS
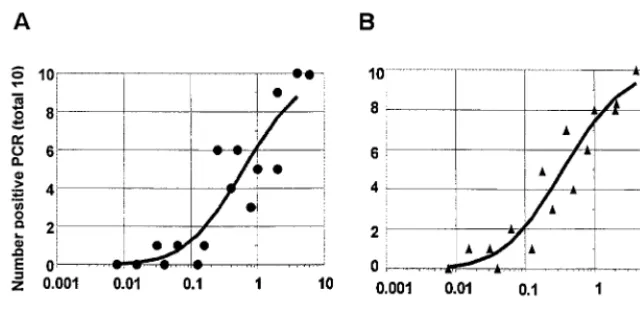
Constructing probit regression models.Separate probit re-gression curves were constructed for the non-nested and nested PCR assays using data from 10 replicates each of 16 dilutions of culture-grown C. pneumoniae ATCC VR-1310. Figure 1 shows the relationships between the number of pos-itives at each dilution and the concentration ofC. pneumoniae
for the non-nested and nested PCRs. The circles (non-nested, panel A) or triangles (nested, panel B) represent the number of positive results from the 10 replicates at each concentration
ofC. pneumoniae, and the solid line represents the fitted probit
regression line for the assay. At a concentration of 4 IFU/ml, both PCRs detected all 20 replicates as positive. At a concen-tration of 1 IFU/ml, the non-nested PCR detected 5 of 10 versus 8 of 10 for the nested PCR; and at a concentration of 0.1 IFU/ml, the non-nested PCR detected 0 of 10 versus 1 of 10 for the nested PCR.
The SPSS statistical program generated the probit (predict-ed proportion positive) versus the C. pneumoniae concentra-tion with 95% confidence intervals (CI) shown in Table 1. For example, for the nested PCR, a concentration of 0.15 IFU/ml was associated with a probit of 0.30. Thus, repeated enough times, a positive result would be obtained in 30% of replicates. Conversely, at a concentration of 5 IFU/ml or greater, 9 of 10 replicates would be expected to be positive with either PCR, and a single PCR determination would be positive 90 to 95% of the time.
[image:2.612.145.465.70.226.2]In Table 1 and Fig. 2, the probit models for the non-nested and nestedC. pneumoniaePCRs were directly compared. The nested PCR regression line (triangles) is shifted up and to the left of the non-nested PCR line (circles). For any concentra-tion ofC. pneumoniae, the probability of detection was greater with the nested PCR, and the nested PCR regression curve was statistically significantly different from the non-nested PCR curve. The predicted median detected concentrations (pro-bit⫽0.50) were 0.35 IFU/ml (nested) and 0.61 IFU/ml (non-nested) for a relative median detection of 0.58 (95% CI⫽0.31 to 0.99,P⫽0.04). Model fit was assessed and adequate [Pear-son goodness of fit2(29 df)⫽34.7,P⫽0.22; parallelism test 2(1 df)⬍0.001,P⫽1.00].
FIG. 1. Number of positives per 10 replicates versus the concentration ofC. pneumoniaeATCC VR-1310 for non-nested PCR (A) and nested PCR (B) and a regression curve determined by probit regression analysis (SPSS).
on May 15, 2020 by guest
http://jcm.asm.org/
Relationship between detection and number of replicates. For a given probit and its correspondingC. pneumoniae con-centration, the sensitivity of replicate testing and the number of replicates are related. The number of replicates needed for various probits of 0.01 to 0.99, to achieve an overall test sen-sitivity of 50, 80, 90, or 95%, were calculated using the nested
C. pneumoniae PCR data (Table 2). For example, for a C.
pneumoniae concentration of 0.35 IFU/ml (probit of 0.50), a
single PCR determination has 50% sensitivity, a three-repli-cate assay would detect at least one positive with 80% sensi-tivity, a four-replicate assay with 90% sensisensi-tivity, and a five-replicate assay with 95% sensitivity. At lower concentrations, more replicates are required for a given overall test sensitivity. At 0.05 IFU/ml (probit 0.10), a single test achieves 10% sen-sitivity, compared with 7 replicates (50% sensitivity), 16 repli-cates (80% sensitivity), or 29 replirepli-cates (95% sensitivity).
Con-versely, at ⬎5 IFU/ml, a single PCR determination is 95% sensitive for detectingC. pneumoniae, and replicates would not increase sensitivity further.
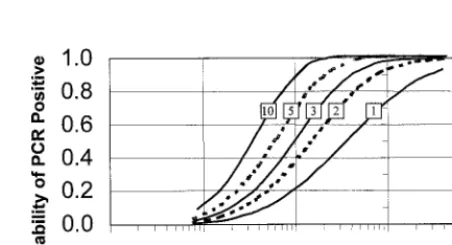
In Fig. 3, the relationship between increasing number of replicates and overall test sensitivity is presented in graphical form, with the curve for the 10 replicate PCR curve on the far left and that for a single PCR on the far right. At higherC.
pneumoniaeconcentrations, repeating the sample increases the
test sensitivity very little. At a lower concentration of 0.1 IFU/ ml, a single PCR is 20% sensitive, compared with 40% for duplicate PCRs, 50% for replicates of 3, 70% for replicates of 5, and 90% for replicates of 10.
[image:3.612.311.553.100.263.2]From the probit model, we predicted that the nested PCR would have better sensitivity than the non-nested PCR for the detection ofC. pneumoniaein clinical specimens, particularly
FIG. 2. Comparison of probit regression curves for a non-nested (F) and nested (Œ)C. pneumoniaePCR (SPSS). The probit (predicted
proportion of replicates positive) versus theC. pneumoniae ATCC VR-1310 concentration was obtained from 10 replicates of 16 dilutions (see the text).
[image:3.612.53.293.100.263.2]FIG. 3. Predicted probability of PCR positive test versus theC. pneumoniaeconcentration for nested PCR by number of replicates. Replicates of 10, 5, 3, or 2 versus single PCR illustrated from left to right. Single PCR curves obtained from probit regression analysis of 10 replicates of 16 dilutions ofC. pneumoniaeATCC VR-1310 (see text) are also shown. The remaining four curves were calculated in the spreadsheet program Microsoft Excel using the following formula: probability (at least 1 positive innreplicates)⫽1⫺(1⫺probit)n. TABLE 1. Predicted proportion of replicates that were positive
versus theC. pneumoniaeconcentration for non-nested and nestedC. pneumoniaePCR tests
Probita C. pneumoniaeIFU/ml (95% CI) Non-nested PCRb Nested PCRc
0.01 0.02 (0.01, 0.03) 0.01 (0.003, 0.02) 0.05 0.05 (0.02, 0.08) 0.03 (0.01, 0.05) 0.10 0.08 (0.04, 0.13) 0.05 (0.02, 0.08) 0.15 0.12 (0.07, 0.18) 0.07 (0.04, 0.11) 0.20 0.16 (0.10, 0.24) 0.09 (0.06, 0.14) 0.30 0.27 (0.17, 0.40) 0.15 (0.10, 0.23) 0.40 0.41 (0.28, 0.61) 0.24 (0.16, 0.35) 0.50 0.61 (0.42, 0.92) 0.35 (0.24, 0.52) 0.60 0.92 (0.62, 1.42) 0.53 (0.36, 0.80) 0.70 1.41 (0.94, 2.29) 0.81 (0.55, 1.28) 0.80 2.34 (1.51, 4.08) 1.34 (0.88, 2.23) 0.90 4.69 (2.82, 9.25) 2.70 (1.66, 5.12) 0.95 8.34 (4.68, 18.4) 4.79 (2.77, 10.2) 0.99 24.50 (11.9, 67.8) 14.1 (7.07, 37.3)
aProbit, predicted proportion of replicates positive from probit regression analysis (SPSS), based on 10 replicates of 16 dilutions ofC. pneumoniaeATCC VR-1310 (see the text).
[image:3.612.72.275.522.677.2]bCampbell et al. (6). cTong and Sillis (23).
TABLE 2. Relationship between the predicted number of PCR replicates needed to achieve various test sensitivities
andC. pneumoniaeconcentrations
Probita C. pneumoniaeconcn (IFU/ml)b
No. of replicates needed to achieve sensitivity ofc:
50% 80% 90% 95%
0.01 0.01 69 161 230 299
0.05 0.03 14 32 45 59
0.10 0.05 7 16 22 29
0.20 0.09 4 8 11 14
0.30 0.15 2 5 7 9
0.40 0.24 2 4 5 6
0.50 0.35 1 3 4 5
0.60 0.53 1 2 3 4
0.70 0.81 1 2 2 3
0.80 1.34 1 1 2 2
0.90 2.70 1 1 1 2
0.95 4.79 1 1 1 1
0.99 14.10 1 1 1 1
aProbit, predicted proportion of replicates positive from probit regression analysis (SPSS), based on 10 replicates of 16 dilutions ofC. pneumoniaeATCC VR-1310 (see the text).
bC. pneumoniaeATCC VR-1310 concentration as calculated from probit analysis.
cReplicates calculated in Microsoft Excel spreadsheet from the following equation: probability (at least 1 positive innreplicates)⫽1⫺(1⫺probit)n.
on May 15, 2020 by guest
http://jcm.asm.org/
[image:3.612.319.545.531.653.2]at lower concentrations of target DNA, and at these concen-trations replicates of 3, 5, or 10 would identify increasingly more specimens as positive compared with a single PCR.
Detection ofC. pneumoniaein clinical specimens.We next compared the performance of non-nested and nested PCR assays using clinical specimens. For 10 previously positive PBMC specimens from coronary angiography patients, the non-nested PCR detected a single positive only on the tenth repeat of that specimen (data not shown). In the first one, three, or five replicates, no positives were detected. For the 14 nasopharyngeal and 2 sputum specimens, no positives were detected in any of 10 replicates. In summary, the non-nested PCR identified 1 of 26 patient specimens, and 1 of 260 PCR tests, as positive.
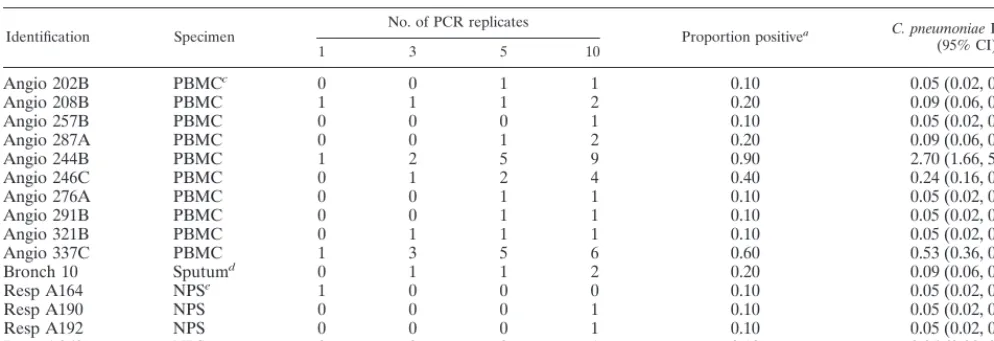
With the nested PCR, all 10 PBMC specimens were identi-fied as positive (Table 3). In the first 1, 3, or 5 replicates, 3, 5, and 9 of the 10 specimens were positive, respectively. In com-parison, for aC. pneumoniaeconcentration of approximately 0.1 IFU/ml, the probit model predicted 2, 5, and 7 positives in 1, 3, or 5 replicates, respectively (Fig. 3). One of the two sputa was positive in 2 of 10 replicates, and the second sputum was negative in all 10 replicates. The nested PCR detected 4 of 8 adult NPS specimens (Table 3, specimens Resp A164, Resp A190, Resp A192, and Resp A269) but did not detect anyC.
pneumoniaein 6 pediatric NPS specimens. In summary, the
nested PCR detected 15 of 26 clinical specimens or 34 of 260 individual PCR determinations and was superior to the non-nested PCR for the detection of C. pneumoniae (15 of 26 versus 1 of 26,P⬍0.001). Had only three replicates been done per specimen, and a definition of 1 of 3 or more asC.
pneu-moniaepositive been used, 0 of 26 non-nested and 6 of 26
nested specimens would have been positive (P⫽0.03). Quantitation of C. pneumoniae in clinical specimens. By interpolation from the probit regression analysis for the nested PCR (Table 1), estimates ofC. pneumoniaein clinical speci-mens were made (Table 3). For the 10 PBMC specispeci-mens, the
median probit was estimated at 0.15, for an interpolated con-centration of 0.07 IFU/ml (95% CI⫽0.04 to 0.11). For specific patient specimens, probits varied between 0.1 and 0.9 or 0.05 to 2.7 IFU/ml. The single positive sputum was positive in 2 of 10 replicates for a probit of 0.2 (0.09 IFU/ml, 95% CI⫽0.06 to 0.14). In four of eight adult NPS specimens, 1 of 10 replicates was positive (probit of 0.10) for an interpolated concentration of 0.05 IFU/ml (95% CI⫽0.02 to 0.08). In the remaining four adult and all pediatric NPS specimens none of the 10 replicates detectedC. pneumoniae(⬍0.03 IFU/ml). At a probit of⬍0.05, the median concentration for the nasopharyngeal specimens was⬍0.03 IFU/ml (95% CI⫽0.00 to 0.05).
DISCUSSION
We have demonstrated here that replicateC. pneumoniae
PCR markedly increased analytical sensitivity compared with performing a single PCR test. We validated the model by demonstrating that replicate testing increasedC. pneumoniae
detection in clinical specimens, particularly with the nested PCR, and that the sensitivity levels in analytical and clinical samples were consistent with the probit analysis predictions. We then used probit analysis to quantitateC. pneumoniaein clinical specimens and inferred a higher concentration ofC.
pneumoniaein PBMC compared with NPS.
The interpretation of replicate testing was facilitated by pro-bit regression analysis, which has been utilized in particular for toxicology studies. In microbiology, probit analysis has been used very rarely: we found only four references in a MED-LINE search of the literature between 1967 and 2000. Vrielink and colleagues used probit analysis to compare the diagnostic sensitivities of enzyme immunoassays for human T-cell leuke-mia virus types 1 and 2 or hepatitis C virus (24–26), and Saldanha used this regression technique to quantitate the hep-atitis C virus genome and compare PCR sensitivities (20).
[image:4.612.54.551.84.254.2]The sensitivity of a diagnostic test is often considered a TABLE 3. Nested PCR detection and quantitation ofC. pneumoniaein individual clinical specimens by number of replicates
Identification Specimen No. of PCR replicates Proportion positivea C. pneumoniaeIFN/mlb (95% CI)
1 3 5 10
Angio 202B PBMCc 0 0 1 1 0.10 0.05 (0.02, 0.08)
Angio 208B PBMC 1 1 1 2 0.20 0.09 (0.06, 0.14)
Angio 257B PBMC 0 0 0 1 0.10 0.05 (0.02, 0.08)
Angio 287A PBMC 0 0 1 2 0.20 0.09 (0.06, 0.14)
Angio 244B PBMC 1 2 5 9 0.90 2.70 (1.66, 5.12)
Angio 246C PBMC 0 1 2 4 0.40 0.24 (0.16, 0.35)
Angio 276A PBMC 0 0 1 1 0.10 0.05 (0.02, 0.08)
Angio 291B PBMC 0 0 1 1 0.10 0.05 (0.02, 0.08)
Angio 321B PBMC 0 1 1 1 0.10 0.05 (0.02, 0.08)
Angio 337C PBMC 1 3 5 6 0.60 0.53 (0.36, 0.80)
Bronch 10 Sputumd 0 1 1 2 0.20 0.09 (0.06, 0.14)
Resp A164 NPSe 1 0 0 0 0.10 0.05 (0.02, 0.08)
Resp A190 NPS 0 0 0 1 0.10 0.05 (0.02, 0.08)
Resp A192 NPS 0 0 0 1 0.10 0.05 (0.02, 0.08)
Resp A269 NPS 0 0 0 1 0.10 0.05 (0.02, 0.08)
aProportion positive of 10 PCR replicates. All 26 patient samples previously positive by at least one of three Tong and Sillis (23) PCRs.
bC. pneumoniaeconcentration as interpolated from a probit model of nested PCR of ATCC VR-1310 dilution series (Probit regression analysis, SPSS). For details, see the text.
cPBMC were from patients undergoing coronary angiography.
dInduced sputum from patients with chronic airflow limitation. One additional sputum was negative in all PCR replicates.
eNPS were from an adult with acute respiratory symptoms. An additional four adult and six pediatric NPS were negative in all PCR replicates.
on May 15, 2020 by guest
http://jcm.asm.org/
constant property, apart from some variation due to laboratory technique or specimen type. However, interpreting the probit as the test sensitivity, we demonstrated that PCR sensitivity varied between 0 and 100%, depending on theC. pneumoniae
concentration. The finding that PCR was approximately 100% sensitive above a certain threshold and 0% sensitive below a certain threshold is not surprising. What is surprising is the 100-fold interval of concentrations (between 4 and 0.04 IFU/ ml) in which PCR results were intermittently positive. Within this interval, repeat testing and probit modeling could be ex-ploited for detection and quantitation.
Our findings may have important implications for the rou-tine detection ofC. pneumoniaein clinical specimens such as blood or respiratory specimens. Conversely, the lack of recog-nition of these concentrations of intermittently positive values may yield unreliable results.
In an excellent review of the molecular diagnosis ofC.
pneu-moniae, Boman et al. discuss specimen collection, the
prepa-ration of nucleic acid from samples, the choice of gene target and primer selection, the optimal amplification conditions, and the detection of the amplification product (3). These authors briefly review sampling variation as a cause of false-negative results and discuss increasing the sample volume as a possible strategy to increase sensitivity, while acknowledging that this strategy may cause an unacceptable increase in the level of PCR inhibitors. We suggest adding the issue of PCR replicates to their list of areas where standardization is required. Readers need to know how many PCR replicates were done by a lab-oratory and how a positive specimen was operationally defined. We acknowledge two potentially serious limitations of our study: face validity and feasibility. By face validity, we refer to whether most readers or laboratory directors would have con-fidence that a single positive in 5 or 10 PCR determinations represented a true positive. At a more stringent requirement of 2 PCR positives per 10 replicates, 0 of 26 clinical specimens were positive by the non-nested PCR, and 6 of 26 specimens were positive by the nested PCR (P⫽0.03). A single positive PCR determination may represent contamination, a nonspe-cific reaction, or a true positive. We demonstrated that lower analytical concentrations were only intermittently PCR posi-tive, and this relationship was predictable from a statistical viewpoint. These results are not likely to be due to contami-nation, which would not have varied predictably with the con-centration. In addition, 0 of 200 negative controls tested with this assay by our laboratory have been positive. To ensure the specificity of the reaction, all first-time positive PCR clinical specimens were confirmed with Southern blotting and oligo-nucleotide hybridization, and 12 specimens had DNA sequenc-ing of PCR product. The results all confirmed a C.
pneu-moniae-specific amplification product. If contamination and
nonspecificity are ruled out, the results are true positives. Nev-ertheless, we would not consider a single 1 of 10 samples positive as a “confirmed” C. pneumoniae positive. In our PBMC study, we verified positive specimens by independent re-extraction, followed by PCR in triplicate (21). As more sensitive assays are developed, confirmation by amplifying a different target will be preferable (2).
Regarding feasibility, we acknowledge that a trade-off may be required in determining the optimal number of replicates for different specimen types. For the detection of C.
pneu-moniaeDNA in clinical specimens, replicates of two or three,
depending on the specimen type, may be adequate if the lab-oratory can demonstrate high reproducibility. A larger number of replicates will likely not be feasible, but the laboratory may wish to test a small number of positives in 5 or 10 replicates to examine reproducibility. In a research setting, replicates of up to 10 may be desirable for specimen types in whichC.
pneu-moniae concentration is likely to be low. We currently test
blood and respiratory specimens in replicates of three, but we have increased both the concentration (DNA eluted in 50l rather than 100l) and the sample size (5l per 50-l PCR mixture rather than 2.5l per 25-l PCR mixture) to approx-imate the same sensitivity as previously achieved with 10 rep-licates. Nevertheless, we suggest replicate PCR as a “reference standard” only until methods of extraction and detection are improved to the point where single or duplicate PCR will provide comparable sensitivity and reliability. Methods to con-centrate target, such as monocyte enrichment using CD14 an-tibodies (14), or nucleic acid molecule selection using capture probes, may obviate the need for replication altogether.
We conclude that repeat testing of the same specimen mark-edly increases the sensitivity and reliability of a PCR assay, particularly for clinical specimens with a lowC. pneumoniae
concentration. Replicate testing may improve the development and comparison of PCRs and provide more precise estimates of organism prevalence in various chronic disease states. Con-versely, failure to recognize the low sensitivity of a single PCR determination may cause frustration when positive results can-not be reliably confirmed. Further validation is needed with otherC. pneumoniaeassays and other clinical specimens.
ACKNOWLEDGMENTS
This study was supported by a grant-in-aide from the Father Sean O’Sullivan Research Centre, St. Joseph’s Hospital, Hamilton, Ontario, Canada. M. Smieja is a Research Fellow of the Heart and Stroke Foundation of Canada.
REFERENCES
1.Bjornsson, E., E. Hjelm, C. Janson, E. Fridell, and G. Boman.1996. Serology of chlamydia in relation to asthma and bronchial hyperresponsiveness. Scand. J. Infect. Dis.28:63–69.
2.Boman, J., and C. A. Gaydos.2000. Polymerase chain reaction detection of
Chlamydia pneumoniaein circulating white blood cells. J. Infect. Dis.181:
S452–S454.
3.Boman, J., C. A. Gaydos, and T. C. Quinn.1999. Molecular diagnosis of
Chlamydia pneumoniaeinfection. J. Clin. Microbiol.37:3791–3799. 4.Boman, J., S. Soderberg, J. Forsberg, L. S. Birgander, A. Allard, K. Persson,
E. Jidell, U. Kumlin, P. Juto, A. Waldenstrom, and G. Wadell.1998. High prevalence ofChlamydia pneumoniaeDNA in peripheral blood mononu-clear cells in patients with cardiovascular disease and in middle-aged blood donors. J. Infect. Dis.178:274–277.
5.Campbell, L. A., E. R. O’Brien, A. L. Cappuccio, C. C. Kuo, S. P. Wang, D. Stewart, D. L. Patton, P. K. Cummings, and J. T. Grayston.1995. Detection ofChlamydia pneumoniaeTWAR in human coronary atherectomy tissues. J. Infect. Dis.172:585–588.
6.Campbell, L. A., M. M. Perez, D. J. Hamilton, C. C. Kuo, and J. T. Grayston.
1992. Detection ofChlamydia pneumoniaeby polymerase chain reaction. J. Clin. Microbiol.30:434–439.
7.Danesh, J., P. Whincup, M. Walker, L. Lennon, A. Thomson, P. Appleby, Y. Wong, M. Bernardes-Silva, and M. Ward.2000. Chlamydia pneumoniae IgG titres and coronary heart disease: prospective study and meta-analysis. Br. Med. J.321:208–213.
8.Gieffers, J., E. Reusche, W. Solbach, and M. Maass.2000. Failure to detect
Chlamydia pneumoniaein brain sections of Alzheimer’s disease patients. J. Clin. Microbiol.38:881–882.
9.Grayston, J. T., and L. A. Campbell.1999. The role ofChlamydia pneu-moniaein atherosclerosis. Clin. Infect. Dis.28:993–994.
10. Hahn, D. L.1999.Chlamydia pneumoniae, asthma, and COPD: what is the evidence? Ann. Allergy Asthma Immunol.83:271–288, 291.
on May 15, 2020 by guest
http://jcm.asm.org/
11.Hammerschlag, M. R., Z. Ke, F. Lu, P. Roblin, J. Boman, and B. Kalman.
2000. IsChlamydia pneumoniaepresent in brain lesions of patients with multiple sclerosis? J. Clin. Microbiol.38:4274–4276.
12. Kuo, C. C., L. A. Jackson, L. A. Campbell, and J. T. Grayston.1995.
Chlamydia pneumoniae(TWAR). Clin. Microbiol. Rev.8:451–461. 13. Kuo, C. and L. A. Campbell.2000. Detection ofChlamydia pneumoniaein
arterial tissues. J. Infect. Dis.181:S432–S436.
14. Maass, M., J. Jahn, J. Gieffers, K. Dalhoff, H. A. Katus, and W. Solbach.
2000. Detection ofChlamydia pneumoniaewithin peripheral blood mono-cytes of patients with unstable angina or myocardial infarction. J. Infect. Dis.
181:S449–S451.
15. Mahony, J. B., S. Chong, B. K. Coombes, M. Smieja, and A. Petrich.2000. Analytical sensitivity, reproducibility of results, and clinical performance of five PCR assays for detectingChlamydia pneumoniaeDNA in peripheral blood mononuclear cells. J. Clin. Microbiol.38:2622–2627.
16. Nochlin, D., C. M. Shaw, L. A. Campbell, and C. C. Kuo.1999. Failure to detectChlamydia pneumoniaein brain tissues of Alzheimer’s disease. Neu-rology53:1888.
17. Puolakkainen, M., C. C. Kuo, A. Shor, S. P. Wang, J. T. Grayston, and L. A. Campbell.1993. Serological response toChlamydia pneumoniaein adults with coronary arterial fatty streaks and fibrolipid plaques. J. Clin. Microbiol.
31:2212–2214.
18. Ridker, P. M., R. B. Kundsin, M. J. Stampfer, S. Poulin, and C. H. Hen-nekens.1999. Prospective study ofChlamydia pneumoniaeIgG seropositivity and risks of future myocardial infarction. Circulation99:1161–1164.
19. Ring, R. H., and J. M. Lyons.2000. Failure to detectChlamydia pneumoniae
in the late-onset Alzheimer’s brain. J. Clin. Microbiol.38:2591–2594. 20. Saldanha, J.1993. Assays for viral sequences and their value in validation of
viral elimination. Dev. Biol. Stand.81:231–236.
21. Smieja, M., S. Chong, M. Natarajan, A. Petrich, L. Rainen, and J. B. Mahony.2001. Circulating nucleic acids ofChlamydia pneumoniaeand cy-tomegalovirus in patients undergoing coronary angiography. J. Clin. Micro-biol.39:596–600.
22. Sriram, S., W. Mitchell, and C. Stratton.1998. Multiple sclerosis associated withChlamydia pneumoniaeinfection of the CNS. Neurology50:571–572. 23. Tong, C. Y., and M. Sillis.1993. Detection ofChlamydia pneumoniaeand
Chlamydia psittaciin sputum samples by PCR. J. Clin. Pathol.46:313–317. 24. Vrielink, H., H. Reesink, M. Habibuw, M. Schuller, C. van der Meer, and
P. Lelie.1999. Comparison of four HTLV-I and HTLV-I⫹II ELISAs. Vox Sang.76:187–191.
25. Vrielink, H., H. W. Reesink, H. L. Zaaijer, C. L. van der Poel, H. T. Cuypers, and P. N. Lelie.1996. Sensitivity and specificity of four assays to detect human T-lymphotropic virus type I or type I/II antibodies. Transfusion
36:344–346.
26. Vrielink, H., H. L. Zaaijer, H. W. Reesink, C. L. van der Poel, H. T. Cuypers, and P. N. Lelie.1995. Sensitivity and specificity of three third-generation anti-hepatitis C virus ELISAs. Vox Sang.69:14–17.
27. Wong, Y. K., K. D. Dawkins, and M. E. Ward.1999. CirculatingChlamydia pneumoniaeDNA as a predictor of coronary artery disease. J. Am. Coll. Cardiol.34:1435–1439.