DNA Multiple Sequence Alignment by a Hidden Markov
Model and Fuzzy Levenshtein Distance based Genetic
Algorithm
Tamal Chakrabarti
Department of Computer science & Engineering, Institute
of Engineering and Management, Y-12, Block -EP, Sector-V, Salt Lake Electronics
Complex, Kolkata-700091, West Bengal, India
Sourav Saha
Department of Computer science & Engineering, Institute
of Engineering and Management, Y-12, Block -EP, Sector-V, Salt Lake Electronics
Complex, Kolkata-700091, West Bengal, India
Devadatta Sinha
Department of Computer Science & Engineering,
Calcutta University, 92 AcharyaPrafulla Chandra Road,
Kolkata-700009, West Bengal, India
ABSTRACT
In the last decade, biologists have experienced a fundamental shift away from the traditional empirical research to large-scale, computer-based research. Today bio-informatics is a systematic and predictive discipline which encompasses genomics, informatics, automation, and miniaturization. This fusion of biology and information science is expected to continue and expand for the foreseeable future. DNA Sequence alignment is a commonly observed problem in bio-informatics for establishing similarity and evolutionary relationship between DNA sequences. This paper has presented a DNA multiple sequence alignment technique by a genetic algorithm based on Hidden Markov Model and Fuzzy Levenshtein Distance.
General Terms
Bio-informatics, DNA, Sequence Alignment
Keywords
Genetic Algorithm, Hidden Markov Model, Fuzzy Levenshtein Distance
1.
INTRODUCTION
DNA is short form for deoxyribonucleic acid. Two chains of four chemical bases (abbreviated A, T, C and G) make up DNA and act as a cell‟s recipe book to make proteins. The four bases in DNA are adenine (A), thymine (T), guanine (G), and cytosine (C). DNA contains three components: deoxyribose (a five-carbon sugar), a series of phosphate groups, and four nitrogenous bases, (nitrogen compounds that contain bases). Adenine (A) forms a base pair with thymine (T), and guanine (G) with cytosine (C) in DNA.
Similarities between DNA sequences may arise due to the functional, structural or evolutionary relationship among them. DNA Sequence alignment is a method of arranging two (pairwise) or more (multiple) sequences of DNA to identify regions of similarity among them by searching for a series of individual nucleotides or nucleotide patterns that are in the same order. In bioinformatics multiple sequence alignment is important in the study of evolution, control of gene expression and also in protein structure/function relationships. The figure below depicts an example of an alignment of three DNA sequences.
C A G A T
- A G A -
C A - A T
Figure 1: An example of Multiple DNA Sequence Alignment
The gap characters „-‟ are inserted in sequences to enforce regions of similarity to come together and form a good alignment. The quality of the alignment needs to be measured using some heuristic. The most commonly used method is sum-of-pairs score. Let Si,j be the sum-of-pairs score of the
alignment between a1…ai and b1…bj where A= a1…am and
B=b1…bn is the first and second sequence respectively. Then
the recurrence relation to calculate Si,j is given by:
𝑆𝑖,𝑗 = max
𝑆𝑖−1,𝑗 −1+ 𝜑 𝑎𝑖, 𝑏𝑗 ,
𝑆𝑖−1,𝑗+ 𝜑 𝑎𝑖, − ,
𝑆𝑖,𝑗 −1+ 𝜑 −, 𝑏𝑗
Where:
φ (a, b): scores an alignment of symbol a with symbol b. φ (a, -): scores an alignment of symbol a with a gap. φ (-, b): scores an alignment of a gap with symbol b.
27 HMMs offer a way to model the latent structure of temporally
dependent data where it is assumed that the observed process evolves independently given an unobserved Markov chain. There are a discrete finite number of states in the Markov chain which switch between one another according to a small probability. Given that these states are unobserved and random in occurrence they form a hidden Markov chain. It is possible to model the sequence of state changes that occur in the hidden Markov chain via observations which are dependent on the hidden states.
2.
RELATED WORK
Hidden Markov models were first discussed by Baum and Petrie (1966) [1]. Since the 1980's and early 1990's HMMs have been applied to DNA sequence analysis with the seminal paper by Churchill (1989) that first applied HMM to DNA segmentation [4]. There are various statistical techniques available to assist in the segmentation effort which is covered in Braun and Muller (1998) [2]. The use of hidden Markov models in DNA sequence analysis were illustrated by Churchill (1992) [5] and Dubin et al. (1998) [7]. Eddy et. al. (1995) [8] presented a paper on DNA multiple sequence alignment by Hidden Markov Model. Genetic Algorithm has been applied to the multiple sequence alignment problem by various researchers, such as Lin et. al. [13] and Chen et. al. [19].
Zhang et. al. have proposed [9] a novel method of population initialization and of crossover. Chang et. al. [17] has successfully combined fuzzy arithmetic with GA to arrive at better alignments. Lai et. al. [3] have suggested new genetic operators that direct the GA towards better solutions. Nguyen et al. [12] presents a hybrid scheme where they convert the MSA problem to the problem of finding the shortest path in a weighted directed acyclic k-dimension graph (where k is the number of sequences). Hjelmqvist [10] in 2012 published the idea of a fast and memory efficient Levenshtein algorithm to compute the edit distance between strings, such as DNA sequences. This paper presents a genetic algorithm, based on Hidden Markov Model and Fuzzy Levenshtein Distance to align multiple DNA sequences.
3.
ALGORITHM
Given n DNA sequences, the genetic algorithm creates an initial population of chromosomes, by randomly generating m alignments of the given DNA sequences. For example, let CAGAT, AGA and CAAT be three given DNA sequences. Then an initial population of three randomly created chromosomes may be as depicted in the figure below:
C A G A T C A G A T C A G A T
A - G - A A G - A - A - G - A
[image:2.595.307.551.94.211.2]C A A T - C A - A T C A - A T
Figure 2: Initial Population of Chromosomes
Then the fitness of the chromosomes is calculated by a fitness function.
3.1
Fitness function
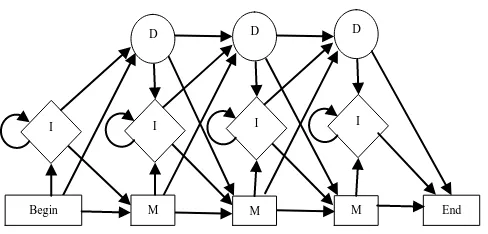
For the purpose of calculating the fitness of each chromosome Hidden Markov Models (HMMs) are used. For every chromosome its profile HMM is built. A profile HMM is a certain type of HMM with a structure that in a natural way allows position dependent gap penalties. A profile HMM can be obtained from a multiple alignment. The structure of the model is shown in the figure below.
Figure 3: The Structure of a Profile HMM
The bottom lines of states are called the match (M) states, because they model the columns of the alignment. The second rows of diamond shaped states are called insert (I) states and are used to model highly variable regions in the alignment. The top lines of circular states are called delete (D) states. They do not match any residues, and they are there merely to make it possible to jump over one or more columns in the alignment, i.e. to model the situation when just a few of the sequences have a „–‟ in the multiple alignment at a position.
Using the profile HMM, a consensus sequence for each of the chromosomes is emitted. A consensus sequence is defined as the sequence, which is closest to all other sequences in the chromosome, and thus can be used to represent the entire set of sequences in the alignment (chromosome). An example of a consensus sequence with respect to a chromosome is depicted in the figure below:
C A G A T
A - G - A
[image:2.595.332.528.433.502.2]C A A T -
Figure 4: The Consensus Sequence 'CAGTT' obtained from a Chromosome
The Fuzzy Levenshtein Distance of each of the sequences in the chromosome is then computed from the consensus sequence.
The Levenshtein distance between two words is the minimum number of single-character edits (insertion, deletion, substitution) required to change one word into the other. Mathematically, the Levenshtein distance between two strings x, y is given by:
𝐿𝑒𝑣𝑥,𝑦 𝑚, 𝑛 =
max 𝑚, 𝑛 , 𝑖𝑓 min 𝑚, 𝑛 = 0
min
𝐿𝑒𝑣𝑥,𝑦 𝑚 − 1, 𝑛 + 1
𝐿𝑒𝑣𝑥,𝑦 𝑚, 𝑛 − 1 + 1
𝐿𝑒𝑣𝑥,𝑦 𝑚 − 1, 𝑛 − 1 + [𝑥𝑚≠ 𝑦𝑛]
𝑜𝑡ℎ𝑒𝑟𝑤𝑖𝑠𝑒
The first element in the minimum corresponds to deletion (from x to y), the second to insertion and the third to match or mismatch, depending on whether the respective symbols are the same.
The Levenshtein distance is an integer, which gives a measure of similarity between two DNA sequences. To compute the Fuzzy Levenshtein distance, the percentage similarity between two DNA sequences is computed. To transform the Levenshtein distance into a percentage, the number of edits
CAGTT
Begin
D
M I D
M I
D
M I I
[image:2.595.50.286.586.632.2]required are subtracted from 1.0 and divided by the length of the longest string. The Fuzzy Levenshtein distance is obtained by multiplying the resulting value by 100. The Fuzzy Levenshtein distance of the sequences in a chromosome from its consensus sequences is illustrated in the figure below:
Sequence Consensus
Sequence
Fuzzy Levenshtein distance
CAGAT
CAGTT
0.8
A-G-A 0.2
[image:3.595.56.287.132.218.2]CAAT- 0.6
Figure 5: Fuzzy Levenshtein distances of three sequences from the consensus sequence
The fitness of a chromosome is then calculated as the average of the Fuzzy Levenshtein distances of each sequence in the alignment to the consensus alignment. For example, the fitness of the chromosome in the previous example is 0.53.
3.2
Genetic operators
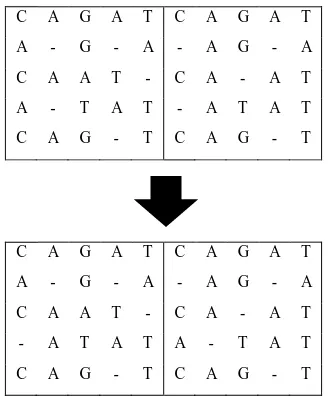
Selection of the chromosomes is done by the criteria of elitism, which selects the best chromosome from a population. Then the rest of the chromosomes are chosen by spinning the roulette wheel. Thus fitter individuals have a greater chance of being selected. These selected individuals are then crossed over to produce new individuals. For crossover a particular sequence of two chromosomes are interchanged. The following figure depicts an example crossover.
C A G A T C A G A T
A - G - A - A G - A
C A A T - C A - A T
A - T A T - A T A T
C A G - T C A G - T
C A G A T C A G A T
A - G - A - A G - A
C A A T - C A - A T
- A T A T A - T A T
[image:3.595.85.249.385.584.2]C A G - T C A G - T
Figure 6: Crossover of two chromosomes (4th sequence interchanged)
After crossover mutation is performed. In this case the position of gaps within a sequence of a chromosome has been altered, as given in the figure below:
C A G A T
→
C A G A T
- A G - A A - G - A
C A - A T C A - A T
- A T A T - A T A T
[image:3.595.327.559.466.680.2]C A G - T C - A G T
Figure 7: Example of mutation: gaps in sequence 2 and sequence 4 are altered
These operations are repeated over and over again for a certain number of times to produce fitter individuals.
4.
EXPERIMENTAL SETUP
To build the profile HMMs HMMER [11] (http://hmmer.janelia.org/) has been used, a bio-sequence analysis tool using profile Hidden Markov Models. For result comparison, the T-Coffee [15] server (http://www.tcoffee.org/),
which is an online multiple sequence alignment tool, has been utilized. The experimental environment is depicted below:
Hardware
Processor - Intel® Core™ i7-3610QM CPU @ 2.30GHz × 8
RAM – 8GB
Disk 1000 GB
Software
Operating system – Open SUSE Kernel version 3.1.0-1.2-desktop
OS type – 32-bit
Compiler used – javac
JRE version 1.7
HMMER 3.1
T-Coffee Multiple Sequence Alignment Server
5.
OBSERVATIONS
The fitness of the proposed genetic algorithm based on HMM and Fuzzy Levenshtein Distance has been compared with that of the multiple sequence alignment generated by T-Coffee. The number of generations was taken to be 100 for a population size of 100. The graphs below depict the experimental observations.
The following graph illustrates the fitness scores of the proposed algorithm vs. T-Coffee for different sequence sizes.
Figure 8: Sequence Length vs. Fitness Score
20 40 60 80 100
Fitness Score
(T-Coffee) 54.52 57.07 56.58 54.80 51.94 Fitness Score
(Proposed) 61.77 60.44 62.52 61.72 58.72 50.00
52.00 54.00 56.00 58.00 60.00 62.00 64.00
Fi
tn
ess
S
co
re
(
Pe
rc
en
ta
g
e)
Sequence Length
Fitness Score (T-Coffee)
[image:3.595.76.259.653.731.2]29 The following graphs illustrate the fitness scores of the
[image:4.595.340.556.79.284.2]proposed algorithm vs. T-Coffee for various numbers of sequences and a fixed sequence size.
Figure 9: Number of Sequences vs. Fitness Score (Sequence Length = 20)
[image:4.595.66.257.116.286.2]Figure 10: Number of Sequences vs. Fitness Score (Sequence Length = 40)
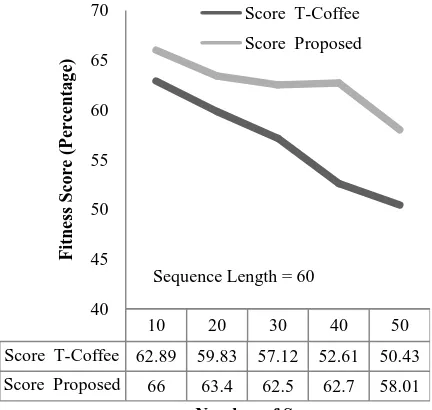
Figure 11: Number of Sequences vs. Fitness Score (Sequence Length = 60)
Figure 12: Number of Sequences vs. Fitness Score (Sequence Length = 80)
10 20 30 40 50
Score T-Coffee 63.0 55.8 52.6 51.6 49.4
Score Proposed 69 65.1 63.0 61.7 50.0 40
45 50 55 60 65 70 75
Fi
tn
ess
S
co
re
(Per
ce
n
ta
g
e)
Number of Sequences
Score T-Coffee
Score Proposed
Sequence Length = 20
10 20 30 40 50
Score T-Coffee 62.89 59.83 59.62 52.61 50.41
Score Proposed 65 62.4 61.5 59.7 53.61 40
45 50 55 60 65 70
Fi
tn
ess
S
co
re
(Per
ce
n
ta
g
e)
Number of Sequences
Score T-Coffee
Score Proposed
Sequence Length = 40
10 20 30 40 50
Score T-Coffee 62.89 59.83 57.12 52.61 50.43
Score Proposed 66 63.4 62.5 62.7 58.01 40
45 50 55 60 65 70
Fitn
es
s S
co
re
(Pe
rc
en
ta
g
e)
Number of Sequences
Score T-Coffee
Score Proposed
10 20 30 40 50
Score T-Coffee 59.83 57.12 53.61 52.43 51.01
Score Proposed 65.4 63.5 62.7 58.01 59 40
45 50 55 60 65 70
Fi
tn
ess
S
co
re
(Per
ce
n
ta
g
e)
Number of Sequences
Score T-Coffee
Score Proposed
30
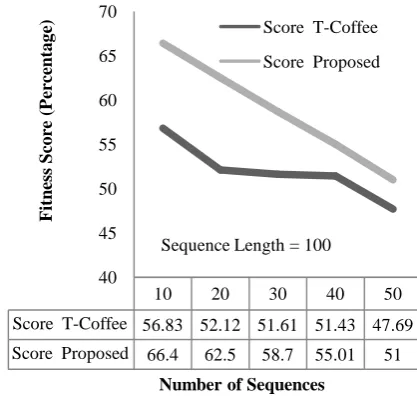
Figure 13: Number of Sequences vs. Fitness Score (Sequence Length = 100)
6.
CONCLUSION
From the experimental results it can be concluded that the proposed genetic algorithm based on Hidden Markov Models and Fuzzy Levenshtein Distance works well under the given conditions and generally produces good fitness scores when compared to those of T-Coffee. It may be mentioned that the analytical study of the DNA multiple sequence alignment by genetic algorithms opens up a wide scope of investigative study with a view to explore better improvement, if any. The authors suggest the following areas of further research:
Test for convergence with variance of population and generations.
Improve the fitness function by incorporating affine gap costs.
Explore better crossover and mutation mechanisms to enhance the proposed genetic evolutionary approach.
Exploit other evolutionary computation techniques for the current problem.
7.
REFERENCES
[1] Baum, L. and Petrie, T. (1966). Statistical inference for probabilistic functions of finite state Markov chains. The Annals of Mathematical Statistics, 37(6):1554-1563.
[2] Braun, J. V. and Muller, H.-G. (1998). Statistical methods for dna sequence segmentation. Statistical Science, 13(2):142-162.
[3] Chih-Chin Lai; Chih-Hung Wu; Cheng-Chen Ho; “Using Genetic Algorithm to Solve Multiple Sequence Alignment Problem ”, International Journal of Software Engineering and Knowledge Engineering Vol. 19, No. 6 (2009)
[4] Churchill, G. (1989). Stochastic models for heterogeneous dna sequences. Bulletin of Mathematical Biology, 51:79-94. 10.1007/BF02458837.
[5] Churchill, G. (1992). Hidden markov chains and the analysis of genome structure. Computers and Chemistry, 16(2):107-115.
[6] Dong, S. and Searls, D. B. (1994) Genomics 23, 540– 551.
[7] Dubin, R. E. S., Krogh, A., and Mitchison, G. (1998). Biological Sequence Analysis: probabilistic models of proteins and nucleic acids. Cambridge University Press, Cambridge.
[8] Eddy, S. R. (1995); Multiple alignment using hidden Markov models. In Rawlings, C., Clark, D., Altman, R., Hunter, L., Lengauer, T., and Wodak, S. (Eds.), Proc. of Third Int. Conf. on Intelligent Systems for Molecular Biology volume 3 pp. 114–120 Menlo Park, CA. AAAI Press.
[9] Guang-Zheng Zhang; De-Shuang Huang; "Aligning multiple protein sequence by an improved genetic algorithm," Neural Networks, 2004. Proceedings. 2004 IEEE International Joint Conference on , vol.2, no., pp. 1179- 1183 vol.2, 25-29 July 2004.
[10] Hjelmqvist, Sten (26 Mar 2012), Fast, memory efficient
Levenshtein algorithm
(http://www.codeproject.com/Articles/13525/Fast-memory-efficient-Levenshtein-algorithm)
[11] HMMER 3.1 (February 2013); http://hmmer.org/
[12] Hung Dinh Nguyen; Yoshihara, I.; Yamamori, K.; Yasunaga, M.; "A parallel hybrid genetic algorithm for multiple protein sequence alignment," Evolutionary Computation, 2002. CEC '02. Proceedings of the 2002 Congress on , vol.1, no., pp.309-314, 12-17 May 2002
[13] Lin, C. H., Chen, S. J., and Chen, S. M. 2003. A new method for multiple DNA sequence alignment based on genetic algorithms. Proceedings of the 2003 Joint Conference of AI, Fuzzy System, and Grey System, Taipei, Taiwan, Republic of China.
[14] Mount David W., Bioinformatics – Sequence and Genome Analysis, Cold Spring Harbor Laboratory Press, 2001.
[15] Notredame, Higgins, Heringa, T-Coffee: A novel method for multiple sequence alignments, Journal of Molecular Biology, 302 (205-217) 2000
[16] Omar, M.F.; Salam, R.A.; Rashid, N.A.; Abdullah, R.; "Multiple sequence alignment using genetic algorithm and simulated annealing," Information and Communication Technologies: From Theory to Applications, 2004. Proceedings, vol., no., pp. 455- 456, 19-23 April 2004.
[17] Ping-Teng Chang; Lung-Ting Hung; Kuo-Ping Lin; Chih-Sheng Lin; Kuo-Chen Hung; , "Protein Sequence Alignment Based on Fuzzy Arithmetic and Genetic Algorithm," Fuzzy Systems, 2006 IEEE International Conference on , vol., no., pp.1362-1367, 0-0 0.
[18] Sellers, Peter H. (1980). "The Theory and Computation of Evolutionary Distances: Pattern Recognition". Journal of Algorithms 1 (4): 359–73. doi:10.1016/0196-6774(80)90016-4
[19] Shyi-Ming Chen, Chung-Hui Lin, and Shi-Jay Chen, Multiple DNA Sequence Alignment Based on Genetic Algorithms and Divide-and-Conquer Techniques, International Journal of Applied Science and Engineering 2005. 3, 2: 89-100
[20] Smith-Keary. P. Molecular Genetics. Macmillan Education Ltd, London, 1991
10 20 30 40 50
Score T-Coffee 56.83 52.12 51.61 51.43 47.69
Score Proposed 66.4 62.5 58.7 55.01 51 40
45 50 55 60 65 70
Fitn
es
s S
co
re
(Pe
rc
en
ta
g
e)
Number of Sequences
Score T-Coffee
Score Proposed