Circular Visualization Enhancement through
Complementary Interaction
Hemant Makwana
Reader
Department of Information Technology Institute of Engineering &
Technology Devi Ahilya University
Indore, India
Sanjay Tanwani,
Ph.D Professor School of Computer Sciences & InformationTechnology Devi Ahilya University
Indore, India
Suresh Jain,
Ph.DProfessor, SD Bansal College of
Technology Indore, India
ABSTRACT
In today’s scenario, most of the applications like web repository generate bulk of heterogeneous data. Visualization helps in the interpretation of meaningful information from huge data generated by these applications. There are many visualization techniques available in literature. Parallel Coordinates, Glyph and Projection techniques are some of the famous data visualization techniques. Projection techniques are unable to illustrate the details of data like inter- tuple variations. Parallel Coordinates have good capacity to express the details, but require more space as well as it is affected from clutter. Trend figure is also affected from clutter up to some extent. Considering the heterogeneous nature of data and limitation of visualization techniques, single visualization technique does not fulfill the analytical requirements of different application domains. But combination of these visualization techniques may fulfill the analytical requirements of applications from different domain. In this work, we have developed a tool, in which Parallel coordinates and trend figure used as interactive techniques with projection technique. The proposed combination reduces the limitation like inter- tuple variations of projection technique. Analysis of data with proposed tool has the potential to uncover other relationships and non-trivial structures.
Keywords
Visualization, Parallel Coordinates, tuple, Projection, interaction, pattern;
1.
INTRODUCTION
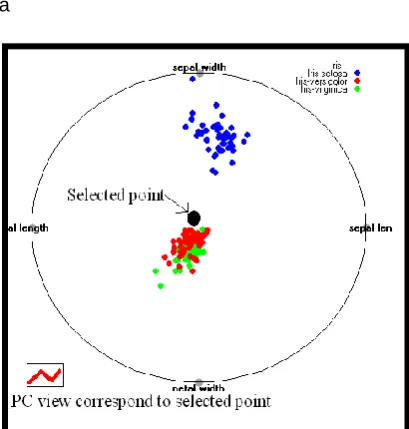
[image:1.595.338.543.218.433.2]Data analysis is based on the statistical approaches that are indispensable for the study of biological systems, marketing analysis and research. Understanding of large amounts of Multi-dimensional data resulting from the high-throughput technologies are not completely served by mathematical techniques and are usually complemented with visual, knowledge discovery and other computational tools. Visualization technique augments the understanding about the information. As size of the data grows it produces new challenges and problems.
Figure 1: Illustrates the Parallel Coordinates View with Projection technique.
2 Parallel coordinates provides comparative view of data
while projection techniques provides combined effects of data (as shown in figure 1 and 2). User performs different operations like filtering, highlighting and selection. Selection is done by Trend figures and inter-tuple and intra-tuple variations of single or multiple selected points expressed by Parallel coordinates.
2.
RELATED
WORK
Parallel Coordinate was proposed by Inselberg and B. Dimsdale in [2] with this work they opened a new way to visualize the data. Later on many modifications, alteration was proposed by researchers. Many of them combined Parallel coordinates with other visualization techniques like Integration of parallel coordinates with Radwiz was done by Enrico Bertini in their work [3] but they used this integration to reduce the clutter effect from parallel coordinates. They did not use this integration as enhancement or complementary interaction techniques. Patrick Hoffman is also combined the parallel view with Radviz in their work [4] He discussed the various types of graphical representation of data. He explores the aspect of the data presentation not the interaction. Andrienko et al. [5] provides the overview of multiple ways to view the multidimensional data with tradeoff between detail and overview view of the data.
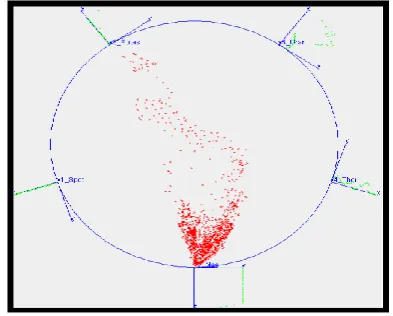
[image:2.595.342.539.360.518.2]Urska Cvek et. al [6] uses multiple visualization techniques to explore the hidden relationship among data. But they does not use as interaction mechanism. Gregor Leban and others [7] introduce a method called VizRank, which is applied on classified data to automatically select the most useful data projections.
Figure 2: Illustration of Interaction by trend figure with projection technique.
It can be can be used with any visualization method that maps attribute values to points in a two-dimensional visualization space. It assesses possible data projections and ranks them by their ability to visually discriminate between classes. He uses Vizrank, Scatter plot and other visualization techniques but does not used as interaction. An interesting combination of parallel coordinates and re-orderable matrix is presented by the Siirtola in their work [8]. The author mentioned the advantages of mixing of different visualization techniques.
Baldonado et al. provide a set of guidelines for use of multiple views of the data [9]. Kandogan[10] introduced
the 2D star coordinate plots, where the data is arranged in a circle with axis corresponding to each feature. Hoffman et.al.[11] introduced RadViz in which spring constants were used to represent t relational values between points. Tee and Ma [12] developed star class, a visual classification, using star coordinates. Theisel and Kreusel [13] introduced enhanced spring model visualization using spheres around the transformed point in three dimensions. High dimensional data visualization techniques are very useful in supervised classification and clustering.
Detail survey on Radial based visualization techniques done by Geoffrey M. Draper in their work [14]. Peihong et.al. Proposed an interactive clustering using graph[15]. Interactive exploration of information using multiple view was proposed Sara Johansson in his work. [16].
Similarly, Roberts provides in [17] some additional guidelines to increase the consistency, correlation between multiple views and automatic generation of multiple views the same data. Multi-touch technique for brushing in parallel coordinates proposed by same author [18]. Robert Koasara and Sara Johansson Proposed many enhancements in the direction of interactions [16,17,18,19]. A. Dasgupta provides screen space utilization metrics as pargnostics [20] and talked about privacy issues and clutters [21] with respect to parallel coordinates.
Figure 3: Demonstration of complementary interaction mechanism using projection techniques & trend figure
on out5D (reduced) dataset.
3.
PROPOSED WORK
In this work we have proposed two enhancements
3.1 Interactive Trend Figures:
Trends figures are placed circularly around the projection based representation (as shown in figure 3). User can interact, highlight, filter and select the data using trend figure or Vector based presentation or vice-versa.
3.1 Highlighting intra-tuple variation through Parallel Coordinates
[image:2.595.81.289.415.604.2]Figure 4: Demonstration of the Interaction techniques (a) Trend Figure (b) Parallel Coordinates.
Projection based visualization techniques (multidimensional data is mapped to two dimensional space) is the most suitable visualization techniques for massive datasets or high dimensional datasets. It highlights the discrimination among data tuple but does not display the discrimination within data tuple. In our research work we used vector based projection techniques (demonstrated in figure 5).
Vector based visualization techniques:
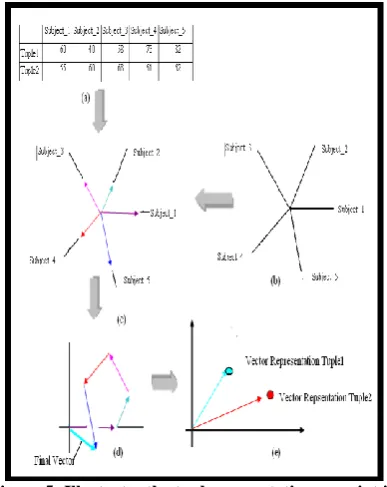
Vector based visualization is radial vector based visualization similar to Radviz. Axes are spaced equiangularly from each other and radiating from common center point. Each data item in tuple is assumed as vector and the item value is considered as magnitude of vector and axis angle is considered as vector angle. Axis angle calculated by equation mentioned as below.
Vector angle (ө) = 2π/m
Where ө is angle between axis and m is number of dimension.
A single vector is computed as sum of the all vectors that are defined by the tuple. One end point of vector represents the position of dot and other is on common center point. The position of point represents the tuple in 2D space. Coordinates of this point is calculated by equation mentioned as below (illustrated by figure 5).
Dataset used
To demonstrate the effectiveness of this work we developed a prototype and visualize the two data base Out5D( figure 6) and Olive( figure 7) database. The out5d consist of 1307(reduced dataset) values and five attributes (spot, magnetics, and three radiometrics channels - potassium, thorium, and uranium) of remote sensed data.
Figure 5: Illustrates the tuple presentation as point in 2D space. (a) Indicate the tabular view of the sample
data. (b) Radial axis arrangement of attributes. (c) Vector presentation of one tuple. (d) Computation of the final vector as the summation of all vectors. (e) One end point of computed vectors represented by a point as
a final view of the tuple.
1
0
1
0
cos(
* )
sin(
* )
i
i m
i m
i
x
A
i
y
A
i
Where x,y are coordinate values of m-dimensional data, Ai is ith value in tuple, ө is angle between axis and m is number of dimension.
[image:3.595.80.289.83.208.2]The Olive dataset consist of 572 values and five attributes (stearic, linolenic, arachidic, eicosenoic and palmitoleic) of olive oil.
[image:3.595.336.547.555.651.2]4
Figure 7: Illustrates the interaction and visualization of Olive data. (a) Single selection (b) Multiple
selections.
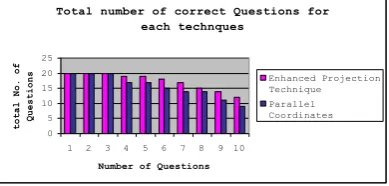
Figure 8: Comparison of Enhanced Projection technique and Parallel Coordinates on the basis of
time taken to solve each question.
4.
EVALUATION CRITERIA
[image:4.595.77.293.106.320.2]Projection techniques are unable to express the intra-tuple variations present in the data but effectively express the inter-tuple variations. Parallel Coordinates can express both (intra-tuple and inter-tuple) variation presence in the data. So we choose Enhanced Projection technique with Parallel coordinates to prove the effectiveness of enhancements in Projection technique. We prepared a set of questionnaire (inter and intra tuple variation based questions) and prepared a group of 15 students. Students were graduates & post-graduate Engineering Students who were familiar with visualization techniques. All students given set of questions and asked to get the results online. We stored their responses for every question in terms of correctness, time spend to solve each problem. The Correctness for Parallel coordinates & Enhanced Projection techniques were 78% and 86% respectively. Average time to solve the questionnaire by students with enhanced projection techniques is less than Parallel Coordinates (as figure 8 and 9 indicates). Hence with this enhancement projection techniques show the intra-tuple variation with inter-tuple variations and better performance.
Figure 9: Comparison of Enhanced Projection technique and Parallel Coordinates on the basis of
correctness of the questions.
5.
RESULTS & CONCLUSION
In this work, we have presented a novel multiple views of data. Projection techniques are effective in representation of multidimensional data in small space but lacking in providing the details (intra-tuple variation). Trend figure provides excellent intra-tuple variation but lacking inter-tuple variation. Similarly Parallel coordinates offer both inter-tuple and intra tuple variations but affected from clutter. Each one has its own weakness & strength. Combining the strength of these techniques provide great improvements in information extraction and highlight the hidden patterns. Use of Parallel coordinates and trend figure together enhances the ability of projection techniques. We have tested our idea with prototypes that proves the effectiveness (as shown in figures 6, 7, 8 and 9). In the future, we can explore the business applications of such combinations and explore the possibilities of use of other visualization techniques as interaction techniques. Furthermore we extend same interaction techniques with other visualization techniques.
6.
REFERENCES
[1] Ruth Rosenholtz, Yuanzhen Li, Jonathan Mansfield and Zhenlan Jin. “Feature congestion: a measure of display clutter” Proceedings of the SIGCHI Conference on Human Factors in Computing Systems, page 761, 2005.
[2] A. Inselberg and B. Dimsdale. “Parallel coordinates: A tool for visualizing multi-dimensional geometry”. In IEEE Visualization, pages 361–378. IEEE CS Press, 1990.
[3] E Bertini, L Dell’ Aquila, G Santucci. “SpringView: Cooperation of Radviz and Parallel Coordinates for View Optimization and Clutter Reduction” 3rd IEEE International Conference on Coordinated & Multiple Views in Exploratory Visualization, pages 22-29, 2005.
[4] Patrick Hoffman. “Dimensional Anchors: A Graphic Primitive for Multidimensional Multivariate Information Visualizations”, in NPIVM -99 pages 9-16, 1999.
[5] G. Andrienko and N. Andrienko. “Parallel coordinates for exploring properties of subsets”. In CMV ’04: Proceedings of the Second International Conference on Coordinated & Multiple Views in Exploratory Visualization (CMV’04), pages 93–104. IEEE Computer Society, 2004.
[6] Urska Cvek, Marjan Trutschl, Randolph Stone II, Zanobia Syed, John L. Clifford, Anita L. Sabichi: “Multidimensional Visualization Tools for Analysis of Expression Data”, World Academy of Science, Engineering and Technology 54 , 2009.
[7] Gregor, Leban, Bla Z Zupan, Gaj Vidmar, Ivan Bratko,: “VizRank: Data Visualization Guided by Machine Learning”, Data Mining and Knowledge Discovery, Springer Science + Business Media, LLC, pages 17-23, May 2006.
[8] H. Siirtola. “Combining Parallel Coordinates with the Reorderable Matrix”. in CMV’03: Proceedings of the International Conference on Coordinated & Multiple Views in Exploratory Visualization, pages. 63–74, IEEE Computer Society, 2003.
[9] M. Q. Wang Baldonado, A. Woodruff, and A. Kuchinsky. “Guidelines for using multiple views in information visualization” In Proceedings of the working conference on advanced visual interfaces, pages 110–119, 2000.
Average time of each Questions
0 20 40 60 80 100 120 140
Q1 Q2 Q3 Q4 Q5 Q6 Q7 Q8 Q9 Q10
Questions
Time taken to solve each problem(in Sec) 0
50 100 150 Enhanced Projection Technique Parallel Coordinates
Total number of correct Questions for each technques 0 5 10 15 20 25
1 2 3 4 5 6 7 8 9 10
Number of Questions
total No. of Questions
[image:4.595.87.282.626.719.2][10]Eser Kandogan: “Visualizing multi-dimensional clusters, trends, and outliers using star coordinates”, Proceedings of the seventh ACM SIGKDD international conference on Knowledge discovery and data mining, pp. 107-116, 2001.
[11]P.Hoffman, G.Grinstein, and D.Pinkney: “Visualizingmulti-dimensional clusters trends, and outlier susing star coordinates”, Proc. ACM SIGKDD, New York, NY, USA, pages107–116, 2001.
[12]S.Tee and K-L Ma, StarClass: “Interactive Visual Classification Using Star Coordinates”, In Proceedings of the 3rd SIAM International Conference on Data Mining, pp.178-185, May 1-3, 2003.
[13]H.Theisel and M. Kreusel: “An Enhanced Spring Model for Information Visualization”, In Proceedings Eurographics Ferreira and M.Gobel, 17(3) pp 335–344, 1999.
[14] Pak Chung Wong and R. Daniel Bergeron: “A Survey of Radial Methods for Information Visualization”, IEEE Transactions on Visualization and Computer Graphics, vol. 15, no. x, Sept./Oct. 2009.
[15] Peihong Guo, He Xiao, Zuchao Wang, Xiaoru Yuan, “Interactive local clustering operations for
high dimensional data in parallel coordinates”. PacificVis, pages pages 97-104, 2010. [16] Sara Johansson, K. K., A. L.,M.J., J.J. “ Iinteractive
Exploration of Ingredient Mixtures Using Multiple Coordinated Views.” Pages 210-218, IV 2009. [17] H. Piringer, R. Kosara, and H. Hauser. “Interactive
focus+context visualization with linked 2d/3d scatterplots.” In Coordinated and Multiple Views in Exploratory Visualization, pages 49–60, 2004. [18] J. C. Roberts. On Encouraging Multiple Views for
Visualization. In E. Banissi, F. Khosrowshahi, and M. Sarfraz, editors, IV’98 – Proceedings International Conference on Information Visualization, pages 8–14, IEEE Computer Society, July 1998.
[19] Robert Kosara “Indirect Multi-Touch Interaction for Brushing in Parallel Coordinates”, Visualization and Data Analysis (VDA), pages. 786809-1-786809-7, 2011.
[20]A. Dasgupta and R. Kosara. “Pargnostics: screen-space metrics for parallel coordinates”, IEEE Transactions on Visualization and Computer Graphics, 16(6):1017–26, 2010.