PSD based Coherence Analysis of EEG Signals for
Stroop Task
Sukhada A. Unde
Department of Instrumentation,Cummins College of Engineering for Women,Karve
Nagar,Pune, India
Revati Shriram
Department of Instrumentation,Cummins College of Engineering for Women,Karve
Nagar,Pune, India
ABSTRACT
The coherence analysis is based on spectral analysis, which describe the synchronization of electroencephalogram (EEG) rhythms between brain areas. Coherence analysis is a non-invasive technique for studying functional relationships between brain regions. The coherence analysis is a kind of study based on spectrum analysis, which can describe the coordination of the brain electric activities of different frequencies between brain areas. Aimed at the coherence analysis of EEG signal between brain areas using an activity Stroop Task. Power spectral density (PSD) has been used for the analysis of event related coordination of neurophysiological signals of neural responses for a particular task which the subject repetitively performs. The Welch method is used to study the PSD. we constructed simulated EEG data, looked for the suitable approach for cognitive EEG and tried to apply it to the EEG data from Stroop Tack. The result shows coherency of EEG signal of the brain areas for Stroop task activity.
Keywords
Electroencephalogram; Coherence; Chinese stroop task; Synchronization; Power spectral density; Welch method
1.
INTRODUCTION
Electroencephalography (EEG) is recording of electrical activity along scalp. Brain electric signals which are record from scalp is corresponds with an activity of neural network constructed by the numerous neurons under cerebral cortex of the brain[1]. EEG is the recording of electrical activity of all four lobes of brain area.[3] EEG coherence was applied to investigate the coordination of different brain regions performing Stroop task presented in Chinese. Stroop task in which subjects are require to name the color of color-word printed.[5]
1.1
Electroencephlography
EEG measures voltage fluctuations resulting from ionic current flows in neurons of the brain. The electroencephalogram (EEG) is a kind of biological electric activity generated by a large number of neurons. This property indicates that the brain rhythms result from the cooperation of large amount of neurons by synchronization. In clinical application, EEG refers to the recording of the brain's spontaneous electrical activity over short period of time, generally 20–40 minutes, as recorded from multiple electrodes placed on a scalp. The 10-20 System of Electrode Placement is a method used to describe the location of the scalp electrodes.[2] This record is the result of an activity of thousands of neurons in the brain. The EEG is used to record the brain activity for many purposes including sleep research and to help in the diagnosis of brain disorders. In the 10-20 System of
Electrode Placement different channels of EEG can capture.16 channels,32 channels,64 channels are the different system of the 20 Electrode Placement.[4] Out of which 16 channel the 10-20 Electrode Placement system we are used.
2.
SYSTEM SETUP
[image:1.595.307.573.293.563.2]
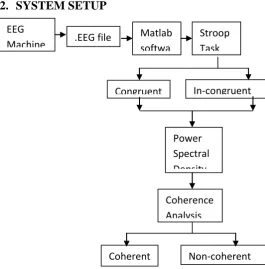
Fig 1: System Block Diagram
2.1
System Block Diagram
In the system block diagram, EEG is capture using the Digital EEG machine. In this machine EEG data is stored in the form of .EEG file. This .EEG file is then read in matlab using Version 4.2.7 software. The Chinese Stroop task is use as an activity to check the synchronization of the different brain area. In the Stroop task, congruent and incongruent are the two methods use to check synchronization. The feature extraction technique means power spectral density is carried out for both the methods. Coherence analysis is find out for the values of PSD.PSD values are extracted by two methods of PSD, welch method and periodogram method. From that it is get that the brain areas are coherent or non coherent. If phase difference and amplitude ratio between two signals remain unchanged, the
EEG
Machine
.EEG file
Matlab
softwa
re
Stroop
Task
Congruent
In-congruent
Power
Spectral
Density
Coherence
Analysis
coefficient equals 1, that is, two signals are more coherent, otherwise trends to 0, that is, two signals are non coherent.
2.2
Stroop Task
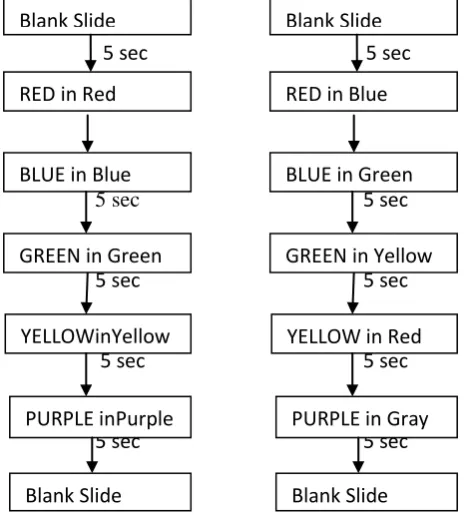
The Stroop task, in which subjects are required to name color of color-word printed in congruent ( RED in red) or incongruent (REDin blue) ink as quickly as possible, ignoring the meaning of word, involves selective attention, language processing, color-naming processes.[9] Hence, the investigation of the synchronization of functional networks during Stroop task by means of coherence may get helpful to understand the neurophysiological basis of high-level cognitive activities of normal humans, and even to provide clinical assessments for disorders in patients.[10]
Some requirements for EEG recording in Stroop task are, subjects must be right handed. All had normal or corrected to normal visual acuity, and normal color vision. Stimuli were printed in the color red, or green, or blue and presented in the centre of the screen against a white background.[11] The stimulus subtended at a distance of approximately 100 cm from the screen. Subjects were instructed to pay attention to the word presented on the screen and response to ink color of the words as quickly and accurately as possible by pressing the appropriate key.[12]
Some specifications are taking care of while preparing slides for EEG recording of Stroop task as, font size is 140,font type is Times New Roman, animation type is fade smoothly, inter slide timing 5sec., Location centre, background White.
In the stroop task, congruent and in-congruent are the two conditions. We have to take the EEG for both congruent and in congruent conditions.
2.3
Electrode selection for Stroop Task
While taking EEG in Stroop task, out of four lobe two lobe that is frontal and temporal lobes are mainly get synchronized.[18] Hence the electrode pairs from these areas are mainly consider. The different electrode pairs are used for EEG coherence in congruent and incongruent task situations of stroop task. The electrode pairs Fp1/F3, Fp1/F7 within the left frontal area, for the electrode pairs Fp2/F4, Fp2/F8 within the right frontal area, for the electrode pairs T3/T5 and T4/T6 from the left and right temporal area respectively. The electrode pairs F7/T3 and F8/T4 from the left and right frontotemporal area respectively.5 sec 5 sec
5 sec 5 sec
5 sec
5 sec
5 sec 5 sec
5 sec 5 sec
5 sec 5 sec
[image:2.595.295.529.76.335.2]
Fig 2: Stroop Task: (a) Congruent Condition,(b)Incongruent Condition
3.
SOFT COMPUTING
There are different feature extraction techniques are available to check the coherency out of which we are going to use power spectral density technique. PSD describes how the power of a signal or time series is distributed with frequency.PSD analysis is carried out for the real data signals with in age group 25-35 of both gender.
3.1
Power spectral Density
Power spectral density (PSD), which describes how the power of a signal is distributed with frequency. Power spectral density shows the strength of the variations(energy) as a function of frequency.[14] That means, it shows at which frequencies variations are strong and at which frequencies variations are weak. The unit of PSD is energy per frequency (width) and can be obtain energy within a specific frequency range by integrating PSD within that frequency range. The definition of power spectral density generalizes in a straight manner to finite time series with 1≤n≤N,such as signal sampled at discrete times xn = x(n∆t) for a total measurement period T = N∆t.[15]
(1)
In a application, one would typically average this single-measurement PSD over several repetitions of the single-measurement to obtain more accurate estimate of theoretical PSD of the physical process underlying the individual measurements. This computed PSD is sometimes called periodogram. One can prove that this periodogram converges to the true PSD when the averaging time interval T goes to infinity to approach the Power Spectral Density (PSD).[16]
Welch's method is improvement on the standard periodogram spectrum estimating method and on Bartlett's method, in that it reduces noise in the estimated power spectra in exchange for reducing the frequency resolution.[17]
PURPLE inPurple
YELLOWinYellow
ww
Blank Slide
Blank Slide
RED in Red
BLUE in Blue
Slide
GREEN in Green
PURPLE in Gray
YELLOW in Red
Blank Slide
Blank Slide
RED in Blue
BLUE in Green
Slide
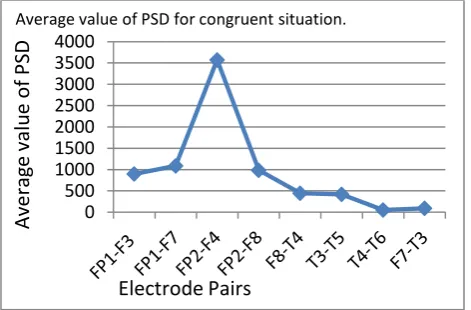
In the Stroop task, PSD is calculated by both the methods, Welch method and periodogram method for both situation that is, congruent as well as incongruent situation. The PSD values for congruent situation by welch method is as follows,
Fig 3: Average value of PSD for congruent situation by welch method
The PSD values for congruent situation by periodogram method is as follows,
Fig 4: Average value of PSD for congruent situation by periodogram method.
In figure 3, the plot is plotted between the electrode pairs and average value of power spectral density by Welch method for congruent situation. Figure 4 gives, the PSD values for congruent situation by periodogram method. The plot is plotted between the electrode pairs and average value of power spectral density by periodogram method for congruent situation. In figure 5, the plot is plotted between the electrode pairs and average value of power spectral density for incongruent situation. Figure 6 gives, the PSD values for congruent situation by periodogram method. The plot is plotted between the electrode pairs and average value of power spectral density by periodogram method for incongruent situation.
[image:3.595.308.549.73.231.2]The PSD values for incongruent situation by Welch method is as follows,
Fig 5: Average value of PSD for incongruent situation by welch
method
The PSD values for incongruent situation by periodogram method is as follows,
Fig 6: Average value of PSD for incongruent situation by periodogram method
4.
RESULT AND ANALYSIS
The coherence analysis is a kind of study based on spectrum analysis, which describe the synchronization of the brain electric activities of different frequencies between the brain areas. Coherence analysis can detect coordination of the EEG rhythms between the brain areas.
4.1
Coherence
The coherence analysis is based on power spectrum estimation. The coherence between two signals x(t) and y(t) is real-valued function that is defined as, magnitude squared value of the cross-power spectrum divided by the product of cross-power of the spectra of both signals are completely correlated.[6] Equation (2) is an equitation for analysis of coherence of EEG signals.
(2)
Where, Gxy - Cross-spectral density between x and y, Gxx - Auto spectral density of x, Gyy - Auto spectral density of y. When the phase difference and amplitude ratio between two signals are remain unchanged, the coefficient equals 1, that is, two signals are more coherent, otherwise trends to 0, that is, two signals are non coherent. Means, when two area of brain are
0 500 1000 1500 2000 2500 3000 3500 4000
Average value of PSD for congruent situation
Electrode Pairs
Ave
rag
e
valu
e
o
f
P
SD
0 500 1000 1500 2000 2500 3000 3500 4000
Average value of PSD for congruent situation.
Electrode Pairs
Ave
rag
e
valu
e
o
f
P
SD
0 500 1000 1500 2000 2500 3000
Average value of PSD for Incongruent situation
Electrode Pairs
Ave
rag
e
valu
e
o
f
P
SD
0 500 1000 1500 2000 2500 3000 3500 4000 4500
Electrode Pairs
Average value of PSD for Incongruent situation
Ave
rag
e
valu
e
o
f
P
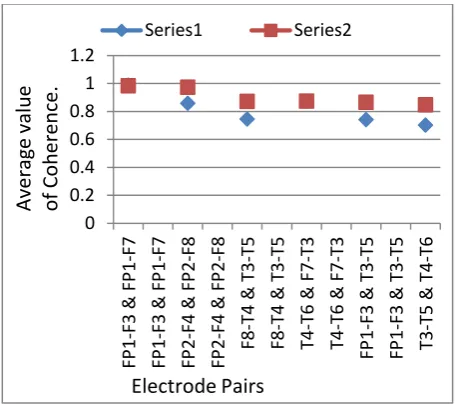
[image:3.595.55.289.123.296.2] [image:3.595.308.536.303.459.2] [image:3.595.55.291.369.524.2]more synchronous to each other the result is nearer to 1 that is, they are more coherent to each other, otherwise non coherent means nearer to 0.[7] Regarding to stroop task we are check the coherence between the situation that is, in congruent situation as well as in incongruent situation. The coherency for congruent situation is higher than incongruent situation.[8] The higher coherency ranges from 0.8 -1 while mild coherency ranges from 0.6 -0.8. In the plots the series 1 is the average value of coherence for an incongruent situation while series 2 is the average value of coherence for a congruent situation.
Figure 7 gives, the plot between the electrode pairs and average value of coherence of congruent situation and incongruent situation by welch method. The red square denotes the average value of coherence for a congruent situation while blue diagonal denotes the average value of coherence for an incongruent situation. The figure 8, is the plot between the electrode pairs and average value of coherence of congruent situation and incongruent situation by periodogram method. The blue diagonal denotes the average value of coherence for an incongruent situation while red square denotes the average value of coherence for a congruent situation while.
[image:4.595.55.291.310.528.2]Fig 7: Average value of coherence between the congruent and incongruent situation by welch method
Fig 8: Average value of coherence between the congruent and incongruent situation by periodogram method
5.
CONCLUSION
From Figure 7 and Figure 8, high coherence is found generally in congruent situation of the Stroop task. Mild coherence is found generally in incongruent situation of the Stroop task. High coherence is found in frontal lobe. Mild coherence is found in frontotemporal lobe as well as temporal lobe. The results showed the coherence between FP1-F3 and FP1-F7, FP2-F4 & FP2-F8 were stronger than that between F8-T4 & T3-T5 FP1-F3 & T3-T5 in some concentrated. It implied that there was strong coherence during most of the time span between the left hemisphere and the right hemisphere, and two hemispheres were coordinative in Stroop task.[13] It indicated that there was evident interaction between the frontal lobe and the temporal lobe, and it was consistent with the result from Shalev. [19]
6.
ACKNOWLEDGMENTS
We wish to express my warm and sincere thanks to Prof. A.D.Gaikwad HOD of Instrumentation Department, CCOEW, Pune for his support. We would like to thank my family members, friends and batch mates for their constant encouragement, advice and support. Last but not the least we would like to express our sincere gratitude to Dr. D.Y. Patil Medical College & Research Centre, Pimpri, Pune for his full co-operation.
7.
REFERENCES
[1] A book by Steven Pinker”How the Mind Works”.
[2] Robert W. Thatcher, Ph.D., Carl J. Biver, Ph.D. and Duane M. North, MA.”EEG and Brain Connectivity: A Tutorial”2009.
[3] H. Petsche and S.C. Etlinger “EEG and Thinking” Verlag der OAW. Wien 1998.
[4] Valer Jurcak, Daisuke Tsuzuki, and Ippeita Dan”10/20, 10/10, and 10/5 systems revisited: Their validity as relative head-surface-based positioning systems.”(2007).
[5] B. Schack, G. Seide, W. awe, F. Heinrich, U. Krause “Coherence Analysis Of The Ongoing EEG By Means Of Microstates Of Synchronous Oscillations”,IEEE(2001). [6] Xiaotong Wen, Kai Yin, Dongzhi Sun, Li Yao1, Xiaojie
Zhao, “Application of Time-varying Coherence to
0 0.2 0.4 0.6 0.8 1 1.2 FP1 -F3 & FP1 -F7 FP1 -F3 & FP1 -F7 FP2 -F4 & FP2 -F8 FP2 -F4 & FP2 -F8 F8 -T 4 & T 3 -T5 F8 -T 4 & T 3 -T5 T4 -T 6 & F7 -T3 T4 -T 6 & F7 -T3 FP1 -F3 & T3 -T5 FP1 -F3 & T3 -T5 T3 -T 5 & T4 -T6
Series1 Series2
Electrode Pairs
Ave
rag
e
valu
e
o
f
Co
h
erence.
0 0.2 0.4 0.6 0.8 1 1.2 FP1 -F3 & FP1 -F7 FP1 -F3 & FP1 -F7 FP2 -F4 & FP2 -F8 FP2 -F4 & FP2 -F8 F8 -T 4 & T 3 -T5 F8 -T 4 & T 3 -T5 T4 -T 6 & F7 -T3 T4 -T 6 & F7 -T3 FP1 -F3 & T3 -T5 FP1 -F3 & T3 -T5 T3 -T 5 & T 4 -T6Series1 Series2
Coordinative Connectivity Based on Event RelatedEEG”.IEEE 2007.
[7] C. Andrew, and G. Pfurtscheller, “Event-related coherence as a tool for studying dynamic interaction of brain regions”,
Electroencephalography and clinical Neurophysiology, vol. 98, 1996, pp. 144-148.
[8] B. Schack, G. Grieszbach and W. Krause ‘The sensitivity of instantaneous coherence for considering elmentary comparison processing. Part 1.” Int. J. Psychophysiol. 31, pp. 219-240, 1999
[9] Xiaofeng Liu, Huan Qi, SupinWang, MingxiWan”Wavelet-based estimation of EEG coherence during Chinese Stroop task”Computers in Biology and Medicine 36 (2006). [10] B. Schack, A.C.N. Chen, S. Mescha and H. Witte
“Instantaneous EEG Coherence Analysis during the Stroop Task,” Clin.Neuropliysiol. 1 10, pp. 14 10-1426, 1999 [11] D.L. Peng, T.M. Guo, J.H. Wei, and L.H. Xiao, “An ERP
Study on Processing Stages of Children's Stroop Effect”,
Science Technology and Engineering ,vol. 4, 2004, pp. 84-88.
[12] X. Wen, X. Zhao, and L. Yao, “Time-Frequency analysis of EEG based on event related cognitive task”, Lecture Notes in Computer Science, vol. 3973 , 2006, pp. 579- 585. [13] Simon Brean, Veronika Rutar, Vito Logar, Bla Koritnik,
Gregorij Kurillo, Ale Beli, Janez
Zidar”Electroencephalographic (EEG) Coherence Between
Visual And Motor Areas Of The Left And The Right Brain Hemisphere While Performing Visuomotor Task With The Right And The Left Hand”(2007).
[14] Bahar Guntekin , Erol Basar”A new interpretation of P300 responses upon analysis of coherences”(2010).
[15] Adey, W.R., Walter, D.O. and Hendrix, C.E. Computer techniques in correlation and spectral analyses of cerebral slow waves during discriminative behavior. Exp Neurol. 1961, 3:501-24.
[16] Bendat, J. S. & Piersol, A. G. (1980). Engineering applications of correlation and spectral analysis. New York: John Wiley & Sons.
[17] B. Schack, G. Grieszbach, H. Nowak, and W. Krause,“The sensitivity of instantaneous coherence for considering elementary comparison processing. Part II: similarities
anddifferences between EEG and MEG
coherences”,International Journal of Psychophysiology, vol. 31, 1999, pp. 241-259.
[18] L. Shalev, and D. Algom, “Stroop and Garner effects in and out of Posner' s beam: reconciling two conceptions of selective attention”, Journal of Expermental psychology: Human Perception and Performance, vol. 26, 2000, pp. 997-1017.