A Formal Attack Centric Framework Highlighting
Expected Losses of an Information Security Breach
Harsh Srivastava
Indian Institute of InformationTechnology Allahabad, India
Kamlesh Dwivedi
Indian Institute of InformationTechnology Allahabad, India
Prabhat Kumar Pankaj
Indian Institute of InformationTechnology Allahabad, India
Vijaishri Tewari,
PhD.Asso.Prof. & Head International Division MBA-IT & MSCLIS DIVISION Indian Institute of Information Technology
Allahabad, India
ABSTRACT
From the beginning of the different approaches for analyzing and assessing the information related risk affecting organization, the two factors deriving risk are the damages or losses incurred to the organization and the probability of occurring of those risk incidents. Many qualitative and quantitative models have been proposed to estimate the above two factors considering the asset centric and software centric approaches. This paper proposes an attack centric framework that considers approaches of an attacker and different characteristics of attack in computing the overall impact of attack which can then be used to effectively calculate the overall loss incurred to the organization in the event of successful attack. This framework cognate with the existing ones and steps forward with a new mathematical approach to estimate the cost of any type of loss incurred to the organization due to the information security breach. Also the framework considers the cost of implementing security as loss in the event of security measure failed in providing appropriate protection against the threats.
General Terms
Risk assessment framework
.
Keywords
Attack centric framework, Expected losses, Attack strength, Security strength, Impact of attack.
1.
INTRODUCTION
Today information security issues for an organization not only considers about how to protect their assets from different types of threats but also considers appropriate use of these assets in achieving their organizational goals without spending a lot on securing them. This requires security administrators of these organizations to properly understand different approaches of risk assessment. These different approaches are asset centric, software centric and attacker centric. The existing risk assessment approaches provides ways for effectively calculating the losses incurred to the organization as well as the probabilities for these risk incidents affecting organizational assets [1][2].Asset centric approaches considers assets as their center point and starts from evaluating the impact of attacks on these assets monitory values. Software centric approaches take into consideration the design aspects of the system and attempt to evaluate the
risk on the basis of vulnerabilities existing in the infrastructure of the system. Attacker centric approach is a new dimension considering the attacks and attacker as the basis for evaluating impact of attacks over organizational assets. This paper provides an attack or attacker centric framework deriving an equation for effectively calculating the losses that may result from the exploitation of vulnerabilities by an attacker. It also considers the effort taken by attacker to exploit the vulnerability as well as different characteristics of attack like time value for attacks, propagation level of attacks and many such characteristics that together provides a way of making comparison between attack strength and security strength to compute the impact of attack.
1.1
Overview
As shown in Figure 1, This framework organizes the organizational assets capable of acquiring some information or capability (i.e. password or some other access privileges parameters) in the form of nodes of a graph and attack as the directed arrows from one node to other so as to address those attacks also that affect or make use of other assets and system capabilities while attacking on their target machines or assets. Example of such attacks may be the DOS or DDOS attacks and similar attacks that require a number of compromised machines for initiating their attacks. This brings the concept of related compromised nodes in this framework and thus properly represents and facilitates the overall process of calculating the expected losses in such scenarios. The nodes are connected to each other with undirected edges representing channel that makes possible for an attacker to gain access to related compromised nodes.
As far as formation of nodes is considered it depends on the organization or its security administrators on how they approach to organize the organizational assets as for example the different types of servers placed in the demilitarized zone may be considered as individual nodes or they may be summed up as a definite node having an associated value and a definite security system applied over it. This may ease the process of calculating the expected loss.
through N1, N2 and N3. He may proceed in his attack by first exploiting the vulnerabilities of a easily compromised node and then moving further to compromise the related nodes using access privileges gained on the previous node. At each related node the asset value is lost and its value can be calculated by multiplying the total value of all the assets contained in the node and impact of attack on the node and this process can be carried out at distinct node levels to calculate the overall expected loss. While the attacker traverses through different nodes certain costs are incurred to the attacker[3] and certain losses are incurred to the organization as well. As a result, This attack centric framework can be summarized as an effective method of calculating the loss of an information security breach by taking into consideration different aspects of an attack as well as an attacker.
Figure 1: An Attack scenario on related nodes of an organization infrastructure
1.2
Comparative study between existing
techniques of the proposed framework
Although the proposed framework is based on an entirely new idea of how to mathematically model the characteristics of an attack and the approaches of an attacker in calculating the impact of an attack but then also it has its roots from the different methods of risk modeling and assessment. And so in this section we tried to throw some light on these existing techniques and derive a comparison with the proposed framework. The first generation of risk modeling starts with the fault tress made for the analysis of system failures. The root of this tree consists of the undesirable event causing the system failure and the probable causes were added to the trees as series of logic expressions. In this way an AND-OR tree was created where edges were associated with the failure probabilities and calculates the single or multiple fault probability. Although the model clearly states about combination of faults but it fails in properly modeling attacks. Thereafter state transition approaches evolved that models attacks from a series of initially secure states to some compromised states. One of the earliest state transition approaches include attack graphs representing and detecting attacks. Although the model successfully analyzes and represents the security problems, it creates an unnecessary burden on the analyst in representing all possible attack actions.
Attack graphs were succeeded by the privileged graphs in which users or a group of users owns a set of privileges and
privilege escalation was shown by the arcs through some vulnerability exploitation. These privilege graphs could also be converted into attack graphs by finding all the ways in which the required privileges could be gained.
In our proposed framework we are using the same approach as of the state transition approaches in modeling the different attack scenarios in form of nodes and edges but the basis and mathematical calculation of our framework lies on the attack characteristics and the approaches of an attacker in exploiting the vulnerabilities of the system and thus calculating the impact of attack and finally calculating the expected losses of different information security breaches. The aspect of the framework that an attacker could compromise multiple nodes is similar to the state transition approaches.
1.3
Paper Structure
Organization of the paper is as follows. A detailed description of the framework components is given in section 2 of this paper. Section 3 deals with deriving an equation for calculating expected losses on particular nodes and calculating the relative equation components. Further section 4 discusses about future works to be done and finally concluding the paper.
2.
ATTACK CENTRIC FRAMEWORK
COMPONENTS
This part of paper deals with articulating the various factors for calculating the overall loss incurred by an organization due to successful exploitation of vulnerabilities by the attackers on particular nodes.
2.1
Preliminaries
Before proceeding towards explaining the framework, some formal definitions of the components or terms used in the framework are given in this section. These terms have their formal meanings or they have been defined in accordance with the proposed framework.
Node (N) Any entity or collection of entities in the organizational infrastructure capable of acquiring an information or capability of some value. It could be any asset (hardware, software or information). E.g. database server, web server or simply a computer containing confidential data and could also be any collection of such servers in the demilitarized zone.
Value (V) Total value of all the assets (having some information or capability) contained in the node.
Loss (L) Expected Asset value loss due to the exploitation of the vulnerabilities existing on the node containing that asset. Impact (I) Impact of attack on nodes containing assets. Attack Strength Effectiveness of an attack in providing loss to the organizational asset.
Security Strength Effectiveness of the security measures in providing resistance against the attacks.
Security Implementation cost (S) Cost of implementing security on all or particular nodes of an organizational infrastructure.
Attack types Type of attack performed by the attacker or the approach taken by the attacker to exploit the organizational resources. These attack may be an internal attack exploiting resources of the organization itself or the external attacks on different facilities provided by the organization[4]. An attacker may perform attack on the basis of his predefined
N1
N4
N5
N3
N2
goals as like he may be targeting the services provided by the company publically or may be using the computing facilities provided by the company internally. The attack type has great impact on determining the observational values of different characteristic parameters of attack.
2.2
Development of the scenario of attack
The general scenario presented in Figure 1 is intended for modeling different attack situations that might be faced by the organizations during event of attack. Different attack scenarios like various forms of network attacks and insider and outsider threats can be modeled using this approach. As shown in above Figure 1, this framework considers the assets of the organization as contained on individual nodes and it is assumed that some way or the other these organizational assets are attached to some other assets also, so each node is part of series of nodes attached with other nodes. Also there exists a channel of communication in the form of edges between these nodes. Following this, if an attack occurs on a node then there is a possibility for compromising of all other nodes attached to the organization and in this way the informational/computational information stored in the node is also compromised. So in this way by calculating the expected loss on each individual node, total loss by an attack can be calculated and that may help an organization in quantitatively estimating damage factor of risk assessment.
Figure 2 represents the losses occurring on particular nodes due to the impact of attack on the total values of all the assets contained in the node. Figure 2 is a small representation of how an attack could be performed on related nodes as result of which losses occur to the organizational assets contained in the nodes. Depending on organization infrastructure and size and also on how an organization organizes its assets the number of nodes could be increase up to N number.
L1 Asset expected value loss on Node (N1)
L2 Asset expected value loss on Node (N2)
Figure 2:Asset RelatedLosses on Nodes
3.
FORMATION OF EQUATION AND
CALCULATION OF EQUATION
COMPONENTS
According to the explained scenario of attack in Figure 1 and Figure 2, If Ni is the set of compromised nodes in sequence from i1 to N ( Total nodes in the organization infrastructure in a given context specified by the organization itself) Then the expected loss incurred to the organization node can be formulated as
)
1
(
...
1
N
i i
L
E
This equation only represents assets expected value loss on nodes and hence is incomplete. some other parameters will be included in the equation.
3.1
Calculation of L (Asset expected value
loss)
[L=Total value of all the assets contained in the node (V)* Impact of attack on individual nodes (I)]
3.1.1
Calculating V
Asset values can be calculated from the asset register that an organization maintains to manage and keep track of their assets[5]. Also an organization can range the value of their assets on the basis of following characteristics.
i) Criticality of the Information /computational asset: How important an asset is for the organization’s working?
ii) Sensitivity: Importance of asset for maintaining the organization’s liability and competitive advantage.
iii) Cost of deploying assets: These values can be summed up to get a definite value of all the assets contained in the node and this value is termed as V.
3.1.2
Calculating I (Impact)
In this framework two parameters are considered necessary for calculating the impact of an attack on particular nodes. These parameters are Attack strength and security strength. The comparison between these two will give a definite probabilistic value for impact. Attack strength and security strength are observational values that depend on certain other parameters that are based on attacks or represent some characteristics of attack. To reduce complexity of computation these parameters are ranged as Low (L) or High (H).
Attack strength depends on :
i) Attack surface: Attack surface represents the total attack vectors or likely opportunities to attack that an attacker could find as potential vulnerabilities. An organization security analyst observes the attack surface on all particular nodes as low or high depending on the type of assets contained in the node and related attack vectors. The computation of low or high values for attack surface is carried out by comparison between different versions of the system or assets contained in the node[6]. ii) Attacker’s effort: It’s a measure of the difficulty faced by an attacker in performing attacks on a particular node. Through the use of tools, an organization security expert who has deeper understanding of the assets and systems contained in the node can build a list of attacks on systems and can develop a measurement scale of low or high for attacker’s effort depending on assets and the security implemented on assets to resist that attack for a definite timeframe. For example, difficulty faced and time taken by an attacker can be observed in breaking a password of 8-characters long containing special 8-characters. iii) Propagation level: It’s a measure of the
attack capability to propagate within an organization infrastructure from one node to other during the event of attack. It depends on attack type and can be based on the known attack features identified from the past history of attacks.
N1
Security strength depends on :
i) Resistance offered: It represents the efficiency of a security measure in providing protection to the nodes containing assets. An organization security administrator possibly can make a database of its security methods and policies that an organization adopts, the organizational assets covered in the policy and ability of security systems in working under extreme conditions like heavy traffic and minimum resources and then based on these parameters can rate the resistance offered on a node as low or high.
ii) Scope of discovery: It’s a measure of the possibility of an attack to get discovered by the security systems before incurring much harm to the nodes. It can be observed as low or high from the history of attacks determining the time period in which a particular attack was identified by the security systems. It also depends on the attack type.
iii) Time value for attack: It’s a measure of the rate of success of an attack in a given timeframe. More the rate of success of an attack in a given time frame, low is the security strength. It can be analyzed by the user profile using and managing the assets. There are tools available like IDES and NIDES that provides analysis of rate of success of an attack based on behavioral aspects of user and their collaboration with the security systems[7].
3.1.3
Rules for calculating Aggregate values of
Attack strength and Security strength
Once metrics driving attack strength and security strength are observed as low or high values, there is need to get aggregate low or high value for attack and security strength. Since all these metrics are present during the event of an attack, the majority metric value will determine the aggregate value as specified by the following rules:
Rule 1:- If number of Low (L) in metric values > number of High (H), Then Aggregate value = L.
Rule 2:- If number of High (H) in metric values > number of Low (L), Then Aggregate value = H.
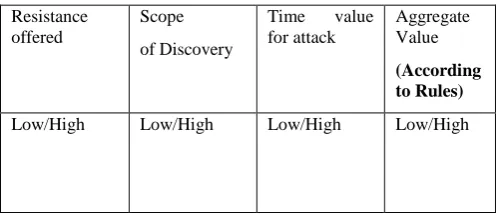
[image:4.595.310.559.86.193.2]3.1.4
Metric Tables
Table 1 for calculating Attack strength
Attack Surface
Attackers effort
Propagation level
Aggregate Value
(According to Rules)
Low/High Low/High Low/High Low/High
Table 2 for calculating Security strength
Resistance offered
Scope of Discovery
Time value for attack
Aggregate Value (According to Rules)
Low/High Low/High Low/High Low/High
Once Attack strength and Security strength are calculated, The Impact(In terms of probability) of Attack on Node could
[image:4.595.48.299.590.719.2]be easily predicted by the following Table as follows:- Table 3 for calculating Impact
Attack Strength
Security Strength
Impact
L H Very Low (VL)
L L Low (L)
H H High (H)
H L Very High (VH)
The scale for Impact is given below:-
VL= 1/4 = 0.25 L= 2/4 = 1/2 = 0.5 H= 3/4 = 0.75 VH = 4/4 = 1
After Impact is calculated, The next step is to calculate the Information Asset Expected loss(L) as:
Loss (L) = Value (V) * Impact (I) So now Equation 1 is transformed as,
)
2
(
)...
*
(
1
i
N
i
i
I
V
E
Note: Attack strength and security strength are observational values and are not precise. It depends on the organizational infrastructure and size.
[image:4.595.316.514.631.678.2]3.2
Calculation of security related
parameter S
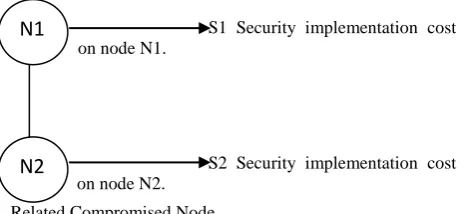
This parameter is included to represent the loss due to failure of a security measure in providing protection and controls to the node containing asset value. Figure 3 represents security implementation costs on related compromised nodes.
S1 Security implementation cost on node N1.
S2 Security implementation cost on node on node N2.
[image:5.595.51.283.153.260.2]Related Compromised Node
Figure 3:Security related Losses on Nodes
In many scenarios,
S1 >> S2
i.e., Security implemented at the bigger node is more comparison to the related compromised nodes. This security implementation value is dependent on the asset value. e.g. If possibility of attack is on a server and on its related client nodes then higher security is implemented on the server while less security is implemented on the client nodes. There has been many models that reflects the evaluation of security of information systems in different scenarios but do not considers the cost of deploying and managing those security systems [8]. This framework tried to include those as parameters for estimating information security losses. Parameters for calculating security implementation cost are as follows:-
3.2.1
Hardware / software cost (C1
)Monitory value of devices required in setting up a security system on a node.
3.2.2
Security Awareness training cost (C2)
Many security systems are new and often require employees of an organization to know and train themselves in properly using these systems. e.g. Setting up a UTM device or complying with some security framework like PCI or ITIL may require organization employees to get interacted with it and this may result in some cost to the organization and hence in the event of a failure results in loss. The importance of security awareness training is reflected in [9][10].This value can be calculated as:
[Security Awareness training cost = Employees salary under training * Number of days of training * Cost of kit provided * number of employees]
3.2.3
Cost of monitoring effectiveness of the
security system (C3)
This may include the cost of performing an internal or external audit.
So Security Implementation cost (S) could be calculated as, [S = C1 + C2 + C3]
3.3
Final equation highlighting expected
loss of an information security breach
As until now all parameters relating to the framework have been calculated so the final equation deriving Expected loss is,
Adding security parameter in equation (2), the final equation becomes
Expected loss (E) =
(
*
)
...
(
3
)
1
i i
N
i
i
I
S
V
This is the overall loss expected from the successful attack on an initially compromised node and its related compromised nodes.
4.
CONCLUSIONS AND FUTURE
DIRECTION
This paper presents an attack centric framework deriving an equation for effectively calculating the losses due to an attack targeted on the information and other assets of an organization. The approach considered here evaluates the impact of attack on organizational assets based on the certain identified characteristics of attack and the approaches of an attacker in exploiting the vulnerabilities. The relative comparison between attack strength and security strength using mathematical approach for computing the impact of attack is the unique feature of work presented here. The proposed framework tried to cognate with the existing qualitative and quantitative methods of computing the damages done by attack and then presents it with new concepts of how it could be modeled from the attack and attackers perspective. Also different calculative metrics used here like scope of discovery of attacks and time value of attacks could help in enhancing the knowledge base of security analysts and could guide the evolution of new security measures to be put at right place. With the proper use of this framework an organization could understand about how to organize its assets and put proper security measures to minimize the loss occurring due to security breach.
In future, the work presented here can be extended in three directions:
To include more and more attack and attacker related parameters for calculating impact and making it more attack centric. Also considering the security analysts moral hazards as parameters[11]. Deriving new formulae for calculating aggregate
values of attack strength and security strength. Determine the probability of such attacks based on
the same attack centric approach as like considering the capability of tools of an attacker to attack, attackers point of view of how he approaches to exploit the vulnerabilities or loop holes existing in the organization to devise out a formal Attacker centric Risk Assessment model.
5.
REFERENCES
[1] FAIR-Factor Analysis of Information Risk, A Framework For understanding, Analyzing and Measuring
risk, Retrieved from
www.isaca-cincinnati.org/Resources/Presentations/FAIR.pdf
N1
[2] OCTAVE - Operationally Critical Threat, Asset, and Vulnerability Evaluation, Retrieved June 3, 2005 from http://www.cert.org/octave/approach_intro.pdf,
[3] Chinchani R., Iyer A., Ngo H., upadhyaya S.,”A Target centric formal Model For insider Threat and More”,
Pages 5-7, Retrieved from
http://www.cse.buffalo.edu/tech-reports/2004-16.pdf [4] Ngoma S.,(March 04,2012), “Vulnerability of IT
Infrastructures: Internal and External Threats”, Retrieved from www.congovision.com/IT-Security-Pub.pdf [5] Information Asset register-The National Archives,
Retrieved at
http://www.nationalarchives.gov.uk/documents/informati on-management/info-asset-register-factsheet.pdf [6] Howard M., Pincus J., Wing J. M., (January
1,2003),”Measuring relative attack surfaces” , Retrieved from www.cs.cmu.edu/~wing/publications/Howard-Wing03.pdf
[7] Lunt T. F., Tamaru A., Gilham F., Jagannathan R., Jalali C., Neumann P.G.,(February 28,1992),”A REAL-TIME
[8] INTRUSION-DETECTION EXPERT SYSTEM
(IDES)”, Retrieved from
www.csrdc.us/papers/9sri/9sri.pdf
[9] Ortalo R.,” Quantitative Evaluation of Information System Security Experimented in a Bank Organization”,
Pages 2-4, retrieved from
http://homepages.laas.fr/deswarte/Publications/99587.pdf [10]Lindholm L., FISSEA-2006 conference, “What is Security Awareness”, Retrieved from
http://csrs.nist.gov/organizations/fissea/2006-conference/Lindholm-FISSEA2006.pdf
[11]Anderson K., ISSA Journal(January 2013), “Can We Make Security Awareness Training Stickier?”, Retrieved from
www.issa.org/resource/resmgr/journalpdfs/feature0113.p df
[12]Munteanu A. ,”Information Security Risk Assessment: [13]The Qualitative Versus Quantitative Dilemma”,
Retrieved from