http://dx.doi.org/10.4236/ajps.2014.511187
Zinc Requirements of Tropical Legume
Cover Crops
Nand K. Fageria
1, Virupax C. Baligar
2, Marshall K. Elson
21National Rice and Bean Research Center of EMBRAPA (Empresa Brasileira de Pesquisa Agropecuária), Santo
Antônio de Goiás, Brazil
2Beltsville Agricultural Research Center, USDA-ARS, Beltsville, USA
Email: Nand.fageria@embrapa.br
Received 8 April 2014; revised 7 May 2014; accepted 21 May 2014
Copyright © 2014 by authors and Scientific Research Publishing Inc.
This work is licensed under the Creative Commons Attribution International License (CC BY).
http://creativecommons.org/licenses/by/4.0/
Abstract
Tropical soils are deficient in essential plant nutrients, including zinc (Zn). Using cover crops in cropping systems is an important option to improve soil fertility for sustainable crop production. However, success of cover crops in highly weathered tropical infertile acid soils is greatly influenced by adequate levels of available soil micronutrients. A greenhouse experiment was conducted to evaluate the Zn requirements of ten major tropical legume cover crops. The Zn levels used were 0, 10, 20 and 40 mg·kg−1 soil. Overall, shoot and root dry weight and maximum root length increased significantly in a quadratic fashion with increasing Zn rates in the range of 0 to 40 mg·kg−1. The Zn × cover crops interactions for shoot and root dry weight, maximum root length, Zn concentration (content per unit dry weight), Zn uptake (concentration × dry weight) and Zn use efficiency (dry weight per unit Zn uptake) were significant, indicating variation in these traits with the change in soil Zn levels. Collectively, maximum shoot dry weight was achieved with the application of 22 mg Zn·kg−1 of soil. Similarly, maximum root dry weight and root length were obtained with the addi-tion of 22 and 17 mg Zn·kg−1 soil, respectively. Overall, Zn concentration and Zn uptake were sig-nificantly increased in a quadratic manner with the increase in the soil Zn levels in the range of 0 to 40 mg·kg−1. However, Zn use efficiency (dry weight per unit Zn uptake) decreased in a quadratic fashion with the increasing soil Zn levels from 0 to 40 mg·kg−1. Jack bean, black velvet bean, pueraria, and gray velvet bean with high Zn use efficiency appear to be suitable cover crops for low Zn soils.
Keywords
Root and Shoot Dry Weight, Root Length, Zn Use Efficiency
1. Introduction
micronutrients, including Zn, in crop plants is related to several soil and plant factors. These factors are low nat-ural levels of micronutrients in the soils, use of high yielding cultivars, liming of acid soils, interactions among macro and micronutrients, planting on sandy and calcareous soils, increased use of high analysis fertilizers con-taining low amounts of micronutrients, and decreased use of organic amendments such as animal manures, composts, and crop residues [1] [2]. Graham [3] reported that half of the world’s soils are intrinsically deficient in Zn. Zinc deficiency in annual crops is reported in Brazil [4], Australia [3], India [5], China [6], Turkey [7], Europe[8], USA [9], and Africa [10].
In Brazil, Zn deficiency is very common in crop plants grown on Oxisols and Ultisols, which are acidic and have low concentrations of Zn [1] [4] [11]. In addition, these soils require liming to reduce soil acidity, improve Ca and Mg contents and increase activities of beneficial microorganisms. Zn deficiency in these soils has been reported in upland rice, corn, sorghum, wheat, soybean and dry bean [12]. In addition to Zn, these soils are also deficient in N, P, Ca, Mg, S, B and Cu [1] [13] [14]. The strategies which can be adopted to improve trients uptake by crop plants can be divided into two groups. In the first group, bioavailability of soil micronu-trients can be improved by adopting practices such as use of adequate rate, proper sources and suitable methods of application. Fertilizer management practices (source, rate, placement, and application time) should be opti-mized based on soil, plant, and climatic factors to reduce mineral losses (leaching, runoff, fixation) and improve their availability [1]. Improvement and consideration of these factors will enhance recovery of added fertilizers
[1]. Cakmak [7] also reported that agronomic biofortification is of great importance in enriching the seeds of food crops with Zn. In the second group, use of crop species or genotypes within a species which are efficient in micronutrients uptake and translocation to the grain can improve Zn utilization efficiency [14] [15].
Cover crops are important components of cropping systems in improving soil fertility, controlling weeds, diseases and insects [16]. In addition, cover crops also help in conserving soil moisture, reducing soil erosion and improving soil microbiology [16] [17]. Information is limited on the response of cover crops to Zn fertiliza-tion in acidic, infertile tropical soils of South America. Cover crop species having high Zn efficiency might produce higher yields and persist longer when grown on infertile soils where the supply of Zn is limited [18] [19]. The objectives of this study were to evaluate the influence of soil Zn levels on shoot and root growth and nutrition and use efficiency of Zn in ten important tropical legume cover crops.
2. Materials and Methods
A greenhouse experiment was conducted to determine Zn requirements of ten tropical legume crops. The soil used in the experiment was an Oxisol whose chemical and physical properties were: pH 5.1, Ca 0.2 cmolc·kg−1, Mg 0.2 cmolc·kg−1, Al 0.1 cmolc·kg−1, K 30 mg·kg−1, P 0.3 mg·kg−1, Zn 0.2 mg·kg−1, Cu 1.6 mg·kg−1, Fe 30 mg·kg−1, Mn 7 mg·kg−1, and organic matter 1.4 g·kg−1. Soil textural analysis was clay 594 g·kg−1, silt 147 g·kg−1 and sand 258 g·kg−1. Soil analysis methods used in this study are described in a soil analysis manual published by EMBRAPA [20].
Cover crops used for the experiment are listed in Table 1. Zinc levels used were 0, 10, 20 and 40 mg Zn·kg−1 of soil and applied as zinc sulfate (23% Zn). Basic fertilizer rates used were N 200 mg·kg−1, P 200 mg·kg−1 and K 200 mg·kg−1. Nitrogen was applied as urea, P applied as triple superphosphate and K applied as potassium chloride. One g of dolomitic lime (1 g·kg−1 soil) was thoroughly mixed with the soil six weeks before sowing of the cover crop seeds. The experiment was conducted in plastic pots with 7 kg soil in each pot. The experimental design was a randomized block arranged in a split plot. Zinc levels were the main plots and cover crops were the sub-plots. Each experimental unit was replicated three times. After germination, four plants were maintained in each pot. Plants were harvested 50 days after sowing. After harvesting the shoots, roots were removed from the soil manually and washed in water and distilled water several times. Maximum root length was measured. Plant materials were dried in a forced draft oven at 70˚C to a constant weight to determine the dry weight of shoots and roots. Plant shoots were ground and analyzed for Zn according to the methods described by Silva [21].
Zinc use efficiency was calculated by using the following equation:
(
1)
Dry weight in mgZn use efficiency mg μg
Uptake of Zn in μg
−
⋅ =
Table 1. Common and scientific names of ten legume cover crop species used in the experiment.
Commonname Scientificname
1. Sunn hemp Crotalaria juncea L.
2. Smooth crotalaria Crotalaria mucronata (C. pallida Aiton)
3. Showy Crotalaria Crotalaria spectabilis Roth
4. Calopo Calopogonium mucunoides Desv.
5. Pueraria (Tropical Kudzu) Pueraria phaseoloides Roxb.
6. Pigeonpea (black) Cajanus cajan L. Millspaugh
7. Lablab Lablabpurpureus (L.) Sweet (Dolichos Lablab)
8. Black velvet bean (Black mucuna bean) Mucuna aterrima (Piper & Tracy) Holland (M. pruriens, L. DC.)
9. Gray velvet bean (Gray mucuna bean) Mucuna cinereum L.
10. Jack bean Canavalia ensiformis L. DC.
regression models were used to describe Zn rate versus Zn concentration, Zn uptake and Zn use efficiency in the plants. Similarly, the relationship between soil chemical properties and shoot dry weight was determined by qu-adratic regression model to calculate values of soil chemical properties for maximum dry weight. The ququ-adratic model is a second order polynomial function written as:
2 Y= +a bX+cX
where Y = the estimated yield, X = application rate of Zn. The a, b, c, are coefficients estimated by fitting the model to the data. The quadratic function assumes that cover crop shoot dry weight, root dry weight and maxi-mum root length, Zn concentration and uptake in the plant tissues will increase at a decreasing rate as the Zn ap-plication rate increases until the maximum yield is achieved at a determined Zn rate.
3. Results and Discussion
3.1. Shoot Dry Weight
The shoot dry weight of the ten cover crops was significantly influenced by Zn level, cover crop treatments and Zn × cover crops interaction (Table 2). The significant interaction between Zn × cover crops indicates variation in dry weight of shoots of cover crops with the variation in soil Zn rates. At the 0 mg Zn·kg−1 soil rate, shoot dry weight varied from 0.38 g·plant−1 produced by calopo to 7.95 g·plant−1 produced by jack bean, with an average of 2.67 g·plant−1. At 10 mg Zn·kg−1 level, shoot dry weight varied from 0.83 to 9.27 g·plant−1, with an average value of 4.01 g·plant−1. At 20 mg·kg−1 Zn level, dry weight of shoots varied from 0.79 to 9.98 g·plant−1, with an average value of 3.99 g·plant−1. At the maximum Zn level (40 mg·kg−1), shoot dry weight varied from 0.70 to 9.31 g·plant−1 with an average value of 9.31 g·plant−1. However shoot dry weight of all the cover crops de-creased at this level of Zn application. Across all four Zn levels, minimum dry weight of 0.73 g·plant−1 was produced by pueraria and maximum dry weight of 9.13 g·plant−1 was produced by jack bean, with an average value of 3.45 g·plant−1. Significant variation in shoot dry weight among cover crops has been reported by Fage-ria et al.[22]. Low fertility is a major constraint for good growth of legume cover crops in tropical plantation crops [22]. Similarly, Baligar and Fageria [16] reported that growth of cover crops is determined genetically and is affected by environmental variables including fertilizers.
Table 2.Influence of soil Zn on shoot dry weight (g·plant−1) of ten tropical legume cover crops.
Cover crops
Zinc levels (mg·kg−1)
Average
0 10 20 40
1. Sunn hemp 3.01c 3.38d 2.54d 2.75c 2.92d
2. Smooth crotalaria 0.66de 1.07ef 1.13ef 0.70e 0.89fg
3. Showy crotalaria 1.08de 1.24ef 1.23ef 0.96de 1.13f
4. Calopo 0.38e 0.83f 0.79f 0.94de 0.74g
5. Pueraria 0.57de 0.78f 0.83f 0.74e 0.73g
6. Pigeonpea 1.18d 1.60e 2.04de 2.03c 1.71e
7. Lablab 3.46c 7.73b 7.96b 5.69b 6.21b
8. Black velvet bean 5.35b 6.49c 7.55b 6.61b 6.50b
9. Gray velvet bean 3.03c 7.67b 5.83c 1.85cd 4.59c
10. Jack bean 7.95a 9.27a 9.98a 9.31a 9.13a
Average 2.67c 4.01a 3.99a 3.16b 3.45
F-Test
Zn levels (Zn) **
Cover crops (C) **
Zn × C **
CV Zn (%) 9.53
CV C (%) 8.30
**
Significant at the 1% probability level. Means followed by the same letter in the same column are not statistically significant at the 5% probability level by Tukeys test. Average values were compared in the same line.
Table 3.Relationship between Zn rate and shoot dry weight (SDW) of ten tropical legume cover crops.
Variable Regression equation R2 ZnRMTDW1
1. Zn rate vs SDW of Sunn hemp Y = 3.16 − 0.020X + 0.00022X2 0.16NS -
2. Zn rate vs SDW of smooth crotalaria Y = 0.67 + 0.048X − 0.0012X2 0.86** 20
3. Zn rate vs SDW of showy crotalaria Y = 1.09 + 0.019X − 0.00056X2 0.80** 16
4. Zn rate vs SDW of calopo Y = 0.43 + 0.033X − 0.00051X2 0.73** 32
5. Zn rate vs SDW of pueraria Y = 0.58 + 0.023X − 0.00047X2 0.66** 24
6. Zn rate vs SDW of pigonpea Y = 1.16 + 0.061X − 0.00097X2 0.74** 31
7. Zn rate vs SDW of lablab Y = 3.71 + 0.429X − 0.0095X2 0.91** 23
8. Zn rate vs SDW of black velvet bean Y = 5.27 + 0.179X − 0.0036X2 0.81** 25
9. Zn rate vs SDW of gray velvet bean Y = 3.55 + 0.379X − 0.0106X2 0.83** 18
10. Zn rate vs SDW of jack bean Y = 7.94 + 0.169X − 0.0034X2 0.83** 25
Average of 10 cover crops Y = 2.75 + 0.132X − 0.0031X2 0.90** 22
**,NS
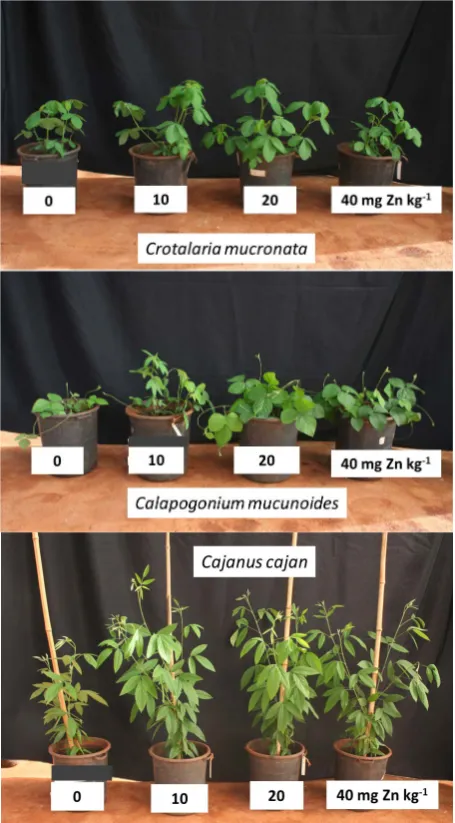
[image:4.595.91.538.498.709.2]soils. However, liming may induce Zn deficiency due to adsorption of this element on soil colloids by increasing soil pH [23]. Alloway [2] reported that Zn deficiency is by far the most ubiquitous micronutrient deficiency problem in the world. All crops can be affected by Zn deficiency but there is variation in Zn deficiency in crop species and genotypes within species [2]. Figure 1 shows growth of shoots of cover crops at different Zn levels. There was improvement in shoot growth with the addition of Zn and differences were evident among the cover crop species tested.
3.2. Root Growth
[image:5.595.185.413.279.691.2]Root dry weight was significantly affected by Zn level, cover crop treatment and Zn × cover crop interaction (Table 4). The Zn × cover crop interaction indicates that there was variation in root dry weight among cover crops species with the variation in Zn levels. The root dry weight at the lowest Zn level (0 mg Zn·kg−1) varied from 0.03 to 0.84 g·plant−1, with an average value of 0.22 g·plant−1. At 10 mg Zn·kg−1 level, root dry weight va-ried from 0.05 to 1.05 g·plant−1, with an average value of 0.36 g·plant−1. Similarly, at 20 mg Zn·kg−1 level, root dry weight varied from 0.03 to 0.93 g·plant−1, with an average value of 0.29 g·plant−1. At the highest Zn level (40 mg Zn·kg−1), root dry weight varied from 0.03 to 0.80 g·plant−1, with an average value of 0.26 g·plant−1.
Figure 1. Growth of selected cover crops at different soil Zn
Table 4. Influence of soil Zn on root dry weight (g·plant−1) of ten tropical legume cover crops.
Cover crops
Zinc levels (mg·kg−1)
Average
0 10 20 40
1. Sunn hemp 0.06c 0.22de 0.04d 0.15c 0.12d
2. Smooth crotalaria 0.03c 0.05e 0.07d 0.03c 0.05d
3. Showy crotalaria 0.03c 0.08e 0.03d 0.08c 0.06d
4. Calopo 0.05c 0.09e 0.03d 0.05c 0.06d
5. Pueraria 0.04c 0.07e 0.06d 0.03c 0.05d
6. Pigeonpea 0.03c 0.14e 0.08d 0.07c 0.08d
7. Lablab 0.36b 0.63bc 0.58bc 0.54b 0.53b
8. Black velvet bean 0.84a 1.05a 0.93a 0.80a 0.90a
9. Gray velvet bean 0.41b 0.82ab 0.70b 0.43b 0.59b
10. Jack bean 0.36b 0.45cd 0.40c 0.42b 0.41c
Average 0.22c 0.36a 0.29b 0.26bc
F-Test
Zn levels (Zn) **
Cover crops (C) **
Zn × C **
CV Zn (%) 26.83
CV C (%) 25.95
**Significant at the 1% probability level. Means followed by the same letter in the same column are not statistically significant at the 5% probability
level by Tukeys test. Average values were compared in the same line.
Across all four Zn levels, root dry weight varied from 0.05 to 0.90 g·plant−1, with an average value of 0.41 g·plant−1. Black velvet bean produced the highest root dry weight at all four Zn levels. The root weight in di-verse crop species is genetically controlled as well as influenced by environmental factors, especially by mineral nutrition [24]. Variation in root weight of cover crop species has been widely reported by Fageria [14] and Fa-geria and Moreira [25].
The increase in root dry weight was quadratic when Zn was applied in the range of 0 to 40 mg·kg−1 (Table 5). Among the ten cover crop species, root dry weights of only four (smooth crotalaria, pueraria, lablab and gray velvet bean) increased significantly with increasing soil Zn levels. The rate of soil Zn for maximum root dry weight of these crops was 20 mg Zn·kg−1 for smooth crotalaria, 18 mg Zn·kg−1 for pueraria, 24 mg Zn·kg−1 for lablab and 20 mg Zn·kg−1 for velvet bean. The average Zn level for maximum root dry weight of the ten cover crops was 22 mg Zn·kg−1. Hence, it can be concluded that Zn requirements varied among the cover crop species. Fageria [24] and Fageria and Moreira [25] reported that root weight of crop plants increased in a quadratic fa-shion with the increasing levels of added Zn.
Table 5. Relationship between soil Zn rate and root dry weight (RDW) of ten legume cover crops.
Cover crops Regression equation R2 ZnRMRDW1
Zn rate vs RDW of smooth crotalaria Y = 0.028 + 0.0037X − 0.000091X2 0.80** 20
Zn rate vs RDW of pueraria Y = 0.039 + 0.0029X − 0.000080X2 0.60* 18
Zn rate vs RDW of lablab Y = 0.387 + 0.0213X − 0.00044X2 0.50* 24
Zn rate vs RDW of gray velvet bean Y = 0.453 + 0.0140X − 0.00087X2 0.73** 20
Average of 10 cover crops Y = 0.240 + 0.0087X − 0.00021X2 0.46* 22
*,**
Significant at the 5 and 1% probability levels, respectively. 1ZnRMRDW = Zn rate for maximum root dry weight in mg·kg−1 soil.
Table 6.Influence of soil Zn on maximum root length (MRL, cm·plant−1) of ten tropical legume cover crops.
Cover crops
Zinc levels (mg·kg−1)
Average
0 10 20 40
1. Sunn hemp 11.33c 14.67e 11.33b 8.66d 11.50d
2. Smooth crotalaria 10.00c 13.00e 9.00b 7.00d 9.75d
3. Showy crotalaria 13.00c 12.66e 8.66b 7.00d 10.33d
4. Calopo 12.66c 21.00d 9.00b 8.33d 12.75d
5. Pueraria 8.33c 13.66e 15.33b 9.66d 11.75d
6. Pigeonpea 10.00c 12.66e 12.66b 8.00d 10.83d
7. Lablab 21.33b 30.66bc 34.00a 29.66ab 28.91b
8. Black velvet bean 34.33a 36.66ab 34.33a 31.00a 34.08a
9. Gray velvet bean 26.33b 39.33a 33.66a 20.66c 30.00b
10. Jack bean 21.66b 25.66cd 26.33a 24.33bc 24.50c
Average 16.90c 22.00a 19.43b 15.43c
F-Test
Zn levels (Zn) **
Cover crops (C) **
Zn × C **
CV Zn (%) 14.84
CV C (%) 12.53
**Significant at the 1% probability level. Means followed by the same letter in the same column are not statistically significant at the 5% probability
[image:7.595.89.540.577.711.2]level by Tukeys test. Average values were compared in the same line.
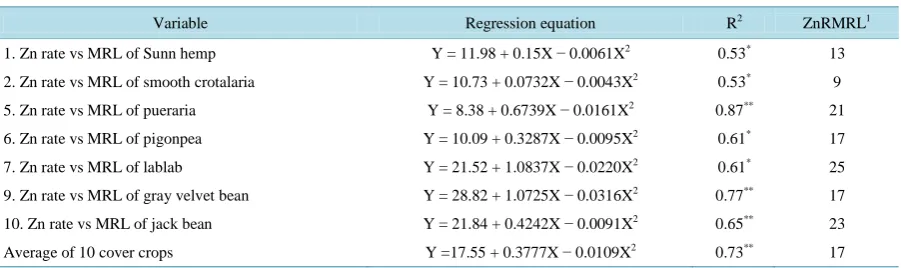
Table 7.Influence of soil Zn on maximum root length (MRL, cm·plant−1) of ten tropical legume cover crops.
Variable Regression equation R2 ZnRMRL1
1. Zn rate vs MRL of Sunn hemp Y = 11.98 + 0.15X − 0.0061X2 0.53* 13
2. Zn rate vs MRL of smooth crotalaria Y = 10.73 + 0.0732X − 0.0043X2 0.53* 9
5. Zn rate vs MRL of pueraria Y = 8.38 + 0.6739X − 0.0161X2 0.87** 21
6. Zn rate vs MRL of pigonpea Y = 10.09 + 0.3287X − 0.0095X2 0.61* 17
7. Zn rate vs MRL of lablab Y = 21.52 + 1.0837X − 0.0220X2 0.61* 25
9. Zn rate vs MRL of gray velvet bean Y = 28.82 + 1.0725X − 0.0316X2 0.77** 17
10. Zn rate vs MRL of jack bean Y = 21.84 + 0.4242X − 0.0091X2 0.65** 23
Average of 10 cover crops Y =17.55 + 0.3777X − 0.0109X2 0.73** 17
**, NS
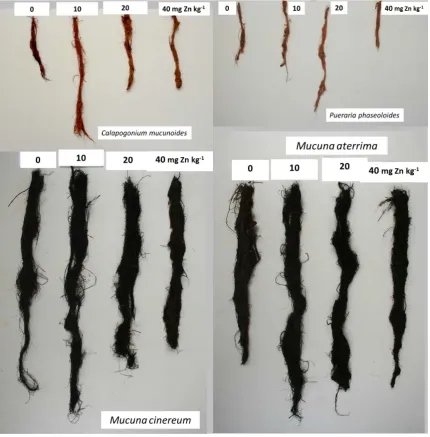
root length have been reported in crop plants with the addition of Zn in Brazilian Oxisol [14] [26]. Wang et al.
[27] also reported that root growth is extremely sensitive to wide range of soil physical, chemical and biological factors, including mineral nutrition. Figure 2 shows root growth of cover crop species at different Zn levels. There were differences in root growth among cover crop species and also differences with the addition of dif-ferent levels of Zn fertilizer.
3.3. Zinc Concentration, Uptake and Use Efficiency
[image:8.595.100.531.271.709.2]Zn concentration (content per unit dry matter), Zn uptake (concentration × dry matter) and Zn use efficiency (dry weight per unit of Zn uptake) were significantly influenced by Zn level and cover crop (Tables 8-10). Overall, Zn concentration increased in a quadratic manner with the addition of Zn to the soil from 0 to 40 mg·kg−1 (Y = 18.23 + 6.14X − 0.09X2, R2 = 0.98**). The Zn concentrations in the cover crop shoots at various soil applied Zn levels were comparable to Zn concentrations reported for other legumes [28]. The Zn concentra-tion of smooth crotalaria was always higher than the others and was two times higher than the average at the 40 mg·kg−1 level.
Table 8.Influence of soil Zn on Zn concentration (mg·kg−1) in the shoots of ten cover crops.
Cover crops
Zinc levels (mg·kg−1)
Average
0 10 20 40
1. Sunn hemp 15.86ab 110.54b 118.08b 160.04b 101.13b
2.Smooth crotalaria 18.52a 139.51a 199.01a 234.53a 147.89a
3. Showy crotalaria 15.88ab 136.74ab 176.24a 215.34a 136.05a
4. Calopo 18.19a 58.85cd 60.62e 65.12e 50.69e
5. Pueraria 14.62ab 75.82c 91.44bcd 115.65c 74.38c
6. Pigeonpea 18.27a 64.97cd 98.84bc 87.18cde 67.32cd
7. Lablab 18.35a 59.35cd 60.80de 63.25e 50.44e
8. Black velvet bean 15.07ab 51.33cde 77.80cde 75.12de 54.83e
9. Gray velvet bean 15.06ab 42.48de 73.03cde 109.57cd 60.03de
10. Jack bean 11.05b 24.56e 48.87e 58.91e 35.84f
Average 16.08d 76.42c 100.47b 118.47a 77.86
F-Test
Zn levels (Zn) **
Cover crops (C) **
Zn × C **
CV Zn (%) 14.58
CV C (%) 11.74
**
Significant at the 1% probability level. Means followed by the same letter in the same column are not statistically significant at the 5% probability level by Tukeys test. Average values were compared in the same line.
Table 9. Influence of soil Zn on Zn uptake (mg·kg−1) in the shoots of ten cover crops.
Cover crops
Zinc levels (mg·kg−1)
Average
0 10 20 40
1. Sunn hemp 47.88c 372.84a 300.13bc 443.61ab 291.12bc
2.Smooth crotalaria 12.37d 149.09cd 225.20cd 165.10cd 137.94d
3. Showy crotalaria 17.30d 170.21cd 217.85cd 206.84c 153.05d
4. Calopo 7.10d 49.07d 48.07d 61.49d 41.43e
5. Pueraria 8.32d 59.25d 77.29d 86.74cd 57.90e
6. Pigeonpea 21.74d 103.80cd 201.91cd 175.34cd 125.69d
7. Lablab 63.56bc 461.01a 485.60ab 360.68b 342.71ab
8. Black velvet bean 78.89ab 330.04ab 590.82a 497.18a 374.23a
9. Gray velvet bean 45.80c 325.91ab 422.32ab 201.33c 248.84c
10. Jack bean 87.74a 229.45bc 487.63ab 546.13a 337.73ab
Average 39.07c 225.06b 305.68a 274.44a 211.06
F-Test
Zn levels (Zn) **
Cover crops (C) **
Zn × C **
CV Zn (%) 25.84
CV C (%) 21.84
**
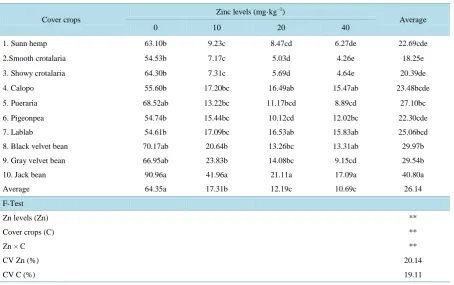
Table 10.Influence of soil Zn on Zn use efficiency (mg·µg−1) in the shoots of ten cover crops.
Cover crops
Zinc levels (mg·kg−1)
Average
0 10 20 40
1. Sunn hemp 63.10b 9.23c 8.47cd 6.27de 22.69cde
2.Smooth crotalaria 54.53b 7.17c 5.03d 4.26e 18.25e
3. Showy crotalaria 64.30b 7.31c 5.69d 4.64e 20.39de
4. Calopo 55.60b 17.20bc 16.49ab 15.47ab 23.48bcde
5. Pueraria 68.52ab 13.22bc 11.17bcd 8.89cd 27.10bc
6. Pigeonpea 54.74b 15.44bc 10.12cd 12.02bc 22.30cde
7. Lablab 54.61b 17.09bc 16.53ab 15.83ab 25.06bcd
8. Black velvet bean 70.17ab 20.64b 13.26bc 13.31ab 29.97b
9. Gray velvet bean 66.95ab 23.83b 14.08bc 9.15cd 29.54b
10. Jack bean 90.96a 41.96a 21.11a 17.09a 40.80a
Average 64.35a 17.31b 12.19c 10.69c 26.14
F-Test
Zn levels (Zn) **
Cover crops (C) **
Zn × C **
CV Zn (%) 20.14
CV C (%) 19.11
**
Significant at the 1% probability level. Means followed by the same letter in the same column are not statistically significant at the 5% probability level by Tukeys test. Average values were compared in the same line.
The average Zn uptake across four Zn levels varied from 41.43 µg·plant−1 to 374 µg·plant−1, with an average of 211 µg·plant−1 (Table 9). Overall, Zn uptake varied from 39.07 µg·plant−1 at the lowest Zn level to 305.68 µg·plant−1 at the 20 mg Zn·kg−1 soil. The uptake of Zn was quadratic and decreased at the highest Zn level (Y = 50.89 + 28.57X − 0.051X2, R2 = 0.98**). The cover crop species showed differential uptake characteristics at given levels of soil Zn. Interspecific variation in Zn uptake has been reported for other legume crops [1] [18].
Zinc use efficiency varied from 18.25 to 40.80 mg·µg−1, with an average value of 26.14 mg·µg−1 across the four Zn levels (Table 10). The Zn use efficiency decreased with increasing soil Zn levels in a quadratic fashion (Y = 58.58 − 4.36X + 0.08X2, R2 = 0.92**). The decrease in nutrient use efficiency with increasing soil nutrient levels is widely reported in the literature [12] [24]. The decrease in nutrient use efficiency at higher nutrient le-vels may be related to saturation of the plant’s capacity for nutrient uptake [12] [14] [15]. Cover crops that have high Zn use efficiency might produce more yield when grown on Zn deficient soils. In the current study Jack bean, black velvet bean, pueraria and gray velvet bean had high Zn use efficiency at low and no application of Zn. Interspecific variation in nutrient use efficiency among tropical crops has been reported [16] [18] [19].
4. Conclusion
bean, and gray velvet bean had high Zn use efficiency at low soil Zn level and hence these cover crops might be suitable cover crops for soils with low available Zn.
Acknowledgements
We thank L. F. Stone for his excellent review and suggestions on the manuscript.
References
[1] Fageria, N.K., Baligar, V.C. and Clark, R.B. (2002) Micronutrients in Crop Production. Advances in Agronomy, 77, 185-268. http://dx.doi.org/10.1016/S0065-2113(02)77015-6
[2] Alloway, B.J. (2008) Micronutrients and Crop Production: An Introduction. In: Alloway, B.J., Ed., Micronutrient
De-ficiencies in Global Crop Production, Springer, New York, 1-39. http://dx.doi.org/10.1007/978-1-4020-6860-7_1
[3] Graham, R.D. (2008) Micronutrient Deficiencies in Crops and Their Global Significance. In: Alloway, B.J., Ed., Mi-cronutrient Deficiencies in Global Crop Production, Springer, New York, 41-61.
http://dx.doi.org/10.1007/978-1-4020-6860-7_2
[4] Fageria, N.K. and Stone, L.F. (2008) Micronutrient Deficiency Problems in South America. In: Alloway, B.J., Ed., Micronutrient Deficiencies in Global Crop Production, Springer, New York, 245-266.
http://dx.doi.org/10.1007/978-1-4020-6860-7_10
[5] Singh, M.V. (2008) Micronutrient Deficiencies in Crop and Soils in India. In: Alloway, B.J., Ed., Micronutrient
Defi-ciencies in Global Crop Production, Springer, New York, 93-125. http://dx.doi.org/10.1007/978-1-4020-6860-7_4
[6] Zou, C., Gao, X., Shi, R., Fan, X. and Zhang, F. (2008) Micronutrient Deficiencies in Crop Production in China. In: Alloway, B.J., Ed., Micronutrient Deficiencies in Global Crop Production, Springer, New York, 127-148.
http://dx.doi.org/10.1007/978-1-4020-6860-7_5
[7] Cakmak, I. (2008) Zinc Deficiency in Wheat in Turkey. In: Alloway, B.J., Ed., Micronutrient Deficiencies in Global
Crop Production, Springer, New York, 181-200. http://dx.doi.org/10.1007/978-1-4020-6860-7_7
[8] Sinclair, A.H. and Edwards, A.C. (2008) Micronutrient Deficiency Problems in Agricultural Crops in Europe. In: Al-loway, B.J., Ed., Micronutrient Deficiencies in Global Crop Production, Springer, New York, 225-244.
http://dx.doi.org/10.1007/978-1-4020-6860-7_9
[9] Brown, P.H. (2008) Micronutrient Use in Agriculture in the United States of America: Current Practices, Trends and Constraints. In: Alloway, B.J., Ed., Micronutrient Deficiencies in Global Crop Production, Springer, New York, 267- 286. http://dx.doi.org/10.1007/978-1-4020-6860-7_11
[10] Waals, J.H.V. and Laker, M.C. (2008) Micronutrient Deficiencies in Crops in Africa with Emphasis on Southern Afri-ca. In: Alloway, B.J., Ed., Micronutrient Deficiencies in Global Crop Production, Springer, New York, 201-224.
http://dx.doi.org/10.1007/978-1-4020-6860-7_8
[11] Fageria, N.K. and Baligar, V.C. (2008) Ameliorating Soil Acidity of Tropical Oxisols by Liming for Sustainable Crop Production. Advances in Agronomy, 99, 345-399. http://dx.doi.org/10.1016/S0065-2113(08)00407-0
[12] Fageria, N.K., Baligar, V.C. and Jones, C.A. (2011) Growth and Mineral Nutrition of Field Crops. 3rd Edition, CRC Press, Boca Raton.
[13] Fageria, N.K. and Baligar, V.C. (1997) Response of Common Bean, Upland Rice, Corn, Wheat, and Soybean to Soil Fertility of an Oxisol. Journal of Plant Nutrition, 20, 1279-1289. http://dx.doi.org/10.1080/01904169709365335
[14] Fageria, N.K. (2009) The Use of Nutrients in Crop Plants. CRC Press, Boca Raton.
[15] Fageria, N.K., Baligar, V.C. and Li, Y.C. (2008) The Role of Nutrient Efficient Plants in Improving Crop Yields in the Twenty First Century. Journal of Plant Nutrition, 31, 1121-1157. http://dx.doi.org/10.1080/01904160802116068
[16] Baligar, V.C. and Fageria, N.K. (2007) Agronomy and Physiology of Tropical Cover Crops. Journal of Plant Nutrition,
30, 1287-1339. http://dx.doi.org/10.1080/01904160701554997
[17] Fageria, N.K., Baligar, V.C. and Bailey, B.A. (2005) Role of Cover Crops in Improving Soil and Row Crop Productiv-ity. Communications in Soil and Plant Analysis, 36, 2733-2757. http://dx.doi.org/10.1080/00103620500303939
[18] Baligar, V.C., Fageria, N.K., Paiva, A.Q., Silveira, A., Pomella, A.W.V. and Machado, R.C.R. (2006) Light Intensity Effects on Growth and Micronutrient Uptake by Tropical Legume Cover Crops. Journal of Plant Nutrition, 29, 1959- 1974. http://dx.doi.org/10.1080/01904160600927633
[20] EMBRAPA (Empresa Brasileira de Pesquisa Agropecuária) (1997) Manual de Métodos de Análise de Solo (Manual for Methods of Soil Analysis). Centro Nacional de Pesquisa de Solos, Rio de Janeiro.
www.agencia.cnptia.embrapa.br/Repositorio/Manual+de+Metodos
[21] Da Silva, F.C. (1999) Manual de Analyses Químicas de Solos, Plantas e Fertilizantes (Manual for Chemical Analysis of Soils, Plants and Fertilizers). EMBRAPA Informação Tecnológica, Brasilia.
[22] Fageria, N.K., Baligar, V.C. and Li, Y.C. (2009) Differential Soil Acidity Tolerance of Tropical Legume Cover Crops.
Communications in Soil Science and Plant Analysis, 40, 1148-1160. http://dx.doi.org/10.1080/00103620902754127
[23] Lindsay, W.L. (1979) Chemical Equilibrium in Soils. John Wiley & Sons, New York.
[24] Fageria, N.K. (2013) The Role of Plant Roots in Crop Production. CRC Press, Boca Raton.
[25] Fageria, N.K. and Moreira, A. (2011) The Role of Mineral Nutrition on Root Growth of Crop Plants. Advances in
Agronomy, 110, 251-331. http://dx.doi.org/10.1016/B978-0-12-385531-2.00004-9
[26] Fageria, N.K. (2002) Micronutrients Influence on Root Growth of Upland Rice, Common Bean, Corn, Wheat, and Soybean. Journal of Plant Nutrition, 25, 613-622. http://dx.doi.org/10.1081/PLN-120003385
[27] Wang, H., Inukai, Y. and Yamauchi, A. (2006) Root Development and Nutrient Uptake. Critical Reviews in Plant
Sciences, 25, 279-301. http://dx.doi.org/10.1080/07352680600709917