Munich Personal RePEc Archive
Modelling the pension system in an
overlapping-generations general
equilibrium modelling framework
Verbic, Miroslav
Institute for Economic Research Ljubljana
March 2007
Online at
https://mpra.ub.uni-muenchen.de/10350/
Abstract
This article presents a theoretical contribution to the field of overlapping-generations general equilibrium modelling, i.e. an upgrade of this branch of models with a pension system. Within the pension block we model both the first pension pillar, financed on a pay-as-you-go basis, and the fully-funded second pillar of the Slovenian pension system. The modelling of the first pension pillar is based on cash flows of the mandatory pension insurance institution, the relationship between the pension base and the pension, and the process of harmonising pension growth to wage growth. The modelling of the second pillar centres on implementation of the liquidity constraint. Use was made of supplementary pension profiles, and the ratio between premia paid and pensions paid out from supplementary pension insurance. The category of total pension was also introduced, and the model ensured that at every point households adjusted the scope of labour supply and their current consumption towards the target total pension.
Key Words: first pension pillar, general equilibrium models, liquidity constraint, MCP, overlapping generations, PAYG, pension system, second pension pillar
1. INTRODUCTION
Effectively monitoring the consequences of economic policy on social development demands an appropriate tool; one that is capable of reflecting the complex consequences of the impact of overall and individual social and tax policy measures for households and the national budget. Overlapping-generations general equilibrium models (OLG-GE) currently represent the most advanced form of numerical general equilibrium models, for which reason we find them suitable for this task. The case at hand involves a dynamic model of a national economy including overlapping generations of various households, distinguished according to size of household and income level, which maximise the total utility over the lifespan, assuming perfect foresight. This kind of model facilitates the monitoring and forecasting of complex short-term and long-term consequences of demographic changes – (continued) aging of the population being key among them – on individual categories of public finance, as well as the impact of changes in the tax system and social security system on the flexibility, competitiveness and thus growth of the economy.
The advantages that overlapping-generations equilibrium models offer in comparison to other modelling tools, such as actuarial models of pension reforms and generational accounting models, are not to be searched for directly in the modelling of specific socio-economic phenomena such as demographic slowdown of GDP, but first and foremost in the key characteristics of general equilibrium modelling, which are closer to the functioning of the actual economy, making the results of the model more realistic and reliable. Of course, this entails modelling mutual interactions and feedback effects between macro-economic aggregates that simpler models are not able to capture. This is seen in the analysis of the pension system, where a link must be established between labour endowment and labour price; unfavourable demographic changes will lead to a reduction in the active working population and hence the labour endowment, which will lead to an increase in labour price (wage) above steady state growth. Since pension dynamics depends on the dynamics of wages, this also means higher pension expenditure. It can be seen that modelling relationships of this kind is vital for ensuring a realistic and accurate analysis produced using a model of this kind.
The contribution of this article to overlapping-generations general equilibrium modelling relates to modelling the pension system within a dynamic general equilibrium framework,
both the mandatory pay-as-you-go (PAYG) financed component, as well as the fully-funded (FF) supplementary component of pension insurance. Studying the modelling of the pension system should be addressed primarily within the context of implementing the transition from a pay-as-you-go financed system to a fully-funded system, and other ongoing changes in pension legislation that are becoming increasing prominent in Slovenia. The second chapter thus explains the developments in the Slovenian pension system from the 1990s onwards. The third chapter provides a brief description of the SIOLG 2.0 dynamic general equilibrium model of the Slovenian economy, which will serve as the basis for modelling the pension system. The fourth chapter covers the modelling of the first pillar of the pension block, considering the mandatory pension insurance institution, the relationship between the pension base and the pension and addressing the relationship between premia paid and pensions paid out from supplementary insurance, which will finally enable us to model supplementary pension insurance within the pension block of our model (fifth chapter). The sixth chapter concludes the article with the key findings.
2. REPRESENTATION OF DEVELOPMENTS IN THE SLOVENIAN PENSION SYSTEM
The Republic of Slovenia inherited the legislation of its pension system, which was based on inter-generational contract and is therefore a pay-as-you-go (PAYG) system, from the former Yugoslavia. After Yugoslavia splintered into newly independent countries at the beginning of the 1990s, transformation from the workers’ self-management to a modern market economy was initiated in Slovenia, thus requiring the formation of new markets and taking its rules into account. However, the consequences of bankruptcy of firms, economic recession and restructuring of the business sector, all resulting from economic transformation, were being “solved” contemporaneously in order to preserve social sustainability by mass early retirement.
retirement age. The ratio between the number of insured persons and the number of pensioners has been relatively steady over the last decade (Stanovnik 2002), although this stability is somewhat misleading for the new pension legislation introduced additional categories of insured persons1.
Legislative modifications adopted in 1992 are partially responsible also for the large increase of pension expenditure of the PAYG-financed state pension fund, i.e. the Institute for Pension and Disability Insurance (IPDI), in the same year. Namely, with the new Pension and Disability Insurance Act the IPDI was compelled to pay contributions for health insurance for pensioners, hence contributing at least one additional percentage point to the ratio of pension expenditure to GDP. After 1992 the pension expenditure, measured as percentage of GDP, somewhat stabilized at the level of 11 per cent. This could have been a sign of financial stabilization of the IPDI; however things took a drastic turn for the worse, as we will find out hereinafter. Until 1996 all extensive increases of pension expenditure were financed by increasing the pension contribution rate. As a result the (joint employer and employee) pension contribution rate ascended from 22.55 per cent of the gross wage in 1989 to 31 per cent of the gross wage in 1995. Finally, in 1996 the Government of the Republic of Slovenia decided to lower the employer pension contribution rate from 15.5 per cent of the gross wage to 8.85 per cent of the gross wage in order to increase competitiveness of the Slovenian economy.
The year 1996 hence represent a decisive moment, since until then financially autonomous state pension fund demonstrated a deficit for the first time, which has after that been filled up every year until 2004 with the so-called “generalized” transfers from the central budget in order to maintain social stability. Transfers of funds from the central government budget to the IPDI indeed existed prior to 1996, but were only intended for financing additional obligations of the government, such as pensions of farmers, policemen, customs officers and combatants of the World War II. Now the government actually committed itself to partially finance pensions, which were primarily established on actuarial principles and were before 1996 entirely funded with contributions of the active population. Until the economic transformation relatively favourable pension figures become insupportable in just a few years. One should certainly adjoin that the effects of demographic changes on the social security system are yet to be observed in the subsequent years.
The decrease of employer pension contributions was thus a “suitable” occasion for the extreme measure of transfer funding of the pension system. The insolvency of the pension system therefore passed by unnoticed to the general public, but the consequences of the pension deficit can be seen in the structure of the Slovenian budget, where there are fewer funds available for investments and for research and development. Yet the economic situation is commonly not perceived to be so pessimistic. The fiscal position was relatively favourable for the whole time and certainly the most promising among the new EU member states; the budget deficit was relatively low in the last decade despite the difficult situation in the first years of economic transition, hence the public debt increased only moderately.
The problem, which has by that time drawn attention of economists of the International Monetary Fund and the World Bank, was being properly addressed with the preparation of the White Paper on the subject in 1997, which led to the adoption of new PDIA in 1999. The implementation of this law started on 1 January 2000 and is to be finished in 2024. The pension system has become more complex than ever before; partially due to difficult negotiations in the government coalition, but mainly because of tiresome negotiations between management and labour (Stanovnik 2002). The main characteristic of the new pension legislation in comparison with the former legislation is path-dependency, which appears to be a universal feature of predominantly gradualistic reforms of the Slovenian economic system. In addition, the transitional periods are lengthy, so the actual values of parameters of the present three-pillar pension system in Slovenia converge only gradually to the final values.
There is more consideration given in the 1999 PDIA to actuarial fairness for the system of incentives and disincentives was adopted in case of retirement before and after fulfilment of retirement eligibility criteria, respectively. Namely, for all insured persons without full pension qualifying period, retired before completed 63 (men) and 61 years of service (women), the pension adequately decreases for every month missing until the statutory retirement age. If, on the contrary, the insured pension remains employed after completed statutory retirement age and full pension qualifying period, the pension adequately increases for every month, completed after the statutory retirement age. Incentives and disincentives are to be added or substracted 1.5 percentage points of accrual rate for every year of service added or missing, respectively.
The calculation of pensions is less favourable for insured persons under the 1999 PDIA. Old-age pension is calculated from the pension base in per cent, depending on number of completed years of service; 35 per cent in case of men and 38 per cent in case of women for the first 15 years of service, and 1.5 per cent for each additional year of service irrespective of gender. Under the proviso that the insured person is not subjected to pension disincentives, the pension in case of full pension qualifying period amounts to 72.5 per cent of pension base, instead of prior 85 per cent (1992 PDIA). Since the pension base under the 1999 PDIA is calculated out of best 18 consecutive years of service instead of prior best 10 consecutive years of service (1992 PDIA), the decrease in pensions is even higher. However, the most complex procedures of the 1999 pension legislation are revalorization of pension bases and indexation of pensions (cf. Stanovnik 2004). Revalorization of the pension base in the Slovenian pension system is a procedure of recalculating sources of pensionable income in the best 18 consecutive years of service using a vector of revalorization coefficients, in order to obtain the pension base. It is actually an instrument in the pension system, used for obtaining horizontal equity between existing and new pensioners. Indexation of the pension, on the other hand, is a procedure of adjusting retirement benefits to existent economic developments in the country using a complex set of rules, where consumer price index is the floor and wage index is the ceiling for the growth rate of pensions.
It has to be emphasized that in 2005 the Government of the Republic of Slovenia introduced several changes to the 1999 PDIA that were aimed at increasing the pensions (in real terms). The most important among then was the introduction of full indexation of pensions that is being carried out twice a year (in February and in November). Additionally, the changes of
pension legislation include increases in the level of pensioner’s recreation grant and lowering eligibility requirements of the widower’s pension. These provisions, especially the introduction of full indexation of pensions, will undoubtedly have substantial negative long-term effects on controlling the expenditure of the system of public finances.
The 1999 PDIA introduced a number of elements that improved horizontal equity in the system (cf. Stanovnik 2002). The gender divide regarding eligibility and benefits was considerably narrowed. Not only were accrual rates equalized, but the eligibility criteria for women are now closer to those for men. Nonetheless, even greater emphasis was laid on the principle of vertical equity or “solidarity”. Thus the ratio between two comparable pensions2 can not exceed 4:1, which is less than the prior ratio of 4.8:1 (1992 PDIA). Instead of explicit minimum and maximum pension, the Slovenian pension system includes minimum and maximum pension base; the former is set nominally, yet amounted to approximately 62.5 per cent of average net wage in 2000, while the latter is four times the minimum pension base. A further redistributive element lies in the fact that social security contributions are not capped.
Another very important innovation of the 1999 pension legislation is the adjustment of pension growth of the existing pensioners to entry pensions of new pensioners, which amounts approximately to –0.6 percentage points per annum. This means that pensions of existing pensioners are being decreased, taking account of the lower pensions of new entrants. There was an initiative given to the Institutional Court of the Republic of Slovenia for constitutional review of this article, but the Court ruled in December 2003 that the article is congruent with the Constitution of the Republic of Slovenia. Such outcome is particularly important, since this modification of the pension legislation represent a large share of overall effects of the pension reform and has also a significant positive effect on managing expenditure of the pension system.
agreed rate, or based on the profit the fund manager generates from investments. There is a minimum return requirement for pension funds, requiring them to provide at least 40% of the average annual interest rate on long-term government bonds.
Insured persons participating in voluntary supplementary pension insurance can claim tax relief, if the pension scheme is on the approved list at the Ministry of Labour, Family and Social Affairs. According to the Act, value added tax is not paid on premia, and they are also exempt of 6.5% of insurance service tax. The tax relief on a premium paid by an insured person works by reducing the personal income tax base by the amount the insured person paid for voluntary supplementary pension insurance. However, the reduction of the personal income tax base is limited. The premium an employer pays for an insured person is not counted in that person’s income tax base. The pension is included in the income tax base in the year in which the beneficiary receives payment of the pension, while premium paid by the employer is recognised for tax relief on corporate income tax, but they do not count as wages paid nor are contributions paid on them. Experience to date with collective schemes indicates that employers finance most of the premium or even the entire premium.
The pension scheme manager is eligible for reimbursement of input costs from premia paid, output costs and to an annual management commission. The input costs are calculated as a percentage of the paid premium, and reduce the paid premium. The output costs are calculated as a percentage of the surrender value, and reduce the surrender value. The commission for managing an active fund is defined as a percentage of the average net annual value of mutual fund assets and reduces the fund’s actual return. The Minister of Finance prescribes the maximum permitted percentages for these costs; at present these stand at 5.5% for input costs; output costs at 1%, and the management commission at 1.5%. Administrative costs are high therefore, though the trend is for them to fall.
The second pillar of the Slovenian pension system has undoubtedly undergone considerable growth, as in mid-2006 over half the active working population was already included in voluntary pension insurance. However, most of these insured persons were involved via collective insurance, while the individual pension saving segment is marginal. Civil servants represent a significant proportion, though they pay the minimum premium. On 1 November 2005 439,280 insured persons were included in supplementary pension insurance, but 167,363 of them were civil servants with a minimum pension insurance premium. Overall, the key
worrying indicator of progress in supplementary pension insurance in Slovenia is the value of paid premia. As this analysis indicates, there is a large gap between the actually paid premium for supplementary pension insurance and the target premium value that would enable compensation of effects of the pension reform on the welfare of the elderly. Below the article will present the consequences this problem may present in future.
3. THE OLG-GE MODEL OF THE SLOVENIAN ECONOMY
The model SIOLG 2.0 is a dynamic overlapping-generations general equilibrium model of the Slovenian economy, based on social accounting matrix (SAM) for the year 2000, data on demographic structure of the population, expected future demographic developments, characteristics of Slovenian households, and the breakdown of households into generations (cf. Verbič 2007). The model has been developed with the very intention of analysing the sustainability of the Slovenian public finances, though it can be used to analyse any part or any sector of the economy.
The starting points of the OLG-GE model are the life cycle theory of consumption by Modigliani and Brumberg (1954) and the permanent income hypothesis by Friedman (1957), which are actually special cases of the more general theory of intertemporal allocation of consumption (Deaton 1992). Unlike in the Keynes’s theory of behaviour of consumption and savings, based only on current income, in the OLG-GE model consumption and savings are derived from intertemporal optimization behaviour and are therefore dependent on full lifetime income. In the simplest case of unchanged income until retirement (cf. Modigliani 1986), consumers save during their active lifetime and spend their savings after the retirement in order to maintain unchanged consumption. The retirement is therefore the raison d’etre for saving.
OLG-GE models especially valuable for analysis of tax policies, pension policies and other social policies.
Dynamic general equilibrium model SIOLG 2.0 comprises not only the standard model structure of a national economy, but also the demographic block and the pension block, within the framework of which the first and the second pillar of the Slovenian pension system are being modelled. Since the model incorporates most of the contemporary techniques of the CGE modelling, the extent to which this field in Slovenia lagged behind the rest of the world has practically been eliminated. Namely, the model is built within the general algebraic modelling system (GAMS), which has become both most widely used programming language and most widespread computer software (Brooke et al. 1998) for construction and solving large and complex CGE models.
Within the GAMS framework, the dynamic general equilibrium model is written in Mathiesen’s (1985) formulation of the Arrow-Debreu (1954) equilibrium model, i.e. as a mixed-complementarity problem (MCP). The key advantage of this formulation is the compact presentation of the general equilibrium problem, which is achieved by treating variables implicitly and thus significantly reducing the computation time for higher-dimensional models. Namely, the mathematical program includes equalities as well as inequalities, where the complementarity slackness holds between system variables and system conditions (cf. Rutherford 1995a; Böhringer et al. 2003). Functions of the model are written in Rutherford’s (1995) calibrated share form; a reasonably straightforward algebraic transformation, which nevertheless considerably simplifies the calibration of the model (cf. Böhringer et al. 2003; Balistreri and Hillberry 2003). To solve the model, i.e. to achieve convergence, a recent version of the PATH solver (Ferris and Munson 2000) is used, which is renowned for its computational efficiency.
Consumers live in the model according to their expected length of life, i.e. their life expectancy at birth. Assuming that the life expectancy is approximately 80 years and that the active lifetime period starts at the age of 20, there are 60 generations in each period of the model. There is a new cohort of consumers born in each such period, thus increasing the population, while at the same time a number of consumers die and decrease the total population. Consumers are observed in five-year intervals within households, which maximize the expected lifetime utility subject to their income constraints, where one has to
put out the need to save for retirement and to support children. Households are differentiated in the model according to year of birth, income and size; within each cohort distinction is made between couple without children and nuclear family with two children on average, and five income profiles representing different income brackets. Consequently, there are ten versions of the model altogether, which facilitates analysis of intra-generational effects of different economic policies.
The volume of labour and the labour productivity growth are given exogenously. Changes in wages are reflected in changes of the labour supply. Consumption of households with children is additionally corrected due to extra cost per child, where the children are born in the childbearing age of the woman or, to be precise, the household, i.e. in the age bracket of 20-40 years. In the first ten years after retirement the household comprises two adults, and then one adult. Saving decisions of households affect investment decisions of firms in the capital markets and thus future production. The effects ascribed herein have recurrent effects on product market through decreasing prices and on labour market through higher productivity, leading to higher wages and finally higher income of households. Both effects can be analysed with a dynamic OLG-GE model quite straightforwardly.
On the other hand, the assumption of perfect foresight is also valid for firms, which maximize profits within an environment of perfect competition. Technology is given by the constant elasticity of substitution (CES) production function. The number of production sectors in the model is dependent on availability of the input-output table for the base year, which means that there are 60 sectors of the standard classification of activities (SCA) available for discretionary aggregation. Government spending depends on economic growth and growth of the population, and is financed with revenues from personal income tax, capital income tax, value-added tax and import duties. The sources of revenue for the Slovenian system of public finances represent various possibilities of funding different economic policies in the simulation phase of the modelling.
The dynamic general equilibrium model SIOLG 2.0 is closed using the Armington’s (1969) assumption of imperfect substitutability, where the commodities are separated by its source on domestic and imported products. Demand for imported products is derived from cost minimization criterion of firms and utility maximization criterion of consumers. As regards the export side of the model, domestically produced products are sold at home and abroad, but are nevertheless treated as imperfect substitutes. Slovenia is assumed to be a small open economy, implying that the changes in the volumes of imports and exports do not affect the terms of trade. International capital flows are endogenous, given the intertemporal balance of payments constraint.
4. MODELLING THE FIRST PENSION PILLAR
Activities within the basic pension system in the Republic of Slovenia can be divided into at least two parts: (1) activities that occur before the pension accrual when the insured person reaches retirement age, ar, and are actually linked to the accrual process, and (2) activities that
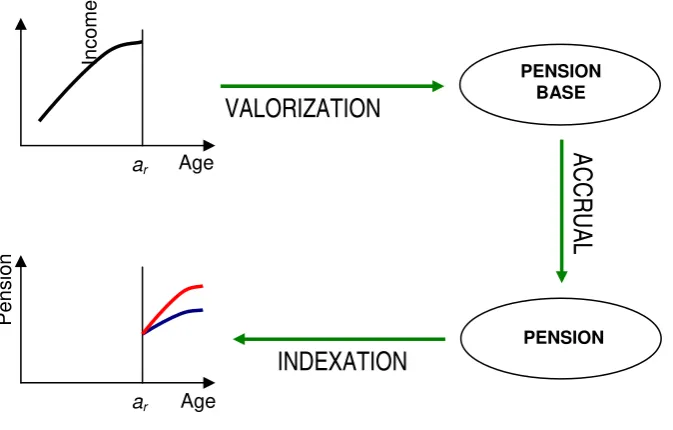
occur after pension accrual that are linked to changes in the pension value over time. In order to present the otherwise complex mandatory pension system in Slovenia in a more understandable manner, the first part of the mandatory pension insurance activities are further broken down into the valuation of the pension base and pension accrual. This makes three phases of pension activity: (1) valuation of pension base; (2) pension accrual, and (3) harmonising pension with selected national economic indicators (indexation). The first two phases take place simultaneously, while the third phase follows. The mandatory pension insurance system is thus described in Figure 1.
FIGURE 1: Functioning of the first pension pillar in Slovenia
Age
VALORIZATION
ACCRUAL
PENSION
Pensio
n
Age ar
ar
INDEXATION
PENSION BASE
Inc
o
me
Below we describe the structure of the first pillar of the Slovenian pension system as modelled in the SIOLG 2.0 dynamic general equilibrium model of the Slovenian economy. The modelling can roughly be divided into: (1) revenues of the Institute for Pension and Disability Insurance and total pension expenditure, (3) (minimum) pension bases and pensions of households of an individual generation, and (3) pension indexation (harmonising pension growth with growth of wages).
The Mandatory Pension Insurance Institution
In Slovenia the mandatory pension insurance institution is known as the Institute of Pension and Disability Insurance (IPDI). Since the article deals with five-year intervals, one can de facto discuss mandatory pension institution revenues and expenditure at a five-year level in this model. They are modelled in the form of the income of IPDI on one hand, and total pensions expenditure on the other.
The income of the IPDI, incIPDI,t, primarily comprise mandatory pension contributions
(contribution rate ) and where required general government transfers, while alternatively mandatory pension insurance may also be financed with revenues from tax on labour income (via replacement contribution rate
rent l t
,
rent l t
τ , applied to the gross labour cost
(
)
), tax on capital income (with replacement tax rate, , , , , ,
1+tl pel t g hyl t g h
r
rate τVAT t, ). This gives the following expression with optional components to match the model scenarios:
(
)
(
)
(
)
(
)
(
(
)
)
, , , , , , , , , 0, , , , , , , , , , , , , , , , , , , , , , , 1 (1 ) 1 1 1 1 kl rent rentl l t l el t g h l t g h h g
r va t s s
r r t t s
s r t r r
VAT s c t g h
a t s VAT t
c t g h VAT
IPDI t
t g h h
s a t s VAT s VAT
s
t
inc t t p y
p t
p R y
p t p t p t c p y t σ τ τ τ τ τ β ⎡ + + ⎤+ ⎣ ⎦ ⎡ ⎛ + ⎞ ⎤ ⎢ ⎥ + ⎜⎜ ⎟⎟ + + + ⎢ ⎝ ⎠ ⎥ ⎣ ⎦ + + + + + = ⎛ ⎜ ⎟ ⎜ ⎟ ⎝ ⎠
∑∑
∑
⎞(
,)
, , , 0, , ,
, , , ,
,0
1
1 ,
cc
s h g
VAT s
VAT t A t s s G t G t t t f
s A t s VA
I T s VAT
I t
PD t
p g y p p q p
p t σ τ τ ζ ⎧ ⎡ ⎤⎫ ⎪ ⎢ ⎥ +⎪ ⎨ ⎢ ⎥⎬ ⎪ ⎢⎣ ⎥⎦⎪ ⎩ ⎭ ⎛ + ⎞ + ⎜⎜ ⎟⎟+ + + ⎝ ⎠
∑
∑∑
∑
(1)where qt is the reference steady state quantity, pt the reference steady state price, ct g h, , the
benchmark private consumption, yc,t,g,h the level of private consumption, pc,t,g,h the price of
private consumption, βh,s the share of sector s goods in material consumption, yt,s the level of
domestic production, pA,t,s the price of Armington goods, pva,t,s price of value added, yl,t,g,h the
labour supply, pel,t,g,h the price of leisure (reservation or net wage), R0,s benchmark capital
services, pr,t the price of capital services, g0 benchmark government consumption, yG,t level
of government consumption, pG,t price of government consumption, pf price of foreign
currency (exchange rate), ζIPDI,0 benchmark government transfers to the IPDI, σcc
substitution elasticity between consumption components, and σkl substitution elasticity between labour and capital.
The total pension expenditure of IPDI equals t g h, ,
h g
aggpens
∑∑
, where the aggregatedpension, aggpenst,g,h, paid to household h of generation g, is expressed as follows:
(
)
#, , 1 , , , , ,
aret rh
t g h B B t g g h g h t g h
aggpens =⎡⎣μ + −μ μ ν θ ⎤⎦pens , (2)
whereμB is the benchmark scenario multiplier (where it equals 1, otherwise it is 0), aret, t g
μ is the multiplier for time periods in which generation g is retired, νg hrh, is the number of retired households, θg h#, the number of adults in a household and is the pension of each retired household h of generation g in time period t.
, ,
t g h rent
The Pension Base and the Pension
Individual pensions, penst,g,h, are expressed in the benchmark scenario as:
, , , ,
t g h B t g h
pens =μ pens , (3)
while their calculation in counterfactual scenarios is expressed separately for persons already retired in the first period:
(
)
(
)
5 12 ord( [ ]), , 1 , , , 0, 1
g alive rent mm
t g h B t g h t g g h
pens = −μ μ ξι α pb +γ − − (4)
and for persons not yet retired:
(
)
, , 1 , , , ,
wh rent mm t g h B t g h t g g g h
pens = −μ μ ξι α pb , (5)
where penst g h, , is the benchmark pension, the multiplier for households already existing in the first model period, the multiplier for households that live fully within the model horizon, ξ correction factor for the calculation of pensions, required due to the differences between the model calculations of pensions and the IPDI procedures,
, ,
alive t g h
μ
, ,
wh t g h
μ
,
rent t g
ι the pension index for calculating pension of generation g, αg the accrual rate for calculating the
For persons already retired in the first model period, there are no income profiles available to calculate their pensions in this period, which demanded an alternative solution. Expression (4) therefore relates to the pension base:
(
)
5 12 ord(0, [ ])(
)
60 5ord0, [ ]1 1
mm mm
h h
g g
pb pb
γ
γ − = + −
+ ,
where ar = 60 is the model retirement age in the base year, we are dealing with five-year age
intervals, and ord(g) is a mathematical operation that assigns a numerical value to the elements of set g, i.e. to the years of birth of individual generations.
Pursuant to the new pension law in 1999, the pension base is calculated on the basis of the best consecutive 18 years of income from employment (gross wage). For the purposes of this OLG-GE model these are assumed to be the last 18 years. Since the dynamic model SIOLG 2.0 is based on five-year intervals, an approximation of the pension base is arrived at using the best 17.5 years instead of 18 years of wages.
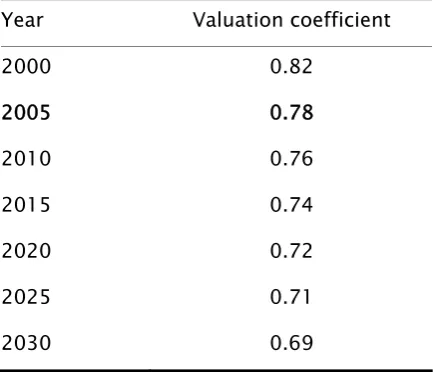
Wages for the period t are not valued using a wage index for the period, but with the pension index also used by Wiese (2004). The pension index was the same as the wage index until 1990, but from then it started to be adjusted according to a rather intransparent system described in detail in Verbič (2007: 200-203). The valuation process subsequently had a significant negative impact on replacement rate, as pension indexation was lagging behind wage growth from 1991 to 2005. Table 1 indicates the correction of the pension base by the valuation coefficient, as planned by the 1999 pension legislation (Official Gazette of the Republic of Slovenia, No 106/99). The valuation coefficient for 2005 is just 0.777, which basically means that a person who has been earning the average wage throughout his or her career and retires in 2006, will have a pension base for calculation of the pension reaching to 77.7% of the average wage.
TABLE 1: Value of the valuation coefficient in real terms at 2.5% steady state growth
Year Valuation coefficient
2000 0.82
2005 0.78
2010 0.76
2015 0.74
2020 0.72
2025 0.71
2030 0.69
Note: Valuation coefficients are calculated such that at 2.5% steady state growth and 80% indexation of pensions to wages they ensure the horizontal equality of pensioners retiring (under equal entry conditions) under the old Pension Act (OGRS, No 12/92) and the new Pension Act (OGRS, No 106/99).
Source: Pension and Disability Insurance Act (OGRS, No 106/99); own model simulations and calculations.
In terms of calculating the pension base, one can speak of a covert “valuation tax,” which reduces the individual’s pensionable income for calculation of the pension base (Wiese 2004: 32, 36-47). The shock that economic policy caused to the pension system in 1991, when pensions were not indexed to wage growth, was transferred by the 1999 pension reform into the system of calculation the valuation coefficients, which made the method of calculating the pension base, and hence also pensions, very intransparent. In this model the valuation coefficient remains unchanged after 2030, as it is assumed that a continued fall would lead to unacceptably low pensions1.
Based on stochastic simulations, Wiese (2004) indicated in the case of pension indexation that was valid before the change in the method of harmonising pensions in 2005 (Official Gazette of the Republic of Slovenia, No 72/05), that the pensions index was lagging behind the wage index by 0.5% in over 80% of replications. It can be assumed that between 2000 and 2005, the pension index was equal to the wage index, reduced by 0.5%. The change in the pension legislation in 2005 (Official Gazette of the Republic of Slovenia, No 72/05) limited the value of the valuation coefficient at 0.777, as specifically indicated in Table 1. Another option is the
1
use of wage indexation in simulations, where the wage index is multiplied by the exogenous factor KWI. This can be changed appropriately, thus adjusting the calculation of pensions.
Modelling the pension base is carried out in several parts which are brought together in expression (5). This is required because the system for defining pensions (valuation, accrual, and indexation), which is given in Figure 1, is complex and specific to each generation. It is therefore not possible to model the procedures of the pension definition with sufficient degree of realism and consistency in a generation-independent way, as is possible in some less complex pension systems, such as the Swiss system (cf. Müller et al. 2003). To this end, the article first defines the pension index for pension calculation, then calculates the pension base, and finally corrects the calculated pension base by taking into account the minimum and maximum pension base. The next section indicates the modelling of harmonising pensions with wages.
The pension index for calculation of the pension of generation g, ιt grent, , is given by the following expression:
, ,
,
aret t g t rent
t g ret v g v v
vtax vtax
μ ι
μ =
∑
, (6)where aret, t g
μ is the multiplier for the generation that is already retired in year t, ret, t g
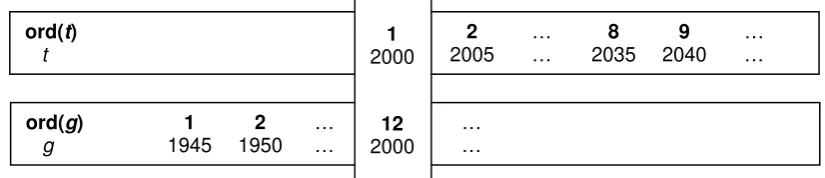
μ is the multiplier for the generation retiring in year t and vtaxt the valuation tax. Figure 2 indicates
the generation-specific definition of pensions mentioned above, which is expressed in the pensions index via the valuation tax. The curve arising from the origin represents the pension profile of the generation retiring in the five-year period ending in 2000. The value of the valuation tax equals one at the starting point, and then changes according to the recursive formula that will be defined in expression (16). The generation retiring in the next period, ending 2005, has a different pension profile as indicated by the second curve. This is achieved by transforming the first curve for using the expression vtaxt / vtax2005. The new
profile is acquired by setting the original pension profile to 1 at the moment of the transition (t = 2005), and applying a recursive definition of the valuation tax, where the original profile continues along its original path.
2005
t≥
The pension base for calculating the pension of generation g (without correction for minimal pension base), pbg h, , is calculated separately for generations born within the model horizon (newborn generations): ( , , ) ( , ) , , , , , , , , , ,
0 map 1
1
t g h t g
t g h t el t g h l t g h g h rh
t
g h t t
l pb
vtax p y pb
p q
π ν
⎡ ⎤
> ∧ ⎣ ⎦=
⎛ ⎞
= ⎜⎜
℘
⎝ ⎠
∑
⎟⎟ (7)and for generations already in existence in the model in the first time period (existing generations):
(
)
( [ ])( ,0, ) ( ,0 )
5 12 ord , , , , ,0, , ,0 ,
,
0 map 1
1 1
t h t
g t el t g h l t h t h g h rh
t
g h t t
l pb
vtax p y pb p q π γ ν − − ⎡ ⎤
> ∧ ⎣ ⎦=
⎛ ⎞
= + ⎜⎜ ⎟⎟
℘
⎝ ⎠
∑
, (8)where lt g h, , is the baseline work profile, map
(
pbt g,)
a mathematical operation that assigns the past 20 years for calculation of the pension base, πt g h, , baseline productivity profile,pel,t,g,h reservation wage (net labour cost), and ℘ the pension base divisor, including the
[image:20.595.112.355.551.726.2]calibration correction. The pension base divisor in our model with five-year time and age intervals has on principle the value of 3.5, which assumes that the full service period is 17.5 and not 18 years.
Slovenia’s pension system does not have an explicit value for the minimum and maximum pension, but has a minimum ( min
t
pb ) and maximum pension base ( max t
pb ), which (in the model) may be based on the average net or average gross wage wt:
, 4 , min min t t max min t t pb w pb pb ϑ =
= (9)
where the factor ϑmin equalled 39.4% in 2000 for gross wage or 62.5% for net wage (Majcen et al. 2005a: 142). The minimum ( ) and maximum pension ( ) for period t are given by expressions:
,
min t g
pens penst gmax,
,
, ,
,
4 ,
min min t g t t g max min t g t g pens pb , pens pens
α =
= (10)
while the actual pension for generation g, penst g, , based on the minimum pension in the base year, pensming , is given by this expression:
(
)
, max , min 4 ,
min min
t g g g t g
pens = ⎡⎣pens pens pens, ⎤⎦. (11)
However, this version of the OLG-GE model uses a max-min formulation for determining the actual pension directly in the pension base calculation. The pension base for calculating the pension of generation g with a correction for minimum and maximum pension base, mm,
g h pb , is arrived at using the expression:
(
)
, max , min 4 ,
mm min min
g h g g g h
pb = ⎡⎣pb pb pb , ⎤⎦, (12)
while the minimum pension base of generation g, pbgmin, is given by the expression:
(
)
[ ] [ ]
ord ord 4
min min min
g t
t t g
pb ι pb
= −
=
∑
, (13)where min t
ι is the pensions index for calculating the minimum pension (pension base), and
min
pb is the minimum pension base in 2000 (the base year).
The constraint on the product of the pensions index for calculating the minimum pension (pension base) and the minimum pension base in the base year in expression (13),
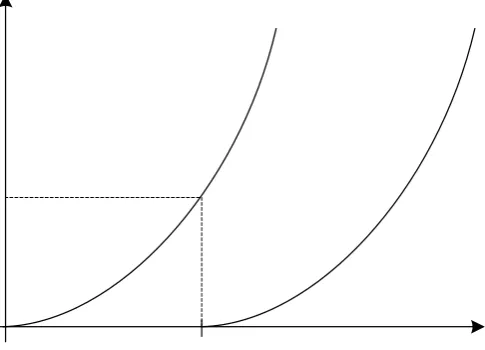
, is required because the model includes a discrepancy between the set of generations g and the set of time periods t, where ord(t) and ord(g) are mathematical operations that assign numerical values to the elements of sets t and g. Namely, the time period set has 2000 (base year) as the first element, while the generation set has 1945 (base year reduced by the number of annual generations in the model) as the first element. It must be recalled that the model deals with five-year time periods, which are constructed such that the first time period covers years 1996 to 2000, and the first generation covers years 1941 to 1945. Figure 3 presents the background mechanism for the constraint on the product of the pension index.
( )
( )
ord t =ord g −4
[image:22.595.80.493.438.527.2]
FIGURE 3: Time periods and generations in a dynamic general equilibrium framework
ord(t) 1 2 … 8 9 …
t 2000 2005 … 2035 2040 …
ord(g) 1 2 … 12 …
g 1945 1950 … 2000 … 1
2000
12
2000
Take as an example, the 12th generation, which for the purposes of the model was born in the first time period2 (1996-2000). This generation will retire without pension deductions in the ninth time period (2036-2040), while its pension will be calculated based on the service years, which will conclude in the eighth time period (2031-2035). This explains the gap between the generation and the time period in the constraint on the product of the pension index presented by expression (13).
2
Adjustment of Pensions with Respect to Wages
As stated above, there is a choice between the approach used by Wiese (2004) and arbitrary wage indexation in the approximation of the pension index. Instead of using the wage index and pension index, the model therefore only uses the wages index, either corrected by 0.5% or multiplied by an exogenous factor. An existing pension is additionally corrected with a value of –0.65% until 2025 due to the adjustment of pensions between existing and new pensioners, which is described in detail by Verbič (2007: 112-122). The approach used by Wiese (2004: 37), which applies in the case of harmonising pensions that was valid before the 2005 change of the pension legislation (Official Gazette of the Republic of Slovenia, No 72/05), provides the following pensions index:
1 2 1 2
0, 005, 1;
0, 005 0, 0065, 1 2025,
v v t v v w v t w w v t w ι − − − − ⎧ − ∀ = + ⎪⎪ = ⎨
⎪ − − ∀ < + <
⎪⎩
(14)
while the arbitrary wage indexation that applies independently of the currently valid pension indexation percentages gives the following index:
1 , 2 1 , 2 , 1
0, 0065, 1 2025,
v WI t v t v WI t v w
K v t
w w
K v t
w ι − − − − ⎧ ∀ = + ⎪⎪ = ⎨
⎪ − ∀ < + <
⎪⎩
;
(15)
where KWI is the (arbitrary) coefficient of the wage indexation. Approach (15) was employed
in this article. Adjustment of pensions between existing and new pensioners is implemented in order to equal the pension levels between former insured persons that have already retired and insured persons retiring now. Without the adjustment the latter group would have a smaller pension due to the falling value of the accrual rate and the valuation coefficient. The pensions of existing pensioners are therefore adjusted downwards. The minimum pension is also adjusted by the pension index and is decreasing relatively over time.
In our general equilibrium model, the modelling of this part of the pension system has also been simplified slightly, which is reflected in adjustment of pensions between existing and new pensioners being absent. The growth in the valuation tax is given in the expression below, which de facto presents a recursive definition of the valuation tax:
, 1 1
, ,
1 (1 )(1 ) l t 1
t
WI t
t l t
p vtax
r
vtax γ p
+
+ = +⎡⎢ + + − ⎤
⎢ ⎥
⎣ ⎦⎥K , (16)
while the pension index to calculate the minimum (pension base), ιtmin, is given by the following expression (cf. Weise 2004: 47-48):
,
, ,0
1 l t 1
min t t l t p q K p p
ι = +⎛⎜⎜ − ⎞⎟⎟
⎝ ⎠ WI t, (17)
where the products , 1
,
(1 )(1 ) l t
l t p r
p
γ +
+ + in expression (16) and ,
,0 l t t l t p q p
p in expression (17) match
the wage growth illustrated in expression (15). In addition to productivity growth, (1 )t
t
q = +γ , a correction due to the use of discounted prices is also introduced, pt = +(1 r)−t.
5. MODELLING THE SECOND PENSION PILLAR
not permit us to distinguish between policyholders in terms of whether their insurance is mandatory or not.
In order to model the second pillar of the Slovenian pension system within this OLG-GE model, the supplementary pension insurance profiles must first be designed, which is set out in the next section. The subsequent analysis addresses the relationship between the premium paid and the pension paid out from supplementary pension insurance. The key elements used in similar models around the world to capture the second pillar are then assessed to determine their suitability and feasibility in this model. One of the possible methods will finally be selected on the basis of available resources, and implemented for the pension block in this OLG-GE model.
The Supplementary Pension Insurance Profiles
The consistent disaggregated data that would be required for any in-depth analysis of the pension system’s second pillar, except some partial attempts to collect and analyse them (Stanovnik 2004a; Slapar 2005;Majcen et al. 2006), do not exist to date; therefore it first had to be acquired and processed appropriately. This involves: (1) microdata from the Statistical Office of the Republic of Slovenia (SORS), which were already used to analyse the long-term sustainability of the first pension pillar and the significance of the second and third pillar (Majcen et al. 2006), and (2) data from the Insurance Supervision Agency (ISA) model’s database, which was already used to produce the projections of revenues and income of voluntary collective pension insurance (Slapar 2005). The SORS microdata supports detailed analysis of individual supplementary pension insurance from the policyholder level to the most aggregated forms, while data from the ISA model database supports the analysis of collective supplementary pension insurance from the pension institution level up to the most aggregated forms. Below the article sets out the profiles for supplementary pension insurance in Slovenia, while the procedure for their formulation has already been described in detail in Verbič (2007: 214-221).
In order to formulate a single supplementary pension insurance profile for the Republic of Slovenia, the individual and collective supplementary pension insurance profiles had to be combined. This was not a simple task, as there are some policyholders included in both forms of pension schemes, i.e. they appear twice. However, this issue was not specifically addressed
in the analysis, because of the low number of such cases (cf. Verbič 2007: 218). The supplementary pension insurance premium was calculated as the weighted average of the individual supplementary pension insurance premium and the collective supplementary pension insurance premium, where the number of policyholders in both pension scheme types was used for weighting.
The age structure of the average annual supplementary pension insurance premia in 2004 is given in Figure 4. It can be noted that the supplementary pension insurance premium profile follows the collective supplementary pension insurance premium profile quite closely, though its level is slightly lower. Only the 60-64 and 65-69 age brackets exhibit a higher volatility in the individual supplementary pension insurance premium, which causes the supplementary pension insurance premium profile to move slightly above the profile of the collective supplementary pension insurance premium. The age structure of the number of supplementary pension insurance policyholders in 2004 is given in Figure 5. It can be established that the collective supplementary pension insurance policyholders represents the majority of the policyholders. The problem of the small number of observations in some age brackets (20-24 and 60-69) of course remains, so the calculated premia for supplementary pension insurance in those age brackets have to be considered with some caution.
FIGURE 4: Average annual supplementary pension insurance premium in 2004
0 50000 100000 150000 200000 250000 300000 350000
20 22 24 26 28 30 32 34 36 38 40 42 44 46 48 50 52 54 56 58 60 62 64 66 68
Age
A
m
o
u
n
t in
SIT
Individual insurance premium
Collective insurance premium
Weighted average premium
Source: SORS Microdata (2006) and ISA Model Database (2005); own calculations.
FIGURE 5: Number of insured persons of supplementary pension insurance in 2004
0 2000 4000 6000 8000 10000 12000 14000 16000 18000 20000
20 22 24 26 28 30 32 34 36 38 40 42 44 46 48 50 52 54 56 58 60 62 64 66 68
Age
Number of insured persons
Individual insurance Collective insurance
Individual and collective insurance
Source: SORS Microdata (2006) and ISA Model Database (2005); own calculations.
[image:27.595.85.467.461.668.2]Furthermore, in modelling the second pillar of the Slovenian pension system, the profile of the average employee in terms of their participation in supplementary pension insurance will be of greater interest to this article than the profile of the average supplementary pension insurance policyholder in the Republic of Slovenia. For this reason, the age structure of supplementary pension insurance policyholders is replaced by the age structure of employees to acquire the actual average annual premium in 2004, which is represented by five-year age brackets in Figure 6.
FIGURE 6: Average annual supplementary pension insurance premium in 2004, taking into account insured persons only and all employees
0 20000 40000 60000 80000 100000 120000 140000 160000
20-24 25-29 30-34 35-39 40-44 45-49 50-54 55-59 60-64 Age
A
m
oun
t i
n S
IT
Actual premia (insured persons)
Actual premia (all employees)
Source: SORS Microdata (2006) and ISA Model Database (2005); own calculations.
The Premium and the Supplementary Pension
The link between the premium paid and the pension paid out from supplementary pension insurance is of key significance to the analysis of supplementary pension insurance. Primarily of interest is the level of pension that would be paid out from supplementary pension insurance, based on the premia actually paid in Slovenia, determined for 2004 by the construction of supplementary pension insurance profiles. To this end, a modelling tool based on the contribution by Majcen et al. (2006) was used. The International Labour Organisation (ILO) family of models was used as the framework for calculation and simulation of macroeconomic categories, and simulation of the current pension legislation, while use is also made in tandem of the intergenerational accounting model and the annuity calculation based on assumptions on the required amount of supplementary pension saving (cf. Verbič 2007: 221-226).
[image:29.595.87.481.513.724.2]The annual value of the pension from supplementary pension insurance that an individual would receive in the first full year after retirement is calculated first on the basis of the actual average supplementary pension insurance premium paid by policyholders only, and then for all employees in 2004, as illustrated in Figure 6. The results, broken down into five-year age brackets, are given in Figures 7 and 8, based on the assumption of two different retirement ages.
FIGURE 7: Supplementary pension at retirement based on paid supplementary pension insurance premia for insured persons in 2004
0 100000 200000 300000 400000 500000 600000 700000
20-24 25-29 30-34 35-39 40-44 45-49 50-54 55-59 60-64 Age
Amoun
t in SIT
Actual pension given retirement age of 60 years
Actual pension given retirement age of 65 years
Source: Own model simulations based on the model of Majcen et al. (2006); own calculations on the basis of SORS Microdata (2006) and ISA Model Database (2005).
It can be seen that a policyholder’s pension (Figure 7), calculated for the first year after retirement decreases quite sharply with age. The given assumptions anticipate this, as older policyholders have fewer years left to save until their retirement, which means less accumulated funds for calculating the pension annuity. Assuming the retirement age of 65 years, an individual has five more years available for saving that with an assumed retirement age of 60, so the supplementary pension curve is higher for the first version that the supplementary pension curve in the second version, though with increasing age the two curves converge. The convergence can be seen between the curves themselves and in the tendency of both curves toward a null pension. The only break in the fall of pensions with age occurs in the 25-29 age bracket, where – as seen in Figure 4 – there was a growth in the actual average supplementary pension insurance premium compared to the preceding five-year age bracket.
FIGURE 8: Supplementary pension at retirement based on paid supplementary pension insurance premia for all employees in 2004
0 20000 40000 60000 80000 100000 120000 140000 160000 180000 200000
20-24 25-29 30-34 35-39 40-44 45-49 50-54 55-59 60-64 Age
A
m
ount
i
n SI
T
Actual pension given retirement age of 60 years
Actual pension given retirement age of 65 years
Source: Own model simulations based on the model of Majcen et al. (2006); own calculations on the basis of SORS Microdata (2006) and ISA Model Database (2005).
the pension calculated on the basis of actually paid premia first rises, peaking between the ages of 30 and 35, before decreasing. As may be seen from comparison of Figures 7 and 8, the characteristic trends arising from different retirement ages are retained.
The Liquidity Constraint and Supplementary Pension Savings
A review of overlapping-generations general equilibrium modelling (Verbič 2007: 22-55) indicates that the field is so new and complex that to date only a handful of more or less successful attempts to model the second pension pillar have been made. At present we are aware of three such attempts, which are listed herein by descending complexity of the pension block within the OLG-GE framework, but also ascending relevance in terms of the institutional characteristics of the Slovenian pension system (cf. Verbič 2007: 227-235). These are the model of the Danish economy by Knudsen et al. (1998), the model of the Dutch economy by Draper et al. (2005), and the model of the Lithuanian (Lassila 1999) and Finnish economies (Alho et al. 2006).
Based on the review of existing modelling of supplementary pension insurance in models of this kind, and the resources available, it was decided to introduce a liquidity constraint to the SIOLG 2.0 model. This approach is similar to that employed in Lassila's (1999) model of the Lithuanian economy. To this end, the category of total pension was introduced, comprising the pension from the first pension pillar and the pension from the second pension pillar, while saving in the third pillar of pension insurance remains residual and is not explicitly modelled. The functioning of the pension system, as modelled in the model SIOLG 2.0, is illustrated in Figure 9.
FIGURE 9: Modelling mandatory and supplementary pension insurance
Every household decides on the use of its labour endowment as either labour or leisure. It earns a net wage based on the labour time, on which labour tax is then being paid. The net wage and the amount of labour tax, roughly speaking, comprise the gross wage, from which social contributions are being paid, including contributions for mandatory pension insurance. The pension from the first pension pillar is being calculated on the basis of gross wage. On the other hand, households also save within the second pension pillar, in accordance with the supplementary pension insurance profiles. This (largely) involves supplementary pension insurance within the voluntary second pillar of the pension system. The actuarial calculation of the second pillar pension is made on the basis of premia paid. The sum of the pension from the first and second pillars of the pension insurance therefore represents the total pension.
On the other hand, households can also decide on the total pension they will receive after retirement. To this end, they adjust the ratio between their labour and leisure time in order to meet their objectives throughout their active working life (or the remainder thereof). If a household after retirement wants a pension higher than the reference pension, it has to increase its activity by increasing labour time at the expense of leisure time, given the fixed labour endowment, ωt,g,h = 1. On the other hand, the household may also reduce its
decision-making is therefore constrained and their decisions are potentially less optimal, while the welfare level is lower. However, the liquidity constraint also changes the macro-economic results, which can lead to some interesting overall effects.
The value of the liquidity constraint, liqconsg,h, is a shadow price that defines the portion of
net wage allocated to saving within the second pillar of the pension system. The actual form of the liquidity constraint depends on the counterfactual scenario relating to the second pension pillar (cf. Verbič 2007: 236, 244-246). The liquidity constraint, which only models the existing second pension pillar and allows full effects of the pension reform, is relatively simple:
(
)
# , , , , , , , , , , , , rhg h g h aret ret
g h t g f g v g v g h
t v
el t g h t g h g l t g h
t t
liqcons p spillar pens
p y p ν θ μ μ π , , , ⎡ ⎤ = ⎢ ⎥ ⎛ ⎞ ⎣ ⎦
ℑ ⎜ ⎟
⎝ ⎠
∑
∑
∑
, (18)
while the liquidity constraint, which in the reference scenario keeps saving in the second pillar of the pension system at the existing level, but in the counterfactual scenario (partially) compensates for the pension reform, has the following form:
(
)
(
)
(
)
# , , , , , , , , , , , , # , , , , , , , , , , , , , ,1 sp g hrh g h aret ret
g h t g f g v g v g h
t v
el t g h t g h g l t g h
t t
sp rh
g
g h g h aret ret
t
t g f v g v g h t g v
g el t g h
t g h g l t g h
t t
liqcons p spillar pens
p y
p
p pens pens
p y
p
μ ν θ
μ μ
π
μ ν θ α
μ ι μ
α π − , , , , ⎡ ⎤ = ⎢ ⎥+ ⎛ ⎞ ⎣ ⎦
ℑ ⎜ ⎟
⎝ ⎠
+ −
⎛ ⎞
ℑ ⎜ ⎟
⎝ ⎠
∑
∑
∑
∑
∑
%,h , t ⎡ ⎛ ⎞⎤ ⎢ ⎜⎜ ⎟⎟⎥ ⎢ ⎝ ⎠⎥ ⎣ ⎦
∑
(19)where μsp is the multiplier for counterfactual scenarios with an active second pillar, ℑg is the ratio of interest-bearing supplementary pension insurance savings to non-interest-bearing savings, θg h#, the number of adults in a household, νg hrh, is the number of retired households, yl,t,g,h labour supply, πt g h, , reference labour productivity profile, pel,t,g,h net labour cost, pt
reference steady state price, pf price of foreign currency, ,
aret t g
μ multiplier for generation already retired in year t, ret,
t g
μ the multiplier for generation retiring in year t, penst g h, , pension
of each retired household, αg actual accrual rate for calculating the pension of generation g,
g
α target accrual rate for calculating the pension of generation g, ι%t generation-independent
pension indexation factor, and spillarg the pension from supplementary pension insurance as a proportion of the pension from mandatory pension insurance in the reference scenario.
In order to achieve various objectives of the analysis, the parameters of liquidity constraint (19) are varied within the framework of given counterfactual scenarios. The key supplementary pension insurance parameters to be adjusted are (1) the target accrual rate for pension calculation, αg, i.e. the target proportion of the total pension in the pension base, and
(2) the multiplier for the generation retiring in a given year, μt gret, , i.e. the period to which the target proportion of the total pension relates.
Now, let us consider the liquidity constraint (19) in greater detail. The first part of the liquidity constraint relates to the reference scenario, which models saving in the second pillar of the pension system at the existing level. Reference saving in the second pillar is expressed as a proportion of the first pillar pension in the first year following retirement. The latter has the form
(
v gret, v g h, , where the multiplierv
pens
μ
∑
,)
,ret v g
μ has only one non-zero element for the
retirement year, therefore just presented sum also contains only one non-zero element. The age structure of the pension from the second pension pillar, calculated on the basis of premia paid by all employees as a share of the pension from the first pension pillar in the first year after retirement, spillarg, is independent of the statutory retirement age, as illustrated in Figure 8.
Aggregation by index t gives us the existing savings in the second pillar of the pension system for retired generations (with multiplier aret,
t g
μ ). The latter is then aggregated based on the number of pensioners, ν θg hrh, g h#, , and appropriately discounted using the reference steady state price, pt. In order to acquire the portion of net wages allocated to saving within the second
pillar of the pension system, the calculated savings are further divided by the net income from employment, l t g h, , , el t g h, , , t g h, ,
ty p π