R E S E A R C H
Open Access
Accuracy assessment of fusion transcript
detection via read-mapping and de novo
fusion transcript assembly-based methods
Brian J. Haas
1*, Alexander Dobin
2, Bo Li
1,3, Nicolas Stransky
4, Nathalie Pochet
1,5and Aviv Regev
1,6Abstract
Background:Accurate fusion transcript detection is essential for comprehensive characterization of cancer transcriptomes. Over the last decade, multiple bioinformatic tools have been developed to predict fusions from RNA-seq, based on either read mapping or de novo fusion transcript assembly.
Results:We benchmark 23 different methods including applications we develop, STAR-Fusion and TrinityFusion, leveraging both simulated and real RNA-seq. Overall, STAR-Fusion, Arriba, and STAR-SEQR are the most accurate and fastest for fusion detection on cancer transcriptomes.
Conclusion:The lower accuracy of de novo assembly-based methods notwithstanding, they are useful for reconstructing fusion isoforms and tumor viruses, both of which are important in cancer research.
Keywords:Fusion, RNA-seq, Cancer, Benchmarking, STAR-Fusion, TrinityFusion
Background
Chromosomal rearrangements leading to the formation of fusion transcripts are a frequent driver in certain can-cer types, including leukemia and prostate cancan-cer [1], and contribute to many others [2]. These include BCR– ABL1, found in ~ 95% of chronic myelogenous leukemia (CML) patients [3]; TMPRSS2–ERG in ~ 50% of prostate
cancers [4]; and DNAJB1–PRKACA, the hallmark and
likely driver of fibrolamellar carcinoma [5]. Determining the driver of a given tumor is important to inform diag-nosis and therapeutic strategies. For example, tyrosine kinase inhibitors have been highly effective in the treat-ment of tumors harboring kinase fusions in leukemia and other cancers [6–9].
Transcriptome sequencing (RNA-seq) has emerged as an effective method to detect fusion transcripts in the precision medicine pipeline. While point mutations and indels can be readily captured from whole exome se-quencing (WES), detecting genome rearrangements typ-ically requires whole genome sequencing (WGS). RNA-seq yields the“expressed exome”of the tumor, capturing
only the transcriptionally active regions of the genome, and thus provides a cost-effective means to acquire evi-dence for both mutations and structural rearrangements involving transcribed sequences, which can reflect on functionally relevant changes in the cancer genome.
Over the past decade, multiple bioinformatics methods and software tools have been developed to identify can-didate fusion transcripts from RNA-seq (reviewed in [10, 11]), with select methods leveraged in recent efforts to build catalogs of fusions across thousands of tumor sam-ples [12, 13]. Following the two general strategies for
RNA-seq analyses [14], RNA-seq-based fusion detection
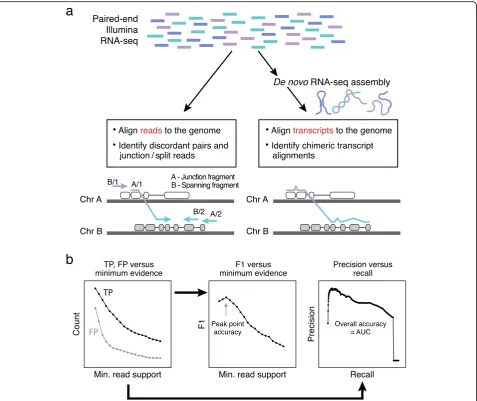
falls into two conceptual classes: (1) mapping-first ap-proaches that align RNA-seq reads to genes and ge-nomes to identify discordantly mapping reads that are suggestive of rearrangements and (2) assembly-first ap-proaches that directly assemble reads into longer tran-script sequences followed by identification of chimeric transcripts consistent with chromosomal rearrangements (Fig. 1a). Evidence supporting predicted fusions is typic-ally measured by the number of RNA-seq fragments found as chimeric (split or junction) reads that directly overlap the fusion transcript chimeric junction, or as dis-cordant read pairs (bridging read pairs or fusion span-ning reads) where each pair of reads maps to opposite
© The Author(s). 2019Open AccessThis article is distributed under the terms of the Creative Commons Attribution 4.0 International License (http://creativecommons.org/licenses/by/4.0/), which permits unrestricted use, distribution, and reproduction in any medium, provided you give appropriate credit to the original author(s) and the source, provide a link to the Creative Commons license, and indicate if changes were made. The Creative Commons Public Domain Dedication waiver (http://creativecommons.org/publicdomain/zero/1.0/) applies to the data made available in this article, unless otherwise stated.
* Correspondence:[email protected]
1Broad Institute of MIT and Harvard, Cambridge, MA 02142, USA
sides of the chimeric junction without directly overlap-ping the chimeric junction itself (Fig.1a).
Implementations of the various prediction methods vary in the read alignment tools employed, the genome database and gene set resources used, and criteria for reporting candidate fusion transcripts and for filtering out likely false positives. Available fusion predictors vary in prediction accuracy, installation complexity, execution time, robustness, and hardware requirements. Depend-ing on the fusion prediction tool chosen, processDepend-ing one RNA-seq sample containing tens of millions of reads can take several days’worth of computing and result in a list of hundreds to thousands of gene fusion candidates,
including many likely false positives, with little evidence supporting these predictions. Thus, fast and accurate methods for fusion detection are urgently needed, par-ticularly as RNA-seq is increasingly adopted in precision medicine and clinical diagnostics.
[image:2.595.61.539.87.488.2]to benchmark fusion accuracy leveraging real cancer transcriptome data without a priori defined gold stand-ard truth sets, and test a large number of tools. Specific-ally, we evaluate 23 different fusion detection methods (from 19 different software packages) that can leverage solely RNA-seq as input for fusion transcript detection (Table 1, Fig. 1b). This includes two software packages that we developed, STAR-Fusion and TrinityFusion: STAR-Fusion leverages chimeric and discordant read alignments identified by the STAR aligner [18,51,52] to predict fusions and TrinityFusion leverages chimeric
reads and Trinity de novo transcriptome assembly [48,
53] to reconstruct fusion transcripts and identify fusion candidates. We assess each method, evaluating sensitiv-ity and specificsensitiv-ity of fusion detection, and identify those methods best suited for accurate fusion detection from cancer RNA-seq.
Results
A panel of methods for fusion transcript detection We assessed 23 methods for fusion transcript detection,
including 18 methods primarily based on
read-alignments (Table 1): Arriba [17], ChimeraScan [19], ChimPipe [21], deFuse [24], EricScript [25], Fusion-Catcher [28], FusionHunter [30], InFusion [31], JAFFA-Direct [32], MapSplice [34], nFuse [36], Pizzly [37],
PRADA [39], SOAPfuse [40], STARChip [42],
STAR-Fusion, STAR-SEQR [44], and TopHat-Fusion [45], and
four methods primarily based on transcript assembly:
JAFFA-Assembly [32] and three execution modes of
Tri-nityFusion: TrinityFusion-C, TrinityFusion-D, and
TrinityFusion-UC. An additional assessed method,
JAFFA-Hybrid [32], leverages a combination of both
read mapping and de novo assembly approaches. For each method, we used its own recommended alignment and analysis strategy and parameters, as implemented in
its respective package (Table 1). We benchmarked each
method using simulated data and real RNA-seq from cancer cell lines. In certain cases, we assessed methods in either alternative execution modes, or according to assigned fusion confidence levels (see the“Methods” sec-tion). For example, we assessed Arriba using either all predicted fusions or restricting to only those that Arriba labeled as high confidence predictions (Arriba_hc). We assessed TrinityFusion in each of its three alternative execution modes, involving assembly of all input reads D), only chimeric reads (TrinityFusion-C), or both unmapped and chimeric reads (TrinityFu-sion-UC). We assessed accuracy using both strict and le-nient scoring criteria: while strict scoring relied on the pair of gene symbols corresponding to the genes pre-dicted to be fused, lenient scoring also allowed for likely paralogs to serve as acceptable proxies for fused target genes. We show lenient scoring here unless indicated
otherwise and point the reader to the“Methods” section
for further details and examples.
Fusion transcript prediction accuracy using simulated data
To assess accuracy in the context of a known ground truth, we applied each of the 23 methods to predict fu-sions on ten simulated RNA-seq data sets
(Add-itional file 1: Tables S1, S2), each containing 30 M
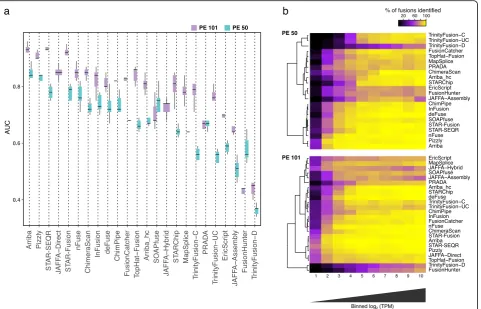
paired-end (PE) reads and each data set incorporating 500 simulated fusion transcripts expressed at a broad range of expression levels. To examine the effect of read length on fusion prediction accuracy, five of the data sets were based on 50 base reads and the other five on 101 base reads, reflecting typical read lengths of contempor-ary RNA-seq data sets and technologies.
We compared fusion detection accuracy for all
methods by several measures (Fig. 1b). We scored
true-and false-positive predictions for each method according
to minimum fusion evidence support (Additional file 2:
Figures S1, S2), and from these, we measured precision (positive predictive value (PPV or P)) and recall (sensi-tivity or true positive rate (TPR or R)). We calculated the area under the precision-recall (P-R) curve (AUC) as
the overall accuracy for each method (Fig. 1b) and
ex-amined the distribution of AUC values across samples for each method (Fig.2a).
Read length and fusion expression level affect sensitivity for fusion detection
On the simulated data, accuracy was almost entirely a function of sensitivity for fusion detection, as most methods exhibited few false positives (1–2 orders of mag-nitude lower). Only ChimeraScan accumulated large num-bers of false-positive predictions with longer reads, particularly involving fusions predicted with few support-ing reads (Additional file2: Figures S1–S3). Arriba, Pizzly, STAR-SEQR, and STAR-Fusion were the best performers on simulated data, with many close contenders. Methods requiring de novo transcriptome assembly, including Tri-nityFusion and JAFFA-Assembly, were among the least accurate; each exhibited high precision but suffered from comparably low sensitivity (Additional file2: Figures S1-S3). Nearly all methods had improved accuracy with lon-ger vs. shorter reads, except for FusionHunter and SOAP-fuse, which yielded higher accuracy with the shorter reads, and PRADA, which performed similarly regardless of read lengths examined.
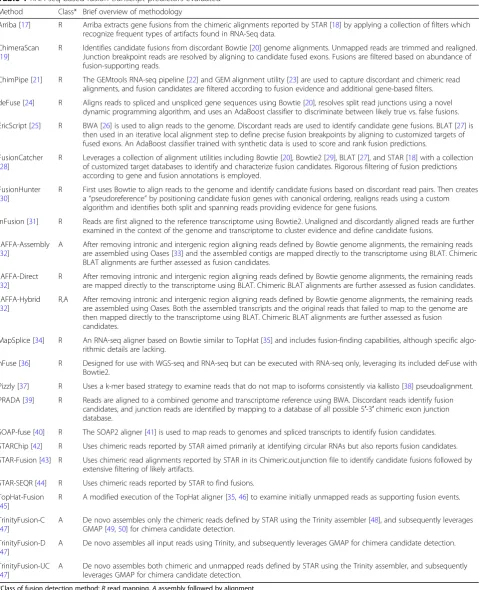
Table 1RNA-seq-based fusion transcript predictors evaluated
Method Class* Brief overview of methodology
Arriba [17] R Arriba extracts gene fusions from the chimeric alignments reported by STAR [18] by applying a collection of filters which recognize frequent types of artifacts found in RNA-Seq data.
ChimeraScan [19]
R Identifies candidate fusions from discordant Bowtie [20] genome alignments. Unmapped reads are trimmed and realigned. Junction breakpoint reads are resolved by aligning to candidate fused exons. Fusions are filtered based on abundance of fusion-supporting reads.
ChimPipe [21] R The GEMtools RNA-seq pipeline [22] and GEM alignment utility [23] are used to capture discordant and chimeric read alignments, and fusion candidates are filtered according to fusion evidence and additional gene-based filters.
deFuse [24] R Aligns reads to spliced and unspliced gene sequences using Bowtie [20], resolves split read junctions using a novel dynamic programming algorithm, and uses an AdaBoost classifier to discriminate between likely true vs. false fusions.
EricScript [25] R BWA [26] is used to align reads to the genome. Discordant reads are used to identify candidate gene fusions. BLAT [27] is then used in an iterative local alignment step to define precise fusion breakpoints by aligning to customized targets of fused exons. An AdaBoost classifier trained with synthetic data is used to score and rank fusion predictions.
FusionCatcher [28]
R Leverages a collection of alignment utilities including Bowtie [20], Bowtie2 [29], BLAT [27], and STAR [18] with a collection of customized target databases to identify and characterize fusion candidates. Rigorous filtering of fusion predictions according to gene and fusion annotations is employed.
FusionHunter [30]
R First uses Bowtie to align reads to the genome and identify candidate fusions based on discordant read pairs. Then creates a“pseudoreference”by positioning candidate fusion genes with canonical ordering, realigns reads using a custom algorithm and identifies both split and spanning reads providing evidence for gene fusions.
InFusion [31] R Reads are first aligned to the reference transcriptome using Bowtie2. Unaligned and discordantly aligned reads are further examined in the context of the genome and transcriptome to cluster evidence and define candidate fusions.
JAFFA-Assembly [32]
A After removing intronic and intergenic region aligning reads defined by Bowtie genome alignments, the remaining reads are assembled using Oases [33] and the assembled contigs are mapped directly to the transcriptome using BLAT. Chimeric BLAT alignments are further assessed as fusion candidates.
JAFFA-Direct [32]
R After removing intronic and intergenic region aligning reads defined by Bowtie genome alignments, the remaining reads are mapped directly to the transcriptome using BLAT. Chimeric BLAT alignments are further assessed as fusion candidates.
JAFFA-Hybrid [32]
R,A After removing intronic and intergenic region aligning reads defined by Bowtie genome alignments, the remaining reads are assembled using Oases. Both the assembled transcripts and the original reads that failed to map to the genome are then mapped directly to the transcriptome using BLAT. Chimeric BLAT alignments are further assessed as fusion candidates.
MapSplice [34] R An RNA-seq aligner based on Bowtie similar to TopHat [35] and includes fusion-finding capabilities, although specific algo-rithmic details are lacking.
nFuse [36] R Designed for use with WGS-seq and RNA-seq but can be executed with RNA-seq only, leveraging its included deFuse with Bowtie2.
Pizzly [37] R Uses a k-mer based strategy to examine reads that do not map to isoforms consistently via kallisto [38] pseudoalignment. PRADA [39] R Reads are aligned to a combined genome and transcriptome reference using BWA. Discordant reads identify fusion
candidates, and junction reads are identified by mapping to a database of all possible 5′-3′chimeric exon junction database.
SOAP-fuse [40] R The SOAP2 aligner [41] is used to map reads to genomes and spliced transcripts to identify fusion candidates. STARChip [42] R Uses chimeric reads reported by STAR aimed primarily at identifying circular RNAs but also reports fusion candidates. STAR-Fusion [43] R Uses chimeric read alignments reported by STAR in its Chimeric.out.junction file to identify candidate fusions followed by
extensive filtering of likely artifacts.
STAR-SEQR [44] R Uses chimeric reads reported by STAR to find fusions. TopHat-Fusion
[45]
R A modified execution of the TopHat aligner [35,46] to examine initially unmapped reads as supporting fusion events. TrinityFusion-C
[47]
A De novo assembles only the chimeric reads defined by STAR using the Trinity assembler [48], and subsequently leverages GMAP [49,50] for chimera candidate detection.
TrinityFusion-D [47]
A De novo assembles all input reads using Trinity, and subsequently leverages GMAP for chimera candidate detection.
TrinityFusion-UC [47]
A De novo assembles both chimeric and unmapped reads defined by STAR using the Trinity assembler, and subsequently leverages GMAP for chimera candidate detection.
assembly-based methods made the most notable gains due to increased read length. Of the de novo assembly-based methods, JAFFA-assembly (but not TrinityFusion) had a decrease in sensitivity at the most highly expressed fusions; this could be partly due to JAFFA-assembly using the Oases assembler [33] as opposed to the Trinity assem-bler [48] used by TrinityFusion. By restricting assembly to chimeric reads or to the combined chimeric and un-mapped reads, TrinityFusion-C and TrinityFusion-UC greatly outperformed TrinityFusion-D, which uses all in-put reads and had low to poor sensitivity for all but the most highly expressed fusions. TrinityFusion-D often pref-erentially reconstructed the normal (unfused) transcripts instead of rather than in addition to the fusion transcript (e.g., Additional file2: Figure S4).
Fusion transcript detection accuracy with RNA-seq from cancer cell lines
We next turned to benchmark fusion detection accuracy using RNA-seq from 60 cancer cell lines. A major chal-lenge in benchmarking using real RNA-seq is that the
truth set cannot be perfectly defined. Earlier
benchmarking studies of fusion prediction accuracy using RNA-seq from cancer cell lines [15,28,32,54,55] relied on 53 experimentally validated fusion transcripts from four breast cancer cell lines: BT474, KPL4, MCF7, and SKBR3 [56–59] (Additional file 1: Table S3). How-ever, these fusions arguably represent too small a target truth set for rigorous benchmarking, and the catalog of true fusions for these four cell lines may still be incomplete.
As an alternative, we pursued a “wisdom of crowds”
approach [60], where we define true fusions for bench-marking purposes as those predicted by at leastn differ-ent methods, false predictions as those predicted uniquely by any single method, and unsure (unscored) fusions as those non-unique fusions predicted by fewer
than n different methods (alternative scoring schemes
had mostly minimal effects (see the“Methods”section)). To this end, we called fusion predictions on the cancer cell line transcriptomes (Additional file1: Table S4).
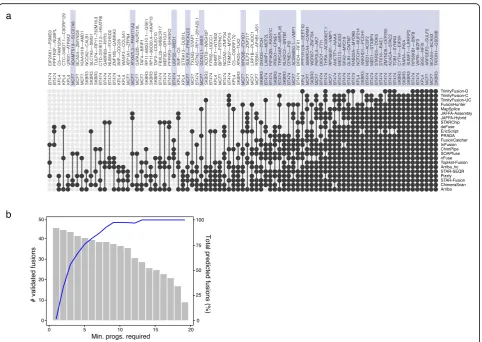
[image:5.595.60.542.88.397.2]fusions (SKBR3|CSE1L--AL035685.1) was predicted by a single method (FusionCatcher). Of a total of 86 fu-sions predicted by at least three methods, we found
44 experimentally validated fusions (Fig. 3a). As we
define potential fusion transcript truth sets by
requir-ing an increasrequir-ing number n of methods to agree,
there was an increased enrichment for experimentally validated fusions (Fig. 3b). Thus, by pursuing this ap-proach, rather than being limited to a single truth set, we could explore all possible truth sets defined by a
range of values for n and examine the distribution of
leaderboard rankings for methods across all evaluated truth sets. Accordingly, for the remaining 56 cancer cell line transcriptomes, we evaluated each truth set
from n= 3 to 10 and examined each method’s
leader-board ranking given each corresponding truth set (Fig. 4a). Notably, relative rankings were mostly stable
regardless of which n value was used to define the
truth set.
Top-performing fusion prediction methods assessed using cancer RNA-seq
STAR-Fusion had the best ranking across methods in most cases, followed by Arriba and STAR-SEQR (Fig.
4a). Our TrinityFusion-C method was ranked highest
among the de novo assembly methods. Notably, the top three ranked methods all leverage the STAR aligner; conversely, STARChip, which also uses STAR, had mod-erate accuracy, lacking sensitivity and specificity com-pared to other STAR-based methods. STARChip was primarily developed to detect circular RNAs and so may not have been fully optimized towards the detection of fusions. Restricting Arriba to its self-declared high confi-dence predictions results in slightly lower accuracy than leveraging its full set of predictions (Fig.4a, c), stemming from decreased sensitivity that is not sufficiently offset by its increased precision (Fig.4d).
Execution times varied dramatically across methods
(Fig. 4b). The fastest methods include Pizzly, an
[image:6.595.58.541.323.665.2]alignment-free kmer-based approach, followed by the
STAR-based methods and FusionCatcher. While
STAR-Fusion does not have an alignment-free
ap-proach, it does have an “alignment-previous”
ap-proach, such that if STAR was run previously as part of another RNA-seq pipeline (e.g., for transcript quantitation), it can use the chimeric junction data file generated during that alignment. This
STAR-Fusion “kickstart” mode had the fastest time for
fu-sion discovery (Fig. 4b).
Considering both accuracy and execution time, the most accurate methods, including STAR-Fusion, Arriba,
and STAR-SEQR, were also among the fastest (Fig. 4c).
ChimPipe and TrinityFusion-C were also found as high ranking for accuracy, but required far longer execution times. Based on sensitivity and precision at a point of peak prediction accuracy, we ascertain two groups of moderate-to-high accuracy predictors, either positioned
towards high sensitivity or high precision (Fig. 4d,
[image:7.595.61.541.88.524.2]SEQR comprise the high-sensitivity group, whereas PRADA, ChimPipe, SOAP-fuse, and the different execu-tion modes of TrinityFusion were in the high-specificity group. This pattern was robust for most truth sets ex-plored (Additional file2: Figure S5).
Exploration of de novo reconstructed transcripts of potential foreign origin
In addition to de novo reconstruction for fusion transcript identification, TrinityFusion, JAFFA, and other de novo assembly-based methods allow us to explore other tran-scripts that are not well represented by the reference gen-ome sequence or that are lacking from the reference altogether. In patient samples, these help provide insight into viruses or microbes evident in the sample, which may contribute to tumorigenesis or disease progression [63,64].
We thus further explored those
TrinityFusion-reconstructed transcripts from cancer cell lines that may be of viral or microbial origin. We searched all Trinity-Fusion (modes D, UC, and C)-reconstructed transcripts against available viral and bacterial sequences using Cen-trifuge [65] (Additional file 1: Table S5). Most cell lines (56/60) had at least one Trinity-reconstructed transcript classified by Centrifuge as likely of foreign origin. The vast majority of those (77%) were derived from TrinityFusion-UC, followed by TrinityFusion-D (23%), and included only two transcripts from TrinityFusion-C. Next, we aligned all TrinityFusion-UC-reconstructed transcripts against the combined viral, bacterial, and
hu-man genome database (blastn [66], e value threshold
10−10, with reconstructed sequences and alignment coor-dinates provided in Additional file1: Table S6). We only detected significant alignments to known mammalian vi-ruses and bacteriophage. Half of the cell lines had evi-dence of murine type C retrovirus (30/60), and Trinity fully or nearly fully reconstructed these viruses in cell lines VCaP_85 (9.5 kb contig) and G28050.KMM-1.1 (8.4 kb contig), with this pair of viruses sharing 94% nu-cleotide identity. Consistently, the VCaP_85 retrovirus sequence was previously reported as a xenotropic mur-ine leukemia virus in prostate cancer cell lmur-ine VCaP [67]. Nine cell lines had evidence of “squirrel monkey retro-virus”—originally identified in a lymphoblastoid cell [68]. Other notable examples included a 40-kb contig corre-sponding to the phage lambda genome that we recon-structed from the K562 cell line RNA-seq reads (possibly a spike-in control or sequencing library con-tamination), and a bovine polyomavirus in breast cancer cell line SKBR3, likely reflecting contamination through fetal bovine serum albumin [69].
Discussion
Fast and accurate fusion detection is important in both cancer research and the precision medicine pipeline.
Despite dozens of tools and utilities being available, users have few guidelines as to which to pursue, and de-velopers do not have clear benchmarks to assess the util-ity of newly proposed methods. Our comprehensive benchmarking shows that only a few of the available tools were both fast and accurate, highlighting those best suited to meet the demands of large-scale tumor sample screening.
In particular, STAR-Fusion, Arriba, and STAR-SEQR had the best combination of speed and accuracy com-pared to 19 other methods evaluated on cancer tran-scriptome data. These were also among the most accurate methods when evaluated with simulated RNA-seq, which mostly differentiated methods based on sensi-tivity rather than precision of fusion prediction.
Al-though FusionCatcher was not among the top
performing methods on simulated data, its overall accur-acy and execution times were impressive. Note that an earlier version of FusionCatcher (v0994e) had a slightly improved accuracy in our evaluations compared to the contemporary release (v1.10), with the latest release seemingly tuned for improved recall at the cost of re-duced precision (Additional file2: Figures S1–S3, S5). In contrast to an earlier assessment of fusion prediction ac-curacy that found EricScript to be top-ranking [16], in our assessment, EricScript was the least accurate method on cancer cell line RNA-seq, suffering mostly from a high rate of false positives. Unless indicated otherwise, we used default parameters for all methods. Adjustments in parameters could certainly impact accuracy character-istics, and the framework for benchmarking fusion de-tection methods that we established here facilitates
exploration of the parameter space for further
optimization, and exploring accuracy characteristics across software versions.
While our RNA-seq simulations were useful for defin-ing an unambiguous truth set, and evaluatdefin-ing the impact of fusion expression levels and read length, some charac-teristics of real RNA-seq data are not presently modeled, such as reverse transcription artifacts and off-target transcription (e.g., non-spliced introns and intergenic transcription). Future developments that improve on RNA-seq simulations should further the use of simulated data for benchmarking fusion detection and related methods.
Our application of the “wisdom of crowds” approach
methods on the four breast cancer cell lines, we identi-fied additional well-supported fusions that have not yet been experimentally tested to our knowledge. One of these fusions, SULF2--ZNF217 predicted by nine differ-ent methods in cell line MCF7, was recdiffer-ently predicted to be a potential driver of breast cancer [70]. Future follow-up investigations are likely to capture experimental evi-dence for many of these additional fusions as well.
The read-mapping-based approaches to fusion detec-tion have a level of sensitivity that is not met by de novo assembly-based methods, requiring at minimum a small number of fusion-supporting reads that would unlikely assemble into a sufficiently long transcript contig. By restricting the assembly to the chimeric and unmapped reads, TrinityFusion demonstrated greater accuracy in fusion detection than from assembling all of the input reads, presumably due to the reduced search space and the depletion of reads from the non-fused counterparts that could interfere with robust fusion isoform assembly. De novo methods do have other advantages in addition to recovering fusion isoform sequences. By exploring the de novo reconstructed transcripts derived from chimeric and unmapped reads, we identified transcripts of likely foreign origin among many of the cancer cell lines, in-cluding tumor viruses. Our TrinityFusion-UC method for assembly and analysis of de novo reconstructed tran-scripts based on unmapped and chimeric reads should continue to prove useful in future studies that extend to patient samples.
While there have been substantial advances in fusion detection algorithms over the last decade, there remain opportunities for improving fusion transcript prediction accuracy, developing more realistic RNA-seq simula-tions, and expanding the catalog of experimentally vali-dated fusion transcripts. As sequencing technologies and experimental protocols continue to evolve, the universe of available methods and software will surely continue to expand. Our fusion transcript benchmarking framework provides a flexible system for evaluating these newly de-veloped methods as they become available. All bench-marking software and data are freely available athttps:// github.com/fusiontranscripts/FusionBenchmarking.
Conclusion
In applying our fusion transcript benchmarking frame-work to 21 different methods, leveraging simulated and real cancer RNA-seq, we identified STAR-Fusion, Arriba, and STAR-SEQR as top performers and likely best suited for current applications in processing cancer transcriptome samples. While the de novo assembly-based fusion detection methods are unable to attain the sensitivity of the read-mapping-based approaches, they provide more complete fusion isoform sequence evi-dence and can reconstruct foreign transcripts such as
tumor viruses. Our fusion transcript benchmarking methods and software provide a framework and metrics for systematic benchmarking and evaluation of add-itional methods as they become available.
Methods
Benchmarking fusion prediction accuracy
We assessed fusion prediction accuracy using simulated and real RNA-seq and compared 23 fusion prediction methods including methods we developed and described
here: STAR-Fusion [43] and three execution modes of
TrinityFusion [47]. Specifically, we downloaded and in-stalled each of (1) Arriba [17], (2) ChimeraScan [19], (3) ChimPipe [21], (4) deFuse [24], (5) EricScript [25], (6) FusionCatcher [28], (7) FusionHunter [30], (8) InFusion [31], (9) JAFFA-Assembly [32], (10) Jaffa-Direct [32], (11) JAFFA-Hybrid [32], (12) MapSplice [34], (13) nFuse [36], (14) Pizzly [37], (15) PRADA [39], (16) SOAPfuse [40], (17) STARChip [42], (18) STAR-SEQR [44], and (19) TopHat-Fusion [45, 46]. To ensure consistency, we reconfigured SOAPfuse and TopHat-Fusion to leverage the GENCODE v19 annotation. Programs and
parame-ters used are provided in Additional file 1: Table S7.
Benchmarking data, scripts, and the analysis protocols followed are further provided at [71].
Simulated fusion transcripts and RNA-Seq
We generated simulated chimeric transcripts using cus-tom scripts, developed and released here as the
Fusion-Simulator Toolkit [72]. FusionSimulator selects two
protein-coding genes at random from the GENCODE v19 annotations [73]. It then constructs a fusion tscript by randomly fusing a pair of exons selected at
ran-dom from each gene, requiring that each gene
contributes at least 100 bases of transcript sequence to the generated fusion and that the fusion breakpoint oc-curs between two exons that have consensus dinucleo-tide splice sites. In generating a set of fusion genes, any gene participating as a fusion partner is allowed to exist in only one fusion pair.
We simulated RNA-Seq reads using “
rsem-simulate-reads” in the RSEM software [74]. RSEM was first used to estimate the expression values of the GENCODE v19 reference transcripts supplemented with the simulated fusion transcripts. Next, the expression values of the simulated fusion transcripts were reset randomly
accord-ing to a log2 distribution of transcripts per million
switching or other important confounding characteris-tics of real RNA-seq data that are relevant to fusion
de-tection. After directly setting fusion transcript
expression values, all transcript expression values were renormalized to TPM values (summing to 1 million) and subject to RNA-seq read simulation using rsem-simulate-reads.
This process was applied separately for ten samples, each generating 500 random fusions and simulating 30 million PE Illumina RNA-seq reads. Half of the simu-lated samples generated 50 base reads (PE-50) and the other half 101 base reads (PE-101). The PE-50 reads were modeled on short RNA-seq reads generated by the Illumina Human Body Map 2.0 study (ArrayExpress
study E-MTAB-513 [75];), and the PE-101 based on a
set of cancer cell lines from the Cancer Cell Line Encyclopedia (CCLE) [76] (sources for the targeted data sets are listed in Additional file 1: Table S8). Simulated fusion transcripts and simulated RNA-seq are made available at [77].
Fusion prediction in cancer cell line transcriptomes Paired-end Illumina RNA-seq were obtained from 60 publicly available cancer cell line data sets, spanning a variety of cancer types (data sources and representative cancer types are listed in Additional file 1: Table S9). Cancer cell lines included 52 from the CCLE project and further supplemented with 8 other cancer cell lines popularly studied for fusion detection including the breast cancer cell lines BT474, KPL4, MCF7, and SKBR3
[56]; VCaP (prostate cancer); LC2/ad and H2228 (lung
adenocarcinoma); and K562 (erythroleukemia). To facili-tate benchmarking and runtime analysis, 20 million paired-end reads were randomly sampled from each data set and targeted for fusion prediction. All sampled can-cer cell line RNA-seq data targeted for fusion discovery
are available at [78]. For CCLE RNA-seq, the names of
the reads leveraged are provided, and the sequences must be obtained from the CCLE project according to their data use agreement. For other publicly available cell line RNA-seq, the FASTQ files as used here are dir-ectly accessible.
Fusion prediction accuracy computation
True-positive (TP), false-positive (FP), and false-negative (FN) fusion predictions were assessed for each method. The true positive rate (TPR; or recall or sensitivity), positive predictive value (PPV, precision), and F1 accur-acy measure (the harmonic mean of TPR and PPV) were computed according to standards:
Recall¼TPR¼TP=ðTPþFNÞ
Precision¼PPV¼TP=ðTPþFPÞ
F1¼2ðTPRPPVÞ=ðTPRþPPVÞ
TP and FP were assessed at each minimum supporting evidence threshold to generate precision-recall curves, and prediction accuracy was measured as the area under the precision-recall curve (AUC), which is better suited than the popular receiver operating characteristic curve for studies such as fusion prediction where the numbers of true negatives (at least ~ 20k2, considering possible gene pairings) far exceed the number of true-positive fu-sions [79].
Fusion accuracy computations as described here were performed using lenient scoring criteria as follows. Given a true fusion pair “GeneA–GeneB”, the following predictions would be scored as true positives:
“GeneB–GeneA”having the fusion partners in reverse order
“GeneZ–GeneB”where GeneZ physically overlaps the genomic coordinates of GeneA
“GeneZ–GeneB”where GeneZ is a potential paralog of GeneA
Further, in the case where multiple fusions are pre-dicted and there is uncertainty as to which paralogous family member is the true fusion partner (i.e., “GeneA–
GeneB” is predicted in addition to GeneZ–GeneB, the
fusion GeneA–GeneB is scored as a single TP, and
GeneZ–GeneB is ignored. Each of the rules described
above applies identically for cases where GeneZ replaces GeneB instead of GeneA. This lenient scoring mostly serves to reduce numbers of FP resulting from paralog confusion or uncertainty, as shown in Additional file 2: Figure S6.
For the cancer cell lines, truth sets were defined by
fu-sions agreed upon by at least n different methods. The
pairwise correlations among fusion predictions by methods are shown in cr 2: Additional file 2: Figure S7. To avoid including highly correlated methods that would otherwise bias the wisdom of crowds approach, JAFFA-Hybrid was excluded due to its high correlation with JAFFA-Direct. Furthermore, TrinityFusion-C but not the other TrinityFusion modes contributed votes. Since we did not utilize DNA-seq data here, nFuse was executed using its included version of deFuse as instructed [80]; since nFuse (deFuse) was not found highly correlated with the original deFuse predictions, we retained both. Finally, while Arriba_hc was scored separately from Arriba, those fusion predictions did not contribute votes independently from Arriba. Fusions predicted by at least
two methods but fewer thann methods were treated as
scoring schemes that penalize the uncertain predictions or fail to account for paralog uncertainty are shown in Additional file2: Figures S8,S9.
Fusion prediction by STAR-Fusion
STAR-Fusion is a component of the Trinity Cancer
Transcriptome Analysis Toolkit (CTAT) project [81]
and leverages a precompiled bundle of genomic re-sources and metadata provided as a CTAT genome li-brary (described below). The STAR-Fusion pipeline
(Additional file 2: Figure S10) takes Illumina RNA-seq
data as input and generates lists of candidate fusion transcripts as output. STAR-Fusion release v1.5 was used with the STAR aligner v2.6.1a. The STAR aligner command is as follows (example provided for cell line K562 test data):
STAR –genomeDir CTAT_GENOME_LIB/GRCh37_
gencode_v19_CTAT_lib_Feb092018/ctat_genome_lib_
build_dir/ref_genome.fa.star.idx --outReadsUnmapped
None --chimSegmentMin 12 --chimJunctionOverhang-Min 12 --chimOutJunctionFormat 1
--alignSJDBover-hangMin 10 --alignMatesGapMax 100000
--alignIntronMax 100000 --alignSJstitchMismatchNmax 5 -1 5 5 --runThreadN 1 --outSAMstrandField
intro-nMotif --outSAMunmapped Within --outSAMtype
BAM Unsorted --readFilesIn K562/reads. SRR521460_
1.fastq.20 M.fq.gz K562/reads. SRR521460_2.fastq.20
M.fq.gz--outSAMattrRGline ID:GRPundef --chimMulti-mapScoreRange 10 --chimMultimapNmax 10
--chim-NonchimScoreDropMin 10 –peOverlapNbasesM 0.1
--genomeLoad NoSharedMemory --twopassMode Basic --readFilesCommand“gunzip -c”.
The resulting “Chimeric.out.junction” file containing all chimeric split and discordant reads is leveraged as in-put to STAR-Fusion.
STAR-Fusion maps the reads to exons of reference gene structure annotations based on coordinate overlaps. STAR-Fusion primarily focuses on filtering the align-ment evidence and preliminary fusion predictions to re-move likely artifacts and likely false-positive predictions. First, read alignments between pairs of genes that are lo-calized to sequence similar regions between those genes are excluded (Additional file 2: Figure S11). A database of all-vs-all blastn matches between all reference cDNA sequences is queried to identify regions of sequence similarity between candidate fusion genes. If chimeric read alignment evidence overlaps sequence similar re-gions, the alignment is discarded. Duplicate paired-end read alignments are removed, and the remaining align-ments are assigned to preliminary fusion gene pair can-didates. STAR-Fusion selects those candidate gene pairs for which the fusion-supporting evidence indicates a sense-sense orientation between the fusion pairs and scores them according to the number of split reads
supporting the fusion breakpoint and the number of paired-end fragments that span the breakpoint.
These preliminary fusion gene candidates are filtered in two stages: a basic filtering stage that requires mini-mum fusion evidence support and an advanced filtering stage that examines characteristics of the genes involved in the candidate fused gene pairs. The basic filtering re-quires that at least two RNA-seq fragments support the fusion and at least one of the reads is a split read that defines the fusion breakpoint within the spliced tran-scripts (Additional file 2: Figure S12a). If the fusion breakpoint does not correspond to annotated reference exon splice sites, then at least three split reads are re-quired to provide evidence for that breakpoint. If there are no spanning fragments and only split reads support-ing the fusion, then we require at least 25 base length alignment on each side of the splice junction (Additional file2: Figures S12b).
The advanced fusion filtering involves a series of oper-ations that examine characteristics of the fusion genes in the context of the individual fusion pair and in compari-son to other fusion predictions called in that sample:
Fusion paralog filter: excludes fusion candidate GeneA–GeneB if GeneA is a likely paralog of GeneB. Also, if there exists a candidate“GeneA– GeneC”such that GeneC is a likely paralog of GeneB, and the fusion evidence supporting GeneA– GeneB > GeneA–GeneC, then GeneA–GeneC is discarded assuming GeneA–GeneB is the correct fusion and the evidence for GeneA–GeneC likely stems from mismapping.
Promiscuous fusion filter: if candidate GeneA– GeneB exists along with alternative fusion
candidates GeneA–GeneC and GeneA–GeneD, and the fusion evidence supporting GeneA–GeneB greatly exceeds that of the alternative fusions (at least 20× support), the alternatives are discarded and the dominant fusion pair is retained. If afterwards, GeneA is found to have at least ten fusion partners, all GeneA-containing fusion pairs are excluded from the sample altogether.
“Red herring”filter: fusion pairs are annotated using FusionAnnotator [82] with the CTAT Human Fusion Lib database release v0.1.0 [83]. Any fusion pair annotated as having been found in normal RNA-seq data sets, including a mitochondrial or HLA gene partner, is discarded. Any fusion involv-ing gene pairs that are both immunoglobulin gene segments are also discarded.
candidates having less than 1 evidence fragment per 10 M total reads (0.1 FFPM) are discarded as insuffi-ciently supported. The 0.1 FFPM corresponds to the 0.99 quantile of FFPM values for non-recurrent fu-sions identified in GTEx samples (data not shown).
The advanced fusion filtering described above is im-plemented in our “FusionFilter” [84] software module shared among CTAT fusion software. STAR-Fusion code and documentation is available on GitHub at [43]. STAR-Fusion was executed from with a Docker image containing all software, including the FusionAnnotator and FusionFilter modules, as provided on DockerHub [85].
Fusion prediction by TrinityFusion
An overview of the TrinityFusion pipeline is provided as Additional file 2: Figure S13. The TrinityFusion pipeline uses the Trinity assembler to de novo reconstruct
tran-script sequences from RNA-seq, and GMAP [49, 50] to
then align the transcripts to the genome to identify can-didate chimeric sequences. The fusion cancan-didates are ex-amined to remove likely assembly artifacts, and read support for the fusion is estimated by leveraging Bowtie2 [29] to align the original RNA-seq reads to the Trinity fusion transcripts to further classify reads as fusion span-ning or junction reads.
TrinityFusion has three different execution modes based on the inputs to be used for de novo reconstruc-tion and subsequent fusion detecreconstruc-tion:
TrinityFusion-D performs Trinity de novo assembly on all input reads.
TrinityFusion-C restricts Trinity de novo assembly to only those reads defined as chimeric or
discordant according to STAR genome alignments.
TrinityFusion-UC utilizes both the chimeric and discordant reads along with all reads that fail to align to the genome according to STAR.
For execution modes TrinityFusion-C and
TrinityFusion-UC, there is a prerequisite that STAR has been executed (as described above for STAR-Fusion) to generate the genome read alignments (bam output file) and the STAR Chimeric.out.junction that defines the discordant and chimeric read alignments. TrinityFusion uses these reports to define the target reads and then ex-tracts them from the input FASTQ files to create inputs for Trinity de novo assembly.
The reconstructed transcripts are aligned to the hu-man reference genome as provided in the CTAT gen-ome lib (see below) like so, using GMAP:
gmap -D $GMAP_DB_DIR -d $GMAP_DB_NAME Trinity.fasta -f 3 -n 0 -x 30 -t $CPU > gmap.gff3.
The chimeric alignments defined by GMAP are then further annotated according to overlap with reference gene annotations. To avoid likely false positives arising from misassembly of related sequences, we examine the precision of the alignment at the breakpoint between the two gene candidates. Each candidate chimeric transcript assembly sequence is extracted and split with 25 base overhangs at the putative breakpoint. Then, each split sequence with overhang is realigned to the reference genome using GMAP to determine the extent of the alignment into the overhang region at each putative chimeric locus. If alignments extend beyond 12 bases into the overhang region, that candidate fusion tran-script is eliminated as a likely assembly artifact between sequence-similar genes. This fuzzy alignment logic was inspired by a similar process performed by JAFFA-assembly [32] that examines fuzzy boundaries of candi-date chimeric BLAT [27] alignments.
All input reads are then aligned against the remaining candidate assembled chimeric fusion transcripts using Bowtie2 like so:
bowtie2 -k10 -p 4 --no-mixed --no-discordant --very-fast --end-to-end -x $bowtie2_target -1 $left_fq_file -2 $right_fq_file
Reads spanning or overlapping the fusion breakpoint are counted. The breakpoint is required to precisely match reference exon splice sites, as allowing for non-reference splice junctions was found to greatly inflate the false-positive rate (data not shown). At least two RNA-seq fragments must align across or span the
break-point supporting the fusion. If there are only
breakpoint-overlapping reads and no spanning frag-ments, then we ensure that the 12 bases on both sides of the breakpoint are of sufficient sequence complexity, re-quiring an entropy≥1.5.
Finally, fusion gene pairs are filtered according to the
same “advanced” filtering criteria leveraged by
STAR-Fusion as implemented in the STAR-FusionFilter module, con-sidering paralogs, promiscuity, and potential red herrings.
TrinityFusion software organization: TrinityFusion, as other Trinity CTAT software pipelines, is implemented as a set of software modules that can be easily shared among Trinity CTAT applications for flexible execution wherever shared functionality is desirable. The Trinity-Fusion discordant and unmapped read assembly is
en-capsulated by a DISCASM module [86]. The assembled
transcript chimeric alignment detection is encapsulated
by our GMAP-fusion module [87]. Both DISCASM and
GMAP-fusion are then leveraged as shared submodules that define the TrinityFusion software. TrinityFusion software code and documentation is available on GitHub
at [88]. TrinityFusion was executed as a Singularity
The CTAT genome library leveraged by STAR-Fusion and TrinityFusion
The CTAT genome library includes the human refer-ence genome, referrefer-ence gene structure annotations, and a database of all-vs-all blastn alignments among the ref-erence transcript sequences used for paralog detection and evaluating potential read mismappings between similar gene sequences. The CTAT genome library used in this study includes the human hg19 reference genome
and GENCODE v19 gene annotations [73]. Blastn
align-ments were generated separately for reference coding se-quences (CDS) supplemented with long noncoding RNAs (lncRNAs) and for reference cDNA sequences (in-cluding untranslated regions) as follows:
All-vs-all blastn search using CDS and lncRNAs:
“blastn -query ref_annot.cdsplus.fa -db
ref_annot.cds-plus.fa -max_target_seqs 10000 -outfmt 6 -evalue 1e-10
-num_threads $CPU -dust no > ref_
annot.cdsplus.allvsall.outfmt6”
All-vs-all blastn search using cDNA sequences:“blastn -query ref_annot.cdna.fa -db ref_annot.cdna.fa -max_tar-get_seqs 10000 -outfmt 6 -evalue 1e-10 -num_threads $CPU -dust no > ref_annot.cdna.allvsall.outfmt6”
The above-generated “
ref_annot.cdsplus.allvsal-l.outfmt6”alignments are used for candidate paralog de-tection, and the above “ref_annot.cdna.allvsall.outfmt6” alignments are used for assessing read alignments tween gene pairs. This latter file includes alignments be-tween UTR regions that may confound read mappings but may not indicate evolutionarily relatedness between corresponding genes (i.e., alignments among repeats in UTR regions).
The CTAT genome lib also incorporates our human fusion library [83], which incorporates lists of fusions relevant to cancer, and those identified among normal tissues and unlikely to be relevant to cancer biology. The cancer-relevant fusions include those reported in the Mitelman Database of Chromosome Aberrations and Gene Fusions in Cancer [90], ChimerDB 2.0 [91], COS-MIC [92,93], and fusions discovered in cancer cell lines and surveys of tumor samples [1,94, 95]. Those fusions found in normal tissues comprise our red herrings list and include those previously identified via our internal screens of GTEx data, our exploration of the Illumina
human body map data [75], previous reports of fusions
found in normal tissue samples [96–98], and lists of gene families and paralogs that may confound fusion prediction [99, 100]. FusionCatcher uses many of these same resources, and we credit FusionCatcher for inspir-ing the development of our growinspir-ing collection and our
companion utility FusionAnnotator [82] for annotating
gene fusions accordingly. FusionAnnotator comes bun-dled as a shared software module in both CTAT fusion tools STAR-Fusion and TrinityFusion.
Supplementary information
Supplementary informationaccompanies this paper athttps://doi.org/10. 1186/s13059-019-1842-9.
Additional file 1.Table S1.simulated 50 base PE read fusion predictions;Table S2.simulated 101 base PE read predictions;Table S3. known experimentally validated fusions;Table S4.fusion predictions on cancer cell lines;Table S5.Centrifuge-based viral and microbial source predictions for Trinity-assembled transcripts;Table S6.Viral assignments of Trinity-UC assembled transcripts via blastn;Table S7.Fusion prediction software commands;Table S8.sources of RNA-seq data for modeling simulated RNA-seq;Table S9.Cancer cell lines targeted for fusion discovery.
Additional file 2:Figure S1.Prediction counts vs. minimum sum evidence fragments for the simulated 50 base length PE reads;Figure S2.Prediction counts vs. minimum sum evidence fragments for the simulated 101 base length PE reads;Figure S3.TPR and PPV at maximum F1 for fusion predictions based on simulated data sets;Figure S4.Contrasting de novo transcript reconstructions according to TrinityFusion execution mode;Figure S5.TPR vs. PPV at maximum F1 for each truth set;Figure S6.Adjustments in counts of TP and FP after accepting likely paralogs as proxies for known fusion partners;Figure S7. Correlation of fusion predictions among methods on the cancer cell line data sets;Figure S8.Impact of‘allow paralogs’and‘ignore uncertain’ fusions on accuracy rankings;Figure S9.Distribution of accuracy rankings with the paralog proxy allowance disabled;Figure S10. Overview of the STAR-Fusion pipeline;Figure S11.Filtering of chimeric and discordant reads;Figure S12.Basic criteria for filtering preliminary fusion candidates;Figure S13.TrinityFusion Pipeline.
Additional file 3.Review history.
Acknowledgements
We thank our many collaborators including Timothy Tickle, Asma Bankapur, Carrie Ganote, Thomas Doak, Jing Sun, Catherine Wu, and Xiao Yang for contributions towards our earliest efforts in the development of our fusion detection methods, supporting community access to Trinity CTAT execution, and in applications to patient samples. We additionally thank Daniel Nicorici, author of FusionCatcher, for inspiration and guidance. We finally thank Leslie Gaffney and Ania Hupalowska for assistance with graphical illustrations.
Peer review information
Yixin Yao was the primary editor on this article and managed its editorial process and peer review in collaboration with the rest of the editorial team.
Review history
The review history is available as Additional file3. Authors’contributions
BH wrote the STAR-Fusion and TrinityFusion software, developed the bench-marking data sets, performed the benchbench-marking, and wrote the initial draft of the manuscript. AD enhanced his STAR aligner software to further im-prove support for fusion detection and collaborated with BH in the develop-ment of STAR-Fusion. BL contributed to benchmarking methods and related code. NS conceptualized the earliest invocation of STAR-Fusion and collabo-rated with BH on further development and implementation. Similarly, NP conceptualized the earliest invocation of TrinityFusion and collaborated with BH on further development and implementation. AR is the principal investi-gator, guided efforts, and contributed to writing the final manuscript. All au-thors read and approved the final manuscript.
Funding
This work has been supported by Howard Hughes Medical Institute, the Klarman Cell Observatory, and National Cancer Institute grants U24CA180922, R50CA211461, R21CA209940, and U01CA214846 collaborative set aside.
Availability of data and materials
TrinityFusionhttps://github.com/trinityrnaseq/TrinityFusion/wiki[47], and our fusion simulation https://github.com/FusionSimulatorToolkit/FusionSimulator-Toolkit/wiki[72] and benchmarking code https://github.com/fusiontran-scripts/FusionBenchmarking/wiki[71]. Our benchmarking data are made publicly available from our Broad data repository, including the samples with simulated 50 or 101 base PE readshttps://data.broadinstitute.org/Trinity/ CTAT_FUSIONTRANS_BENCHMARKING/on_simulated_data/[77], and samples corresponding to the 60 cancer cell lines https://data.broadinstitute.org/Trin-ity/CTAT_FUSIONTRANS_BENCHMARKING/on_cancer_cell_lines/[78]. Ethics approval and consent to participate
Not applicable.
Consent for publication Not applicable.
Competing interests
AR is a founder of and equity holder in Celsius Therapeutics and an SAB member of ThermoFisher Scientific, Neogene, and Syros Pharmaceuticals. All other authors declare that they have no competing interests.
Author details
1Broad Institute of MIT and Harvard, Cambridge, MA 02142, USA.2Cold
Spring Harbor Laboratory, Cold Spring Harbor, NY 11724, USA.3Center for Immunology and Inflammatory Diseases, Division of Rheumatology, Allergy, and Immunology, Massachusetts General Hospital and Harvard Medical School, Boston, MA 02129, USA.4Celsius Therapeutics, Cambridge, MA 02139, USA.5Ann Romney Center for Neurologic Diseases, Department of Neurology, Brigham and Women’s Hospital, Harvard Medical School, Boston, MA 02115, USA.6Howard Hughes Medical Institute, and Koch Institute for Integrative Cancer Research, Department of Biology, Massachusetts Institute of Technology, Cambridge, MA 02140, USA.
Received: 19 May 2019 Accepted: 28 September 2019
References
1. Yoshihara K, Wang Q, Torres-Garcia W, Zheng S, Vegesna R, Kim H, et al. The landscape and therapeutic relevance of cancer-associated transcript fusions. Oncogene. 2015;34(37):4845–54.
2. Stransky N, Cerami E, Schalm S, Kim JL, Lengauer C. The landscape of kinase fusions in cancer. Nat Commun. 2014;5:4846.
3. Lim TH, Tien SL, Lim P, Lim AS. The incidence and patterns of BCR/ABL rearrangements in chronic myeloid leukaemia (CML) using fluorescence in situ hybridisation (FISH). Ann Acad Med Singap. 2005;34(9):533–8. 4. Tomlins SA, Rhodes DR, Perner S, Dhanasekaran SM, Mehra R, Sun XW, et al.
Recurrent fusion of TMPRSS2 and ETS transcription factor genes in prostate cancer. Science. 2005;310(5748):644–8.
5. Honeyman JN, Simon EP, Robine N, Chiaroni-Clarke R, Darcy DG, Lim II, et al. Detection of a recurrent DNAJB1-PRKACA chimeric transcript in fibrolamellar hepatocellular carcinoma. Science. 2014;343(6174):1010–4.
6. Zhao Z, Verma V, Zhang M. Anaplastic lymphoma kinase: role in cancer and therapy perspective. Cancer Biol Ther. 2015;16(12):1691–701.
7. Shaw AT, Solomon BJ. Crizotinib in ROS1-rearranged non-small-cell lung cancer. N Engl J Med. 2015;372(7):683–4.
8. Druker BJ, Guilhot F, O'Brien SG, Gathmann I, Kantarjian H, Gattermann N, et al. Five-year follow-up of patients receiving imatinib for chronic myeloid leukemia. N Engl J Med. 2006;355(23):2408–17.
9. Gross S, Rahal R, Stransky N, Lengauer C, Hoeflich KP. Targeting cancer with kinase inhibitors. J Clin Invest. 2015;125(5):1780–9.
10. Latysheva NS, Babu MM. Discovering and understanding oncogenic gene fusions through data intensive computational approaches. Nucleic Acids Res. 2016;44(10):4487–503.
11. Wang Q, Xia J, Jia P, Pao W, Zhao Z. Application of next generation sequencing to human gene fusion detection: computational tools, features and perspectives. Brief Bioinform. 2013;14(4):506–19.
12. Gao Q, Liang WW, Foltz SM, Mutharasu G, Jayasinghe RG, Cao S, et al. Driver fusions and their implications in the development and treatment of human cancers. Cell Rep. 2018;23(1):227–38 e3.
13. Hu X, Wang Q, Tang M, Barthel F, Amin S, Yoshihara K, et al. TumorFusions: an integrative resource for cancer-associated transcript fusions. Nucleic Acids Res. 2018;46(D1):D1144–D9.
14. Haas BJ, Zody MC. Advancing RNA-Seq analysis. Nat Biotechnol. 2010;28(5): 421–3.
15. Carrara M, Beccuti M, Lazzarato F, Cavallo F, Cordero F, Donatelli S, et al. State-of-the-art fusion-finder algorithms sensitivity and specificity. Biomed Res Int. 2013;2013:340620.
16. Kumar S, Vo AD, Qin F, Li H. Comparative assessment of methods for the fusion transcripts detection from RNA-Seq data. Sci Rep. 2016;6:21597. 17. Uhrig S. Arriba - Fast and accurate gene fusion detection from RNA-Seq
data 2019. Available from:https://github.com/suhrig/arriba.
18. Dobin A, Davis CA, Schlesinger F, Drenkow J, Zaleski C, Jha S, et al. STAR: ultrafast universal RNA-seq aligner. Bioinformatics. 2013;29(1):15–21. 19. Iyer MK, Chinnaiyan AM, Maher CA. ChimeraScan: a tool for identifying
chimeric transcription in sequencing data. Bioinformatics. 2011;27(20):2903–4. 20. Langmead B, Trapnell C, Pop M, Salzberg SL. Ultrafast and memory-efficient
alignment of short DNA sequences to the human genome. Genome Biol. 2009;10(3):R25.
21. Rodriguez-Martin B, Palumbo E, Marco-Sola S, Griebel T, Ribeca P, Alonso G, et al. ChimPipe: accurate detection of fusion genes and transcription-induced chimeras from RNA-seq data. BMC Genomics. 2017;18(1):7. 22. GEMTools. GEMTools 2019. Available from:http://gemtools.github.io/. 23. Marco-Sola S, Sammeth M, Guigo R, Ribeca P. The GEM mapper: fast, accurate
and versatile alignment by filtration. Nat Methods. 2012;9(12):1185–8. 24. McPherson A, Hormozdiari F, Zayed A, Giuliany R, Ha G, Sun MG, et al.
deFuse: an algorithm for gene fusion discovery in tumor RNA-Seq data. PLoS Comput Biol. 2011;7(5):e1001138.
25. Benelli M, Pescucci C, Marseglia G, Severgnini M, Torricelli F, Magi A. Discovering chimeric transcripts in paired-end RNA-seq data by using EricScript. Bioinformatics. 2012;28(24):3232–9.
26. Li H, Durbin R. Fast and accurate short read alignment with Burrows-Wheeler transform. Bioinformatics. 2009;25(14):1754–60.
27. Kent WJ. BLAT--the BLAST-like alignment tool. Genome Res. 2002;12(4):656–64. 28. Nicorici D, Satalan M, Edgren H, Kangaspeska S, Murumagi A, Kallioniemi
O,Virtanen S, Kilkku O et al. FusionCatcher - a tool for finding somatic fusion genes in paired-end RNA-sequencing data. bioRxiv 011650. 2014.https:// doi.org/10.1101/011650.
29. Langmead B, Salzberg SL. Fast gapped-read alignment with Bowtie 2. Nat Methods. 2012;9(4):357–9.
30. Li Y, Chien J, Smith DI, Ma J. FusionHunter: identifying fusion transcripts in cancer using paired-end RNA-seq. Bioinformatics. 2011;27(12):1708–10. 31. Okonechnikov K, Imai-Matsushima A, Paul L, Seitz A, Meyer TF, Garcia-Alcalde F.
InFusion: advancing discovery of fusion genes and chimeric transcripts from deep RNA-sequencing data. PLoS One. 2016;11(12):e0167417.
32. Davidson NM, Majewski IJ, Oshlack A. JAFFA: high sensitivity transcriptome-focused fusion gene detection. Genome Med. 2015;7(1):43.
33. Schulz MH, Zerbino DR, Vingron M, Birney E. Oases: robust de novo RNA-seq assembly across the dynamic range of expression levels. Bioinformatics. 2012;28(8):1086–92.
34. Wang K, Singh D, Zeng Z, Coleman SJ, Huang Y, Savich GL, et al. MapSplice: accurate mapping of RNA-seq reads for splice junction discovery. Nucleic Acids Res. 2010;38(18):e178.
35. Trapnell C, Pachter L, Salzberg SL. TopHat: discovering splice junctions with RNA-Seq. Bioinformatics. 2009;25(9):1105–11.
36. McPherson A, Wu C, Wyatt AW, Shah S, Collins C, Sahinalp SC. nFuse: discovery of complex genomic rearrangements in cancer using high-throughput sequencing. Genome Res. 2012;22(11):2250–61. 37. Melsted P, Hateley S, Joseph IC, Pimentel H, Bray N, Pachter L. Fusion
detection and quantification by pseudoalignment. bioRxiv. 2017:166322.
https://doi.org/10.1101/166322.
38. Bray NL, Pimentel H, Melsted P, Pachter L. Near-optimal probabilistic RNA-seq quantification. Nat Biotechnol. 2016;34(5):525–7.
39. Torres-Garcia W, Zheng S, Sivachenko A, Vegesna R, Wang Q, Yao R, et al. PRADA: pipeline for RNA sequencing data analysis. Bioinformatics. 2014; 30(15):2224–6.
40. Jia W, Qiu K, He M, Song P, Zhou Q, Zhou F, et al. SOAPfuse: an algorithm for identifying fusion transcripts from paired-end RNA-Seq data. Genome Biol. 2013;14(2):R12.
42. Akers NK, Schadt EE, Losic B. STAR chimeric post for rapid detection of circular RNA and fusion transcripts. Bioinformatics. 2018;34(14):2364–70. 43. Haas BJ. STAR-Fusion code and documentation on GitHub 2019. Available
from:https://github.com/STAR-Fusion/STAR-Fusion/wiki.
44. STAR-SEQR. STAR-SEQR code and documentation on GitHub 2019. Available from:https://github.com/ExpressionAnalysis/STAR-SEQR.
45. Kim D, Salzberg SL. TopHat-Fusion: an algorithm for discovery of novel fusion transcripts. Genome Biol. 2011;12(8):R72.
46. Kim D, Pertea G, Trapnell C, Pimentel H, Kelley R, Salzberg SL. TopHat2: accurate alignment of transcriptomes in the presence of insertions, deletions and gene fusions. Genome Biol. 2013;14(4):R36.
47. Haas BJ. TrinityFusion - Fusion and foreign transcript detection via RNA-seq de novo assembly 2019. Available from:https://github.com/trinityrnaseq/TrinityFusion/wiki. 48. Grabherr MG, Haas BJ, Yassour M, Levin JZ, Thompson DA, Amit I, et al.
Full-length transcriptome assembly from RNA-Seq data without a reference genome. Nat Biotechnol. 2011;29(7):644–52.
49. Wu TD, Reeder J, Lawrence M, Becker G, Brauer MJ. GMAP and GSNAP for genomic sequence alignment: enhancements to speed, accuracy, and functionality. Methods Mol Biol. 2016;1418:283–334.
50. Wu TD, Watanabe CK. GMAP: a genomic mapping and alignment program for mRNA and EST sequences. Bioinformatics. 2005;21(9):1859–75. 51. Dobin A, Gingeras TR. Mapping RNA-seq reads with STAR. Curr Protoc
Bioinformatics. 2015;51:11 4 1–9.
52. Dobin A, Gingeras TR. Optimizing RNA-Seq mapping with STAR. Methods Mol Biol. 2016;1415:245–62.
53. Haas BJ, Papanicolaou A, Yassour M, Grabherr M, Blood PD, Bowden J, et al. De novo transcript sequence reconstruction from RNA-seq using the Trinity platform for reference generation and analysis. Nat Protoc. 2013;8(8):1494–512. 54. Zhao J, Chen Q, Wu J, Han P, Song X. GFusion: an effective algorithm to
identify fusion genes from cancer RNA-Seq data. Sci Rep. 2017;7(1):6880. 55. Paciello G, Ficarra E. FuGePrior: a novel gene fusion prioritization algorithm
based on accurate fusion structure analysis in cancer RNA-seq samples. BMC Bioinformatics. 2017;18(1):58.
56. Edgren H, Murumagi A, Kangaspeska S, Nicorici D, Hongisto V, Kleivi K, et al. Identification of fusion genes in breast cancer by paired-end RNA-sequencing. Genome Biol. 2011;12(1):R6.
57. Kangaspeska S, Hultsch S, Edgren H, Nicorici D, Murumagi A, Kallioniemi O. Reanalysis of RNA-sequencing data reveals several additional fusion genes with multiple isoforms. PLoS One. 2012;7(10):e48745.
58. Maher CA, Palanisamy N, Brenner JC, Cao X, Kalyana-Sundaram S, Luo S, et al. Chimeric transcript discovery by paired-end transcriptome sequencing. Proc Natl Acad Sci U S A. 2009;106(30):12353–8.
59. Asmann YW, Hossain A, Necela BM, Middha S, Kalari KR, Sun Z, et al. A novel bioinformatics pipeline for identification and characterization of fusion transcripts in breast cancer and normal cell lines. Nucleic Acids Res. 2011;39(15):e100. 60. Surowiecki J. The wisdom of crowds : why the many are smarter than the
few and how collective wisdom shapes business, economies, societies, and nations, vol. xxi. 1st ed. New York: Doubleday; 2004. p. 296.
61. Conway JR, Lex A, Gehlenborg N. UpSetR: an R package for the visualization of intersecting sets and their properties. Bioinformatics. 2017;33(18):2938–40. 62. Haas BJ. forked and modified UpSetR code on GitHub 2019. Available from:
https://github.com/brianjohnhaas/UpSetR/tree/devel.
63. Garrett WS. Cancer and the microbiota. Science. 2015;348(6230):80–6. 64. Akram N, Imran M, Noreen M, Ahmed F, Atif M, Fatima Z, et al. Oncogenic
role of tumor viruses in humans. Viral Immunol. 2017;30(1):20–7. 65. Kim D, Song L, Breitwieser FP, Salzberg SL. Centrifuge: rapid and sensitive
classification of metagenomic sequences. Genome Res. 2016;26(12):1721–9. 66. Camacho C, Coulouris G, Avagyan V, Ma N, Papadopoulos J, Bealer K, et al.
BLAST+: architecture and applications. BMC Bioinformatics. 2009;10:421. 67. Sfanos KS, Aloia AL, Hicks JL, Esopi DM, Steranka JP, Shao W, et al.
Identification of replication competent murine gammaretroviruses in commonly used prostate cancer cell lines. PLoS One. 2011;6(6):e20874. 68. Oda T, Ikeda S, Watanabe S, Hatsushika M, Akiyama K, Mitsunobu F.
Molecular cloning, complete nucleotide sequence, and gene structure of the provirus genome of a retrovirus produced in a human lymphoblastoid cell line. Virology. 1988;167(2):468–76.
69. Nairn C, Lovatt A, Galbraith DN. Detection of infectious bovine polyomavirus. Biologicals. 2003;31(4):303–6.
70. Zhao J, Li X, Yao Q, Li M, Zhang J, Ai B, et al. RWCFusion: identifying phenotype-specific cancer driver gene fusions based on fusion pair random walk scoring method. Oncotarget. 2016;7(38):61054–68.
71. Haas BJ. Fusion Transcript Benchmarking Toolkit 2019. Available from:
https://github.com/fusiontranscripts/FusionBenchmarking/wiki. 72. Haas BJ. Fusion Transcript Simulation Toolkit 2019. Available from:https://
github.com/FusionSimulatorToolkit/FusionSimulatorToolkit/wiki. 73. EMBL-EBI. GENCODE Human Release 19 (GRCh37.p13) 2019. Available from:
https://www.gencodegenes.org/human/release_19.html.
74. Li B, Dewey CN. RSEM: accurate transcript quantification from RNA-Seq data with or without a reference genome. BMC Bioinformatics. 2011;12:323. 75. "EMBL-EBI". E-MTAB-513 - RNA-Seq of human individual tissues and mixture
of 16 tissues (Illumina Body Map) 2019. Available from:https://www.ebi.ac. uk/arrayexpress/experiments/E-MTAB-513/.
76. Barretina J, Caponigro G, Stransky N, Venkatesan K, Margolin AA, Kim S, et al. The Cancer Cell Line Encyclopedia enables predictive modelling of anticancer drug sensitivity. Nature. 2012;483(7391):603–7.
77. Haas BJ. Simulated Fusion Benchmarking Data 2019. Available from:https:// data.broadinstitute.org/Trinity/CTAT_FUSIONTRANS_BENCHMARKING/on_ simulated_data/.
78. Haas BJ. Cancer Cell Line Fusion Benchmarking Data 2019. Available from:
https://data.broadinstitute.org/Trinity/CTAT_FUSIONTRANS_BENCHMARKING/ on_cancer_cell_lines/.
79. Davis JaG M. The relationship between precision-recall and ROC curves. In: Proceedings of the 23rd International Conference on Machine Learning; 2006.
80. nFuse-wiki. nfuse - GettingStarted.wiki 2019. Available from:https://code. google.com/archive/p/nfuse/wikis/Tutorial.wiki.
81. Haas BJ. Trinity Cancer Transcriptome Analysis Toolkit 2019. Available from:
https://github.com/NCIP/Trinity_CTAT/wiki.
82. Haas BJ. FusionAnnotator 2019. Available from:https://github.com/ FusionAnnotator/FusionAnnotator/wiki.
83. Haas BJ. CTAT_HumanFusionLib 2019. Available from:https://github.com/ FusionAnnotator/CTAT_HumanFusionLib/wiki.
84. Haas BJ. FusionFilter 2019. Available from:https://github.com/FusionFilter/ FusionFilter/wiki.
85. Haas BJ. Docker image used for STAR-Fusion: docker pull trinityctat/ ctatfusion:1.5.0 2018. Available from:https://hub.docker.com/r/trinityctat/ ctatfusion.
86. Haas BJ. DISCASM: Discordant and Unmapped Read De Novo
Transcriptome Assembly 2019. Available from:https://github.com/DISCASM/ DISCASM/wiki.
87. Haas BJ. GMAP-fusion 2019. Available from: https://github.com/GMAP-fusion/GMAP-fusion/wiki.
88. Haas BJ. TrinityFusion software code and documentation on GitHub 2019. Available from:https://github.com/trinityrnaseq/TrinityFusion/wiki. 89. Haas BJ. TrinityFusion Docker image used from DockerHub: docker pull
trinityctat/trinityfusion:0.2.0 2019. Available from:https://hub.docker.com/r/ trinityctat/trinityfusion.
90. "Mitelman F JBaMFE. Mitelman Database of Chromosome Aberrations and Gene Fusions in Cancer 2019. Available from:http://cgap.nci.nih.gov/ Chromosomes/Mitelman.
91. Kim P, Yoon S, Kim N, Lee S, Ko M, Lee H, et al. ChimerDB 2.0--a knowledgebase for fusion genes updated. Nucleic Acids Res. 2010; 38(Database issue):D81–5.
92. Forbes SA, Beare D, Boutselakis H, Bamford S, Bindal N, Tate J, et al. COSMIC: somatic cancer genetics at high-resolution. Nucleic Acids Res. 2017;45(D1): D777–D83.
93. "Wellcome Sanger Institute". COSMIC Catalogue of Somatic Mutations in Cancer 2019. Available from:https://cancer.sanger.ac.uk/cosmic. 94. Alaei-Mahabadi B, Bhadury J, Karlsson JW, Nilsson JA, Larsson E.
Global analysis of somatic structural genomic alterations and their impact on gene expression in diverse human cancers. Proc Natl Acad Sci U S A. 2016;113(48):13768–73.
95. Klijn C, Durinck S, Stawiski EW, Haverty PM, Jiang Z, Liu H, et al. A comprehensive transcriptional portrait of human cancer cell lines. Nat Biotechnol. 2015;33(3):306–12.
96. Greger L, Su J, Rung J, Ferreira PG, Geuvadis C, Lappalainen T, et al. Tandem RNA chimeras contribute to transcriptome diversity in human population and are associated with intronic genetic variants. PLoS One. 2014;9(8):e104567.
98. "Laboratory for Integrated Bioinformatics R, Japan",. ConjoinG: Database of Conjoined Genes 2018. Available from:https://metasystems.riken.jp/ conjoing/index.
99. Biogenouest. Duplicated Genes Database 2010. Available from:http://dgd. genouest.org/.
100. ebi.ac.uk. Human gene families 2017. Available from:ftp://ftp.ebi.ac.uk/pub/ databases/genenames/genefam_list.txt.gz.
Publisher’s Note