R E S E A R C H
Open Access
Gene duplication and evolution in recurring
polyploidization
–
diploidization cycles in
plants
Xin Qiao
1, Qionghou Li
1, Hao Yin
1, Kaijie Qi
1, Leiting Li
1, Runze Wang
1, Shaoling Zhang
1*and Andrew H. Paterson
2*Abstract
Background:
The sharp increase of plant genome and transcriptome data provide valuable resources to investigate
evolutionary consequences of gene duplication in a range of taxa, and unravel common principles underlying
duplicate gene retention.
Results:
We survey 141 sequenced plant genomes to elucidate consequences of gene and genome duplication,
processes central to the evolution of biodiversity. We develop a pipeline named
DupGen_finder
to identify different
modes of gene duplication in plants. Genes derived from whole-genome, tandem, proximal, transposed, or dispersed
duplication differ in abundance, selection pressure, expression divergence, and gene conversion rate among genomes.
The number of WGD-derived duplicate genes decreases exponentially with increasing age of duplication events
—
transposed
duplication- and dispersed duplication-derived genes declined in parallel. In contrast, the frequency of tandem and proximal
duplications showed no significant decrease over time, providing a continuous supply of variants available for adaptation to
continuously changing environments. Moreover, tandem and proximal duplicates experienced stronger selective pressure than
genes formed by other modes and evolved toward biased functional roles involved in plant self-defense. The rate of gene
conversion among WGD-derived gene pairs declined over time, peaking shortly after polyploidization. To provide a platform for
accessing duplicated gene pairs in different plants, we constructed the Plant Duplicate Gene Database.
Conclusions:
We identify a comprehensive landscape of different modes of gene duplication across the plant kingdom by
comparing 141 genomes, which provides a solid foundation for further investigation of the dynamic evolution of duplicate
genes.
Keywords:
Gene duplication, Evolution, Polyploidization, Gene conversion, Plant
Background
The finding that the first fully sequenced eukaryote
gen-ome, that of the budding yeast (Saccharomyces
cerevi-siae) [1], had experienced whole-genome duplication
(WGD, or defined as polyploidization) [2] invigorated
re-search into this evolutionary mechanism of central
im-portance. The otherwise compact ciliate (Paramecium
tetraurelia) genome (72 Mb) has nonetheless retained a
high number of gene sets (40,000) after at least three
successive whole-genome duplications [3–5]. The
ances-tral vertebrate is thought to have undergone two rounds
of ancient WGD (defined as 1R and 2R) at least ~ 450
million years ago (Mya) [6–8]—about 20–30% of human
genes are thought to be paralogs produced by these two
WGDs, and these
“ohnologs”
have a strong association
with human disease [7,
9]. Additional WGDs occurred
in the common ancestor of teleost fish (3R, ~ 320 Mya)
[10,
11] and salmonids including the rainbow trout
(On-corhynchus mykiss) and Atlantic salmon (Salmo salar)
(4R) dated to ~ 80 Mya [12,
13]. The most recent
gen-ome duplication currently known in vertebrates has been
uncovered in the common carp (Cyprinus carpio) (4R,
~ 8.2 Mya) [14,
15].
* Correspondence:[email protected];[email protected]
1
Centre of Pear Engineering Technology Research, State Key Laboratory of Crop Genetics and Germplasm Enhancement, Nanjing Agricultural University, Nanjing 210095, China
2Plant Genome Mapping Laboratory, University of Georgia, Athens, GA
30605, USA
In contrast with fungi and animals, the most frequent
occurrence of paleo-polyploidization has been detected
in angiosperms, flowering plants. It has been suggested
that one to two genome duplications preceded
angio-sperm diversification [16], and only one angioangio-sperm is
known that did not experience additional WGDs,
Amborella trichopoda
[17].
Arabidopsis thaliana, chosen
to be the first fully sequenced angiosperm in part due to
its apparent genomic simplicity, is, ironically, a member
of the Brassicaceae family that is as yet unmatched in its
propensity for genome duplication—Brassica napus
has
experienced an aggregate 72× multiplication, in five
events (3 × 2 × 2 × 3 × 2) at times ranging from > 100
million to ~ 10,000 years ago [18]. A WGD series of rho
(
ρ
)–sigma (
σ
)–tau (
τ
) in Poaceae [19] echoes the
now-classic alpha (
α
)–beta (
β
)–gamma (
γ
) series in
Bras-sicaceae [20]. While most plant paleopolyploidies are
du-plications, several are triplications [21–23] and at least
one is a penta-plication [24].
Whole-genome duplication is thought to have
contrib-uted much to the evolution of morphological and
physiological diversity [25,
26]. However, WGD is often
followed by loss of most duplicated genes over a few
million years [27] and is episodic [19,
20]. Successive
WGD events are often separated by tens of millions of
years, failing to provide a continuous supply of variants
available for adaptation to continuously changing
envi-ronments. Diploidization is thought to occur
“quickly”
(i.e., in the first few million years, [27]) following WGD
to return to disomic inheritance, by genome
modifica-tions including chromosomal rearrangement, gene loss,
gene conversion, subgenome dominance, and expression
divergence between duplicate copies [28–30]. The tiny
genome (82 Mb) of bladderwort (Utricularia gibba)
which accommodates a typical number of genes for a
plant but purges almost all intergenic DNA and repeat
sequence exemplifies the extreme genome reduction or
fractionation after multiple rounds of WGD [31].
With a diploidized state restored soon after genome
duplication, what is the raw material for adaptation in
taxa that have abstained from genome duplication for
long time periods? Various types of single-gene
duplica-tion occur more or less continuously and have been
im-plicated in key environmental adaptations [32,
33], but
yield genes with short half-lives [27]. De novo gene
evo-lution, for example as a result of transposable element
activities [34], may often form fragmentary products of
uncertain function [35]. In addition to whole-genome
duplication, other modes of gene duplication are
collect-ively deemed single-gene duplications [36–38]. Single
genes can move, or be copied, from the original
chromo-somal position to a new position by various ways [39–
41]. Tandem duplicates are closely adjacent to each
other in the same chromosome, a phenomenon which is
speculated to occur through unequal crossing over [36].
Proximal duplication (PD) generates gene copies that are
near each other but separated by several genes (10 or
fewer genes), possibly through localized transposon
ac-tivities [42] or originating from ancient tandem
dupli-cates interrupted by other genes [39]. It has been
revealed that neighboring genes tend to be co-regulated,
especially tandem duplicates [43], and neighboring gene
pairs still show interchromosomal colocalization after
their separation [44]. Moreover, tandem duplicates have
been commonly found to be important for plant
adapta-tion to rapidly changing environments [45]. The
trans-posed
duplication
(TRD)
generates
a
gene
pair
comprised of an ancestral and a novel locus and is
pre-sumed to arise through distantly transposed duplications
occurred by DNA-based or RNA-based mechanisms [38,
46]. Dispersed duplication (DSD) happens through
un-predictable and random patterns by mechanisms that
re-main unclear, generating two gene copies that are
neither neighboring nor colinear [47]. The dispersed
du-plicates are prevalent in different plant genomes [48].
Herein, we exploited a pipeline incorporating syntenic
and phylogenomic approaches to identify the different
modes of gene duplication in 141 sequenced plant
ge-nomes. Duplicated genes were classified into five types,
including whole-genome duplication, tandem
duplica-tion (TD), proximal duplicaduplica-tion, transposed duplicaduplica-tion,
and dispersed duplication. Integrated large-scale genome
and transcriptome datasets were used to investigate
se-lection pressures, expression divergence, and gene
con-version underlying duplicate gene evolution. In addition,
construction of gene families using all genes from 141
plant genomes suggested 232 families most widely
pre-served across the plant kingdom. The results of this
study lay a substantial foundation for further
investigat-ing the contributions of gene duplication to gene
regulatory network evolution, epigenetic variation,
mor-phological complexity, and adaptive evolution in plants.
Results
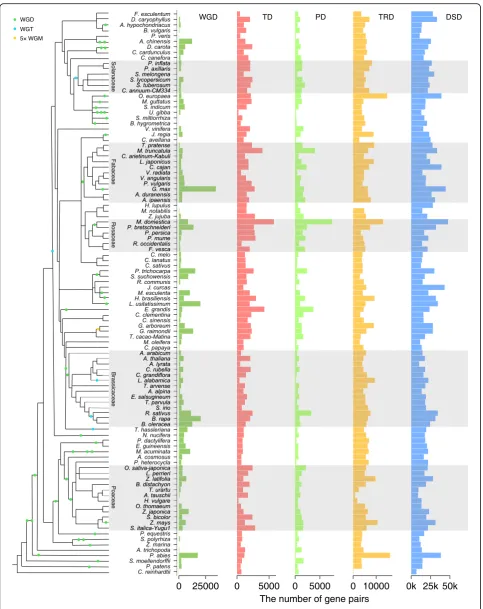
The landscape of gene duplication in the plant kingdom
In 141 sequenced plant genomes, we identified duplicated
genes using
DupGen_finder
(freely available at
https://
github.com/qiao-xin/DupGen_finder) and classified them
into one of the five categories (Additional file
1: Figure S1
and Additional file
2), being derived from WGD, TD, PD,
TRD, and DSD. The number of duplicate gene pairs for
each category in each taxon was determined (Fig.
1
and
Additional
file
3).
The
higher
percentages
of
WGD-derived gene pairs were detected in plants
experi-encing more recent WGDs such as soybean (Glycine max,
~ 13 Mya) and flax (Linum usitatissimum, 3.7~6.8 Mya).
Interestingly, the highest frequency of whole-genome
trip-lication
(WGT)
occurred
in
plants
belonging
to
Brassicaceae such as cabbage (Brassica oleracea), radish
(Raphanus sativus), and
Leavenworthia alabamica. In
addition, the occurrence of genome duplication is
fre-quent in some individual plants such as kiwifruit
(Actini-dia chinensis, two rounds of WGD), carrot (Daucus
carota, a WGT (Dc-
β
) and a WGD (Dc-
α
)), and banana
(Musa acuminata, three rounds of WGD). Larger
per-centages of WGD-derived gene pairs are still maintained
in the aforementioned species although genome
fraction-ation occurred quickly after genome duplicfraction-ation. To
pro-vide a platform for accessing and searching duplicated gene
in 141 sequenced plants, we constructed a public database
named Plant Duplicate Gene Database (PlantDGD, freely
available at
http://pdgd.njau.edu.cn:8080).
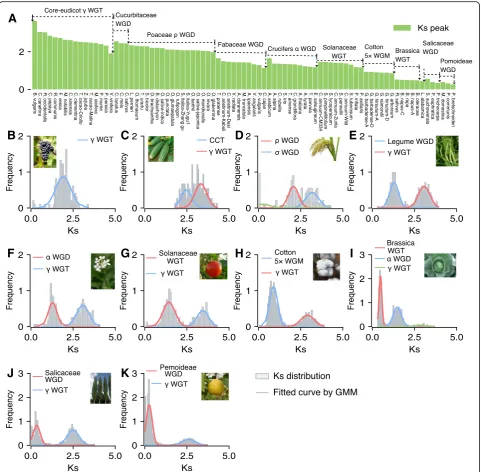
Identifying
K
speaks corresponding to genome
duplication events of different ages in each species
The most recent and more ancient genome duplication
events that affect each of the taxa were identified
(Additional file
4). To identify the most recent and more
ancient
K
speaks (or WGDs) in each species, we
esti-mated the mean
K
svalues for the gene pairs contained
in each syntenic block within a species, and in addition,
the
K
sdistribution was fitted using Gaussian mixture
models (GMM) (the code is freely available at
https://
github.com/qiao-xin/Scripts_for_GB).
Ranges of
K
svalues for estimates of individual genome
duplication events (e.g.,
γ
WGT in core eudicots) from
different taxa reflect substantial divergence in
evolution-ary rates (clock-like rates, substitutions/synonymous
site/year) in specific lineages (Fig.
2
and Additional file
4).
There are 16 species which have not been influenced by
recent genome duplication event but share the core
eudicot
γ
WGT events. The
K
speaks corresponding to
the
γ
WGT from these 16 taxa range from 1.91 to 3.64
(Fig.
2a). For example, we detected strong signal of
γ
WGT in grape (Vitis vinifera) (Fig.
2b). The
K
svalues
corresponding to the cucurbit-common tetraploidization
(CCT) range from 2.44 to 2.56. The
K
svalues
corre-sponding to the Poaceae
ρ
WGD range from 1.98 to
2.34. For example, two
K
speaks corresponding to
ρ
WGD and
σ
/
τ
WGD were detected in rice (Oryza
sativa) (Fig.
2d). The
K
svalues corresponding to the
Fabaceae common WGD range from 1.13 to 1.66. The
K
svalues corresponding to the Brassicaceae
α
/
β
WGD
range from 1.18 to 1.66. For example, two
K
speaks
cor-responding to
α
/
β
WGD and
γ
WGT were fitted by a
GMM method in
Arabidopsis
(Fig.
2f ). The
K
svalues
corresponding to the Solanaceae common WGT range
from 1.17 to 1.46. The
K
svalues corresponding to the
cotton 5× WGM (whole-genome multiplication) range
from 0.86 to 0.93. The
K
svalues corresponding to the
Brassica common WGT range from 0.48 to 0.52. For
ex-ample, three
K
speaks corresponding to Brassica WGT,
α
/
β
WGD, and
γ
WGT respectively, were fitted in
Bras-sica oleracea
(Fig.
2i). The
K
svalues corresponding to
the Salicaceae common WGD range from 0.34 to 0.56.
The
K
svalues corresponding to the Pomoideae WGD
range from 0.27 to 0.39.
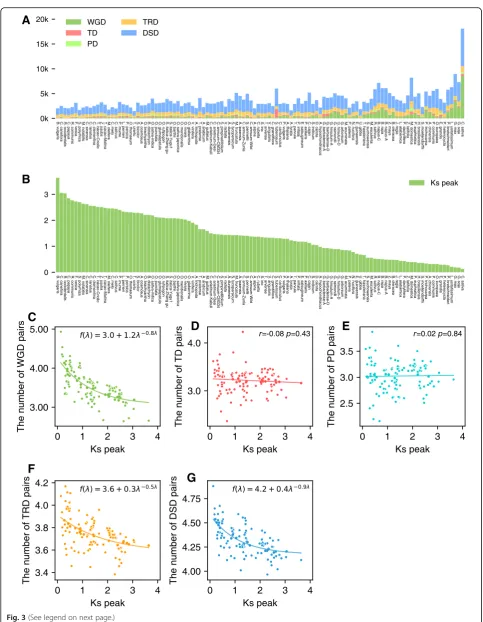
Dynamic changes in abundance of duplicated genes over
time
The most recent
K
speaks were used to determine the
order in which the taxa are shown in Fig.
3a (types of
gene duplications). Genomes with abnormal
K
speaks
were not included in Fig.
3a because fragmented
assem-bly hindered the identification of large syntenic blocks.
We detected whole-genome duplication in all plant
ge-nomes investigated except for several with highly
frag-mented assemblies such as Hop (Humulus lupulus) and
European hazelnut (Corylus avellana). The
K
svalues for
duplication events show a steady decline with decreasing
antiquity (Fig.
3b), as expected.
Linear regression between the number of each type of
duplicated gene pair and the
K
speaks from different
taxa showed that the number of gene pairs derived from
WGD generally declines with increasing antiquity of
du-plication events (r
=
−
0.45,
P
< 0.001, Additional file
1:
Figure S2A), although again with substantial fluctuation
among taxa (Fig.
3a). Paralleling the decline in
WGD-derived gene pairs with increasing antiquity is
de-creases
in
TRD-derived
(r
=
−
0.50,
P
< 0.001)
or
DSD-derived gene pairs (r
=
−
0.57,
P
< 0.001)
(Add-itional file
1: Figure S2D and E). Tandem and proximal
duplicate pairs show a nominal (nonsignificant) decrease
(r
=
−
0.11,
P
= 0.25 and
r
=
−
0.10,
P
= 0.28)
(Add-itional file
1: Figure S2B and C).
Further, the absolute number of duplicate gene pairs
for each category in each taxon was converted to
log10-transformed number to mitigate the effect of
gen-ome size and total gene number variation among taxa.
Linear regression between the log10-transformed
num-ber of each type of duplicated gene pair and the
K
speaks
from different taxa strongly supported that the number
of duplicated gene pairs derived from WGD (r
=
−
0.70,
P
< 0.001), TRD (r
=
−
0.49,
P
< 0.001), and DSD (r
=
−
(See figure on previous page.)
Fig. 1The number of gene pairs derived from different modes of duplication in representative plant genomes. WGD whole-genome duplication, TD tandem duplication, PD proximal duplication, TRD transposed duplication, DSD dispersed duplication. A schematic diagram of phylogeny of different plant species [231–233] and the WGDs occurred in different branches were labeled. Branch length is not directly proportional to time scale. WGT whole-genome triplication, WGM whole-genome multiplication
0.61,
P
< 0.001) significantly declines with increasing
an-tiquity of duplication events (Additional file
1: Figure
S3A, D and E). However, the number of tandem and
proximal duplicates showed no significant decrease over
time (r
=
−
0.08,
P
= 0.43 and
r
= 0.02,
P
= 0.84) and may
provide a continuous supply of genes potentially useful
for plant adaptation. Moreover, the exponential fit was
performed between log10-transformed numbers (y
axis)
and
K
speaks (x
axis). The number of WGD-derived
pairs decreases exponentially with increasing antiquity of
duplication events (Fig.
3c). The chi-squared goodness
of fit test supports this observation (or null hypothesis)
(
χ
2 = 2.33,
P
= 1.0). Exponential decrease of number of
duplicated genes over time was also found in TRD- and
DSD-derived duplicate genes (
χ
2 = 0.47,
P
= 1.0 and
χ
2 =
0.37,
P
= 1.0) (Fig.
3f, g). Significant exponential decay
B
A
C
D
E
F
G
J
K
H
I
Fig. 2Lineage-specific genome duplication events.aThe genome duplication events identified in different lineages. A range ofKsvalues for estimates of
individual genome duplication events from different taxa. TheKsdistribution in each species was fitted using Gaussian mixture models (GMM). TheKs
peaks corresponding to core eudicotγWGT, cucurbit-common tetraploidization (CCT), PoaceaeρWGD, Fabaceae common WGD, BrassicaceaeαWGD, Solanaceae WGT, cotton 5× WGM, Brassica WGT, Salicaceae WGD, and Pomoideae WGD were respectively detected inVitis vinifera(b),Cucumis sativus(c),
[image:5.595.58.540.87.559.2]A
B
C
D
F
G
E
Fig. 3(See legend on next page.)
[image:6.595.56.540.81.704.2]was not found in TD- and PD-derived duplicate genes
(Fig.
3d, e).
To investigate whether results of the
aforemen-tioned linear regression analyses have bias due to
some individual genome duplication events being
shared among different taxa, we undertook new
ana-lyses using only one that sampled each of the most
recent genome duplication events (Fig.
2, noting that
ancient events were unavoidably shared across
spe-cies). The results from this new analysis supported
that the number of duplicated gene pairs derived
from WGD (r
=
−
0.39,
P
< 0.05), TRD (r
=
−
0.46,
P
<
0.001), and DSD (r
=
−
0.56,
P
< 0.001) declines
sig-nificantly with increasing antiquity of duplication
events (Additional file
1: Figure S4A, D and E). The
number of tandem and proximal duplicates showed
no significant decrease over time (r
=
−
0.22,
P
= 0.17
and
r
=
−
0.23,
P
= 0.16) (Additional file
1
:
Figure S4B
and
C).
Linear
regression
analysis
using
the
log10-transformed number of each type of duplicated
gene pair also supported our prior observation
(Additional file
1: Figure S5).
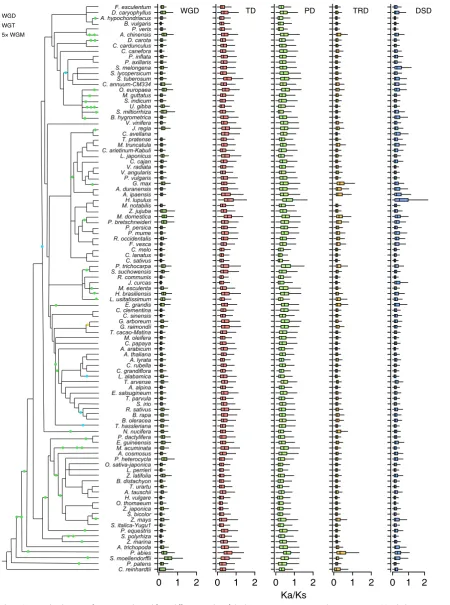
Evolutionary forces inferred to affect duplicated genes
The
K
a(number of substitutions per nonsynonymous
site),
K
s(number of substitutions per synonymous site),
and
K
a/K
svalues were estimated for gene pairs
gener-ated by different modes of duplication. We compared
the
K
a,
K
s, and
K
a/K
sdistributions across 141 plants
(Fig.
4
and Additional file
1: Figure S6 and S7). The
K
a/
K
sratios among different modes of gene duplications
showed a striking trend, with tandem and proximal
du-plications having qualitatively higher
K
a/K
sratios than
other modes. The TD- and PD-derived gene pairs have
relatively smaller
K
svalues (Additional file
1: Figure S7).
This finding suggests that tandem and proximal
duplica-tions of younger age that have been preserved have
ex-perienced more rapid sequence divergence than other
gene classes, although concerted evolution may also
pre-serve homogeneity of TD or PD genes to a greater
de-gree than genes that are not located near one another.
In contrast, WGD genes are more conserved with
smaller
K
a/K
sratios.
We further explored the roles of purifying selection
(K
a/K
s< 1) and positive selection (K
a/K
s> 1) in the
evolution of duplicated genes in seven model plants,
in-cluding
Arabidopsis thaliana
(eudicots),
Oryza sativa
(monocots),
Amborella trichopoda
(angiosperm,
Ambor-ellales),
Picea abies
(Norway spruce, gymnosperms),
Selaginella moellendorffii
(Lycophytes),
Physcomitrella
patens
(Bryophytes), and
Chlamydomonas reinhardtii
(Chlorophytes). The majority of duplicated genes evolve
under purifying selection (K
a/K
s< 1)
(
Additional file
1:
Table S1 and Figure S8-S14). In
Arabidopsis, 100%
WGD-, 96.5% TD-, 94.9% PD-, 99.7% TRD-, and 99.3%
DSD-derived duplicate genes experienced purifying
se-lection, while only 0.0–5.1% of duplicated genes show
evidence of positive selection (Additional file
1: Figure
S8). Likewise, evidence of purifying selection is found for
98.3–99.7% of duplicated genes in
O. sativa, 91.9–97.2%
in
A. trichopoda, 86.2–98.8% in
P. abies, 91.8–98.3% in
S. moellendorffii, 91.4–99.7% in
P. patens, and 95.7–
98.7% in
C. reinhardtii. Consistent with our earlier
ob-servation, tandem and proximal duplicates experienced
stronger positive selection than other modes (Fig.
4
and
Additional file
1: Table S1), reflected by the high
per-centages of gene pairs showing
K
a/K
s> 1 in
Arabidopsis
(PD (5.1%) > TD (3.3%) > DSD (0.6%) > TRD (0.3%) >
WGD (0.0%)) and other model plants. This finding
sug-gests that tandem and proximal duplication is an
im-portant source of genetic material for evolving new
functions.
Does stronger selective pressure drive the evolution of
tandem and proximal duplicates toward specific
bio-logical functions? To answer this question, we
per-formed GO enrichment analysis to investigate the
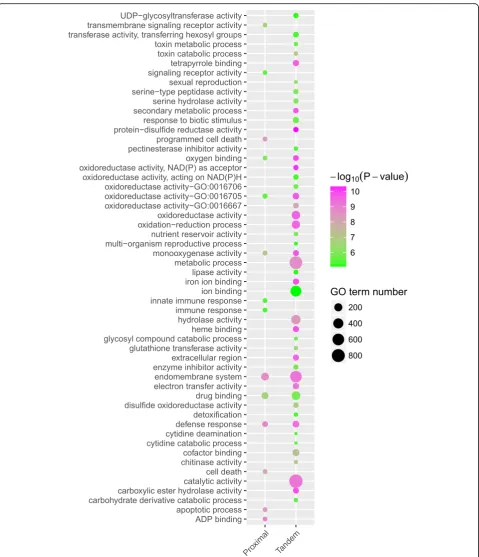
functional roles of tandem and proximal genes in the
model plant
A. thaliana, given its high-quality genome
annotation and extensive functional analysis. Tandem
and proximal duplicates exhibited divergent functional
roles although they shared several enriched GO terms
involved in defense response, drug binding,
endomem-brane system, monooxygenase activity, oxidoreductase
activity, and oxygen binding, which are critical for plant
self-defense and adaptation (Additional file
5). In
par-ticular, proximal duplicates are enriched in GO terms
in-volved in apoptotic processes, cell death, programmed
cell death, immune response, and signaling receptor
ac-tivity. Tandem duplicates are enriched in GO terms
in-volved in
“binding,”
such as tetrapyrrole binding, iron
(See figure on previous page.)
Fig. 3Changes in abundance of different modes of duplicated gene pairs over time.aThe distribution of number of gene pairs derived from different modes of duplication in 141 plant genomes. Genomes with abnormalKspeaks because fragmented assembly hindered the identification of large syntenic
blocks were not included.bThe fittedKspeak corresponding to the most recent WGD for each species.c–gThe relationship between the
log10-transformed number of different types of gene pairs andKspeak of WGD genes from different taxa, excluding those taxa with abnormalKspeaks due to
Fig. 4TheKa/Ksratio distributions of gene pairs derived from different modes of duplication in representative plant genomes. WGD whole-genome
duplication, TD tandem duplication, PD proximal duplication, TRD transposed duplication, DSD dispersed duplication
[image:8.595.84.535.91.697.2]ion binding, heme binding, and cofactor binding, and
“activity”
such as transferase activity, hydrolase activity,
electron transfer activity, and catalytic activity (Fig.
5).
Expression divergence between duplicated genes
Large-scale RNA-seq data from different tissues,
devel-opment stages, and treatments are available for a range
of plant taxa (Additional file
6). Here, we investigated
patterns of expression divergence between duplicated
genes in eight model plants for WGD, tandem, proximal,
transposed, and dispersed gene pairs. Log10-transformed
TPM (transcripts per million) values were used as a
proxy for expression levels. For duplicated pairs in which
both gene copies are expressed in at least one tissue or
condition, Pearson’s correlation coefficient (r) was
calcu-lated between the expression profiles of the two genes,
also calculating
r
for 10,000 randomly selected gene
pairs for each species. The 95% quantile in the
r
value
distribution for random gene pairs was taken as the
sig-nificance threshold for determining that two gene copies
of a duplicated pair have diverged in expression
(Add-itional file
1: Figures S15 and S16). The results showed
diverged expression profiles (Fig.
6a–h) for 87%, 66%,
80%, 81%, 84%, 66%, 85%, and 71% of WGD-derived
gene pairs in
C. reinhardtii
(Chlorophytes),
P. patens
(Bryophytes),
S. moellendorffii
(Lycophytes),
P. abies
(Norway spruce, gymnosperms),
A. trichopoda
(angio-sperm, Amborellales),
O. sativa
(monocots),
N. nucifera
(eudicots, Proteales), and
A. thaliana
(eudicots),
respect-ively. Similarly, 63–85% TD-, 76–85% PD-, 73–92%
TRD-, and 74–88% DSD-derived pairs showed
expres-sion divergence.
Furthermore, we investigated expression divergence
be-tween duplicated genes after genome duplication or
tripli-cation events of different ages in strategically chosen
monocots and eudicots. Grasses share sigma WGD (
σ
,
100~120 Mya) and tau WGD (
τ
, 110~135 Mya) with
A.
comosus
(not including the angiosperm-wide event and
beyond) [49]. After divergence from the lineage of
A.
comosus, the common ancestor of grasses including
S.
bi-color,
O. sativa, and
Z. mays
experienced rho WGD (
ρ
,
95~115 Mya) [50]. In addition,
Z. mays
experienced an
additional species-specific event (mWGD, ~ 26 Mya) [50].
Brassicaceae share core eudicot gamma WGT events (
γ
,
~ 117 Mya) with
V. vinifera
[23]. After divergence with
V.
vinifera, the common ancestor of Brassicaceae including
Arabidopsis,
B. oleracea
and
C. sativa
experienced alpha
WGD (
α
, ~ 35 Mya) [21] and beta WGD (
β
, 50~60 Mya)
[16,
51]. Following Brassicaceae diversification,
B. oleracea
and
C. sativa
independently experienced species-specific
genome triplication events, at ~ 15.9 Mya [21] and ~ 5.41
Mya [52] respectively.
Eudicots
C. sativa,
B. oleracea
(cabbage), and
V.
vinif-era
(grape) have been influenced by three different ages
of whole-genome triplication, estimated to have
oc-curred at ~ 5.41 [52], ~ 15.9 [21], and ~ 117 [23] Mya
re-spectively. The proportion of WGD-pairs with divergent
expression in these three plants increases with the time
after duplication from 43 to 86% (P
< 0.001, Fisher’s
exact test) (Fig.
6n), with > 50% of WGD-pairs still
un-differentiated in expression ~ 5.41 My after duplication.
Monocots
Z. mays
(maize),
S. bicolor
(sorghum), and
A.
comosus
(pineapple)
also
offer
stratified
ages
of
whole-genome duplication, at ~ 26 [50], 95~115 [50],
and 100~120 [49] Mya respectively. The proportion of
WGD-pairs with divergent expression in these three
plants increases from 50 to 77% (P
< 0.001, Fisher’s exact
test) (Fig.
6l), with 50% of WGD-pairs showing
undiffer-entiated expression after ~ 26 My.
Moreover, the model plant
Arabidopsis
alone provided
three genome duplications: alpha (
α
), beta (
β
), and
gamma (
γ
). The proportion of gene pairs with divergent
expression from these three WGD events increases from
65 to 84% (P
< 0.001, Fisher’s exact test) (Fig.
6k). The
cereal crop rice provided two rounds of genome
duplica-tion, rho (
ρ
) and sigma (
σ
). The proportion of gene pairs
with divergent expression from these two WGD events
increases from 63 to 74% (P
< 0.05, Fisher’s exact test)
(Fig.
6i). These results indicated that WGD-derived gene
pairs show gradually increasing expression divergence
with age.
The rate of gene conversion between WGD-derived
paralogs declined over time
We investigated the gene conversion rates of duplicated genes
derived from Brassicaceae
α
WGD and Poaceae
ρ
WGD over
evolutionary time (Fig.
7). Firstly, high-confidence
α
WGD-de-rived gene pairs from
A. thaliana
were retrieved from a
previ-ous report [20]. The gene conversion rates after divergence
between the
A. thaliana
lineage and those of
Aethionema
ara-bicum,
Eutrema salsugineum,
Capsella rubella, or
Arabidopsis
lyrata
were examined respectively.
K
swas used as a proxy for
evolutionary time. Brassicaceae
α
WGD has been dated to ~
35 Mya [21]. In this study, the average of a range of
K
svalues
for estimates of the Brassicaceae
α
WGD event from different
Brassicaceae plants is approximately 1.3. To estimate the time
of speciation, we calculated the mean
K
svalues for the gene
pairs contained in each syntenic block between the
Arabidop-sis
lineage and each outgroup species, and further, the
K
sdis-tribution was fitted using Gaussian mixture models (GMM)
(Additional file
1: Figures S17 and S18). The divergence
be-tween the
Arabidopsis
lineage and
A. arabicum
occurred
shortly after
α
WGD and dated to
K
s= 1.0. The divergences
than the number after the divergence of
Arabidopsis
and
A.
lyrata
(Fig.
7a, b). This result indicated that gene conversion
was extensive shortly after polyploidization and declined over
time, a result that has been strongly supported by independent
evidence [53]. Moreover, the gene conversion rates after
diver-gence between
Oryza sativa
L. (ssp. japonica) lineage and
Fig. 5Functional enrichment analysis of tandem and proximal duplicates inArabidopsis. The enriched GO terms with correctedPvalue < 0.01 are presented. The color of circle represents the statistical significance of enriched GO terms. The size of the circles represents the number of occurrences of a GO term [image:10.595.59.539.85.643.2]A
D
E
B
C
F
G
H
I
J
K
L
M
N
[image:11.595.57.541.86.653.2]those of
Sorghum bicolor
,
Brachypodium distachyon,
Leersia
perrieri, or
Oryza sativa
L. (ssp. indica) were examined, using
high-confidence Poaceae
ρ
WGD-derived gene pairs from
O.
sativa-japonica [54]. The divergence between
O.
sativa-japo-nica lineage and
S. bicolor
,
B. distachyon,
L. perrieri, or
O.
sati-va-indica were respectively dated to
K
s= 1.4, 1.2, 0.7, and 0.4.
The rate of gene conversion events among
ρ
WGD-derived
gene pairs decelerated over time compared with shortly after
WGD. The number of gene conversion events is 58 after the
divergence of
O. sativa-japonica and
S. bicolor, about fivefold
higher than the number after the (much more recent)
diver-gence of
O. sativa-japonica and
O. sativa-indica (Fig.
7c, d).
The proportion of tandem or proximal gene pairs
experi-encing gene conversion is more than that for other modes
of gene duplication for model plants
Arabidopsis
and rice
(Fig.
7e, f). In
Arabidopsis, the percentage of converted
TD-, PD-, TRD-, DSD-, and WGD-pairs is 20.6%, 0.0%,
0.5%, 2.4%, and 8.8% respectively. In rice, the percentage of
converted TD-, PD-, TRD-, DSD-, and WGD-pairs is
23.0%, 17.5%, 0.6%, 2.2%, and 6.7% respectively. Rare gene
conversion events were found in TRD-derived gene pairs,
consistent with extensive sequence and expression
diver-gence between TRD-duplicated genes.
Inferring core gene families from 141 green plant
genomes
The whole-genome protein sequences of 141 green plants
containing 4,921,214 genes were used to construct core gene
families by using OrthoFinder [55]. Large-scale BLASTP
searches were carried out for each pair of 141 species. We
A
C
D
E
F
B
Fig. 7Factors affecting gene conversion rates in plants.a,bGene conversion rates after divergence between theA. thalianalineage and those of
Aethionema arabicum,Eutrema salsugineum,Capsella rubella, orA. lyrata, respectively.c,dGene conversion rates after divergence between theO. sativaL. (ssp. japonica) lineage and those ofSorghum bicolor,Brachypodium distachyon,Leersia perrieri, orO. sativaL. (ssp. indica), respectively.e,fThe frequency of gene conversion events for different modes of duplicated gene pairs in model plantsArabidopsis(e) and rice (f). *O. sativaL. (ssp. indica). WGD whole-genome duplication, TD tandem duplication, PD proximal duplication, TRD transposed duplication, DSD dispersed duplication
[image:12.595.57.537.87.485.2]identified 86,831 gene families (or orthologous groups)
(freely available at figShare,
https://doi.org/10.6084/m9.fig
share.7264667.v1), including 4,333,638 (88.1%) genes, 6266
(18,889 genes, 0.4% of all genes) species-specific families, and
232 most conserved families (Additional file
7) in which all
species have at least one gene. We found no strict
single-copy gene families for these 141 species, which may
be due to errors in genome annotation, frequent single-gene
duplication, or pseudogenization. We further identified the
most-preserved, intermediate-preserved, and least-preserved
gene families in 141 plants. The most-preserved plant gene
families are those orthologous groups in which all species
must have at least one gene. The intermediate-preserved
gene families are those orthologous groups in which the
ab-sence (or missing) of orthologous genes in up to three
spe-cies was allowed. The least-preserved gene families are those
orthologous groups in which the absence of orthologous
genes in up to five species was allowed. Functional
enrich-ment analysis for most-preserved, intermediate-preserved,
and least-preserved plant gene families using
Arabidopsis
genes as a reference revealed that these genes were
collect-ively enriched in GO terms involved in
“membrane”
and
“or-ganelle”
such as plasma membrane, organelle part, nucleus,
membrane
−
bounded organelle, intracellular organelle, and
cytoplasmic part (Additional file
1: Figure S19 and
Add-itional file
8). In addition, the enriched GO terms are also
collectively involved in small GTPase-mediated signal
trans-duction, nucleosome, cytoskeletal, light-harvesting complex,
ATPase activity, actin filament-based movement.
We further assigned the genes in each orthogroup into
each single species and acquired the repertoire of gene
fam-ilies for each species (freely available on FigShare, DOI:
https://doi.org/10.6084/m9.figshare.7264667). For each
spe-cies, we calculated the percentage of gene families of a given
size with respect to the total number of all gene families in
this species, then investigated the distribution of gene family
size in all plants (Fig.
8). A large percentage of small gene
families (one to three members) were observed across all
plants, showing a strong bias toward single-copy status. In
green algae, the majority of gene families contained only one
gene. For example, in
C. reinhardtii, the proportion of
single-gene families is 81.4%. The highest proportion (95.8%)
of single-copy gene families was found in the marine
angio-sperm
Zostera marina, forming a sharp contrast with closely
related
Z. muelleri
with only 20.6% single-copy gene families.
Species influenced by recent WGD or WGT, such as
soy-bean (Glycine max), apple (Malus domestica), flax (L.
usita-tissimum), banana (Musa acuminata), and maize (Z. mays),
possess more gene families of moderate number than other
plants.
Discussion
Classification and comparison of the five major types of
gene duplication in 141 plant genomes affected by a
diverse set of whole-genome multiplications spanning
more than 100 million years provides new insight into
genome evolution and biological innovation.
Whole-gen-ome duplication increases all genes in a genWhole-gen-ome in a
bal-anced manner that may favor modification of entire
pathways and processes [56] and is associated with
lon-ger half-lives of the resulting gene duplicates [27].
How-ever, it is unclear whether these advantages outweigh the
relatively constant availability of new tandem and
prox-imal duplicates that may be important for plants to
adapt to dramatic environmental changes [45,
57–60].
The C4 photosynthetic pathway, thought to have been
an adaptation to hot, dry environments or CO
2defi-ciency [61–64] and independently appearing at least 50
times during angiosperm evolution [65,
66], includes
some elements resulting from WGD and others from
single-gene duplication, despite that all were in principle
available from WGD in a cereal common ancestor [33].
Indeed, we found that the
K
speaks for WGD,
trans-posed, and dispersed duplicates commonly overlapped in
the same plant, suggesting that whole-genome
duplica-tion was also accompanied by extensive transposed and
dispersed gene duplication, consistent with a recent
study showing extensive relocation of
γ
duplicates
shortly after the
γ
WGT event in core eudicots [48].
Different classes of gene duplicates showed distinct
patterns
of
temporal
and
functional
evolution.
WGD-derived duplicates are more conserved with
smaller
K
a/K
sratios than tandem and proximal
dupli-cates, suggesting that they have experienced long-term
purifying selection. Proximal and tandem duplicates
pre-served in modern genomes, with relatively high
K
a/K
sratios but relatively small
K
svalues per se, appear to
ex-perience more rapid functional divergence than other
gene classes—supporting that positive selection plays an
important role in the early stage of duplicate gene
reten-tion [67–69]. While concerted evolureten-tion may preserve
homogeneity of tandem or proximal duplicates to a
greater degree than genes that are distant from one
an-other, this is not incompatible with rapid functional
di-vergence [38].
tandem) duplications show generally less expression
di-vergence than distant duplications, a result supported by
many prior studies, e.g., [43,
44,
71–74]. Indeed,
physically linked genes in the same paralogon (or
syn-tenic block) are preferentially retained in
cis-PPIs
(pro-tein–protein interactions) after WGD [75,
76].
Fig. 8The distribution of gene family sizes across 141 plants. For each species, we calculated the percentage of gene families of a given size with respect to the total number of all gene families in this species. The top labels of thexaxis indicate the gradient of different sizes of gene family
[image:14.595.58.538.85.650.2]Two types of subfunctionalization (SF) have been
pro-posed [77–80]. One type of subfunctionalization takes
place by complementary coding sequence changes
be-tween duplicated genes, leading to their functional
diver-gence at the protein level, and eventually resulting in
division of multiple functions of the progenitor gene.
However, divergence at the biochemical level between
two copies is limited even over long evolutionary times.
The other type of subfunctionalization occurs by
com-plementary loss or degenerative mutation of
cis-regula-tory
elements
between
duplicated
genes,
creating
inter-dependence between partially degenerated copies
to maintain the full expression profiles of the ancestral
gene in different tissues and/or conditions (defined as
expression subfunctionalization (ESF)) [43,
78]. Many
previous studies revealed that expression divergence
be-tween duplicate genes often occurred quickly after gene
duplication [47,
81–84]. In this study, widespread
diver-gence between expression profiles of duplicated genes
was found in different modes of gene duplication—this
can be largely explained by the expression
subfunctiona-lization (or subfunctionasubfunctiona-lization) models, under which
two duplicate genes evolved toward the partitioning of
ancestral gene expression profiles in different tissues or
conditions. The expression neofunctionalization (ENF)
hypothesis, that one of the two gene copies gains a new
cis-regulatory element in its promoter region and
presses in a new tissue, could also result in divergent
ex-pression profiles between duplicated genes such as some
observed in this study [43,
85].
Among the earliest changes following polyploidization is
gene conversion, nonreciprocal recombination between
al-leles or paralogous loci which homogenizes paralogous
se-quences or even chromosomal regions [86–89]. Gene
conversion appears to occur virtually immediately in
syn-thetic polyploid
Arachis
(peanut) [90]—indeed, abundant
gene conversion after hybridization or polyploidization plays
an important role in maintaining genome stability in plants
and fungi [5,
18,
91,
92]. We detected relatively abundant
gene conversion events in TD-, PD-, and WGD-pairs, which
may be associated with their reduced expression divergence.
The TRD- and DSD-pairs may have escaped the constraints
induced by gene conversion. The dynamic changes of gene
conversion rate found in this study, being high shortly after
polyploidization and declining over time, show that prior
findings over about 1 MY of cotton evolution [53] are
gener-ally applicable to a wide range of taxa and polyploidization
events. The extensive gene conversion events occurring
im-mediately after gene or genome duplication homogenize
paralogs for a period of time and maintain a higher
probabil-ity of functional compensation between duplicated genes,
buffering the phenotypic effect caused by loss of one of two
members of a duplicated pair [93–95]. Evolutionary
diver-gence between duplicate genes may be suppressed by
extensive gene conversion events during the early stage of
genome duplication; however, this is not incompatible with
rapid functional divergence of the TD- or PD-derived gene
pair [96].
Conclusions
The sharp increase in the number of sequenced plant
genomes has empowered investigation of key aspects of
evolution by application of uniform techniques to taxa
spanning hundreds of million years of divergence,
in-cluding model and non-model, crop and non-crop,
flow-ering and non-flowflow-ering, seed and non-seed, vascular
and non-vascular, and unicellular and multicellular
spe-cies. Building on many studies of individual genomes,
the comprehensive landscape of different modes of gene
duplication identified across the plant kingdom by virtue
of the ability to compare 141 genomes provides a solid
foundation for further investigating the dynamic
evolu-tion and divergence of duplicate genes and for validating
evolutionary models underlying duplicate gene retention.
The contributions of gene duplication to gene regulatory
networks, epigenetic variation, morphological
complex-ity, and adaptive evolution are intriguing subjects for
further investigation by this approach.
Methods
Collecting genome datasets
In this study, the genome datasets of 141 plants were
downloaded from multiple comprehensive databases
such as Phytozome (v11), NCBI, Ensembl Plants, and
many other individual genome databases. These 141
plant genomes sample diverse taxa ranging from
unicel-lular green alga (Chlorophytes) to Bryophytes,
Lyco-phytes, gymnosperms, and angiosperms. The detailed
information of these 141 species and their data sources
can be retrieved in Additional file
2. Only the transcript
with the longest CDS was selected for further analysis
when several transcripts were available for the same
gene.
Identifying gene duplications
gene pairs were defined as non-tandem pairs separated
by 10 or fewer genes on the same chromosome. To
identify transposed duplications, WGD, tandem, and
proximal gene pairs were deducted from the whole set
of homologous gene pairs. A transposed duplicate pair
was required to meet the following criteria: one gene
existed in its ancestral locus (named the parent copy)
and the other was located in a non-ancestral locus
(transposed copy). Two types of genes can be regarded
as ancestral loci: (i) intra-species colinear genes and (ii)
inter-species colinear genes. The intra-species colinear
genes can be obtained from WGD-derived gene pairs,
which have been identified above. Inter-species colinear
genes were discerned by intergenomic synteny analysis,
executing
MCScanX
on inter-species BLASTP files
be-tween the target and outgroup genomes. The sacred
lotus (Nelumbo nucifera) and
Spirodela polyrhiza
were
respectively taken as outgroup for all eudicot plants and
all monocot plants to identify ancestral syntenic blocks.
Amborella trichopoda
was adopted as outgroup for
N.
nucifera
and
S. polyrhiza
to find ancestral syntenic
blocks. Genes located in these conserved syntenic blocks
were deemed to be ancestral loci. The rarity of syntenic
blocks between green algae (Chlorophytes), Bryophytes,
Lycophytes, and other plants hindered the identification
of
ancestral
loci
in
these
species
by
applying
inter-species synteny analysis. Therefore, we constructed
orthologous relationships among genes of these species
with large evolutionary distances to deduce the
con-served ancestral genes. To identify the ancestral loci in
P. patens
(a Bryophyte) and
S. moellendorffii
(a
Lyco-phyte), OrthoFinder [55] and whole-genome protein
se-quences were used to infer orthogroups among these
two species and five other species:
P. abies,
S. polyrhiza,
N. nucifera,
Amborella trichopoda, and
Arabidopsis
thaliana. Based on the above orthogroups, if a gene in
P. patens
or
S. moellendorffii
has an ortholog pair in at
least two other lineages, it is considered ancient and
likely to have been present in the common ancestor of
land plants. Similarly, we built the orthogroups among
eight green algae species to determine the ancestral loci
within each green algae genome. Based on the above
steps, BLASTP hits to both an ancestral and a novel
locus were defined as transposed duplications. Finally,
after removing WGD, tandem, proximal, and transposed
duplications from the whole set of homologous gene
pairs, the remaining gene pairs were classified as
dis-persed duplications. Noting that the same disdis-persed gene
may have several BLASTP hits resulting in multiple gene
pairs for one gene, we only considered the dispersed
gene pairs with highest similarity in this situation.
For gymnosperm species, we applied an alternative
method to infer gene duplications. In this study, we
ini-tially selected two reference gymnosperm species:
Picea
abies
and
Pinus taeda, both belonging to Pinaceae.
However, no or few syntenic or colinear blocks could be
detected within these two genomes due to the
fragmen-ted assembly; thus, we used an alternative strategy to
find potential duplicate gene pairs derived from WGDs.
A recent study suggested that Pinaceae lineages had
ex-perienced one ancient WGD shared with other seed
plants corresponding to a
K
speak with a median
K
s=
0.75 to 1.5 and one younger WGD in a Pinaceae
ances-tor corresponding to
K
speak with a median
K
s= 0.2 to
0.4 [98]. According to the above results, we firstly
se-lected duplicate gene pairs corresponding to these two
putative WGD peaks in the
K
sage distribution from
all-blast-all
output.
Furthermore,
we
identified
orthogroups among genes from
P. abies,
P. taeda, and
three other Pinaceae species (Pinus lambertiana,
Pseu-dotsuga menziesii, and
Picea glauca) by using the
Ortho-Finder software [55], which utilize a novel method to
infer orthogroups of protein coding genes and is suitable
for orthogroup inference from incomplete genome
as-semblies. Based on the above two steps, if each gene of a
duplicate pair from the aforementioned two
K
speaks in
P. abies
or
P. taeda
has an ortholog pair in at least two
other lineages, we assumed that this duplicate pair was
created by WGDs in a common Pinaceae ancestor rather
than independently in each lineage. By using the same
rules applied in other plants, the tandem and proximal
gene pairs were identified in
P. abies
or
P. taeda. Based
on orthogroups among five gymnosperm species, if a
gene in
P. abies
or
P. taeda
has an ortholog pair in at
least two other lineages, it is considered ancient and
likely to have been present in the common ancestor of
Pinaceae species. Then, we determined the transposed
gene pairs comprised of an ancestral and a novel locus
after excluding the WGD, tandem, and proximal gene
pairs from the population of BLASTP hits. At last, the
remaining gene pairs after removing other modes of
gene duplications from BLASTP hits were classified as
dispersed gene pairs.
Calculating
K
a,
K
s, and
K
a/
K
svalues
For each duplicate gene pair, we aligned their protein
se-quences using MAFFT (v7.402) [99] with the L-INS-i
option and converted the protein alignment into a codon
alignment using PAL2NAL [100]. Then, the resulting
codon alignment was formatted into an AXT format
using a custom Perl script.
γ
-MYN method (a modified
version of the Yang–Nielsen method) [101,
102]
incorpo-rated in KaKs_Calculator 2.0 [103] was used to calculate
K
aand
K
svalues by implementing the Tamura–Nei
model [104]. The
K
svalues > 5.0 were excluded from
further analysis due to the saturated substitutions at
syn-onymous sites [105,
106]. The pipeline used to calculate
K
aand
K
svalues is freely available on GitHub (https://
github.com/qiao-xin/Scripts_for_GB).
RNA-seq data and quantification
Single-end or paired-end RNA-seq reads were downloaded
from NCBI SRA (https://www.ncbi.nlm.nih.gov/sra). The
RNA-seq samples used in this study were documented in
Additional file
6. The raw reads were filtered using
Trimmo-matic (version 0.36) (http://www.usadellab.org/cms/?page=
trimmomatic). We filtered the raw reads according to the
following procedure: (1) removing adapters (pair-end:
ILLU-MINACLIP:TruSeq3-PE.fa:2:30:10 and single-end:
ILLUMI-NACLIP:TruSeq3-SE:2:30:10); (2) removing leading low
quality or N bases (below quality 15) (LEADING:15); (3)
re-moving trailing low quality or N bases (below quality 15)
(TRAILING:15); (4) scanning the read with a 4-base wide
sliding window, cutting when the average quality per base
drops below 15 (SLIDINGWINDOW:4:15); and (5) dropping
reads below 55 or 36 bases long (pair-end: MINLEN:55 and
single-end: MINLEN:36). Next, the abundances of
tran-scripts from RNA-Seq data were estimated using kallisto
[107]. The reference transcripts obtained from genome
an-notation files were used to build kallisto indices. Then, the
kallisto quantification algorithm was performed with default
parameters (for single-ends, -l 200 -s 20) to process either
single-end or paired-end reads, outputting the normalized
count estimates and TPM (transcripts per million) values for
each transcript. The TPM value was used as the measure of
expression level of the genes in different tissues and
conditions.
We further extracted all intergenic regions at the
whole-genome level for investigated species and
quanti-fied their expression abundances using the same
proced-ure and RNA-seq reads used for exonic regions. The
medians of the distributions of TPM values for
inter-genic sequences in different tissues and conditions are
close to 0. Therefore, we used the mean value of the
me-dians (the 50th percentile) obtained from the TPM
dis-tributions for intergenic sequences in different tissues
and conditions as the threshold of expression
(Add-itional file
1: Figure S20 and S21).
Estimating expression divergence
Duplicated gene pairs in which both gene copies were
expressed in at least one tissue or development stage
were used to calculate Pearson correlation coefficients
(r) between expression profiles of the two gene copies.
The two genes in a random pair should have unrelated
function and differential expression, so we can
deter-mine the cutoff for divergent expression by comparing
distributions of
r
values for random gene pairs to those
for duplicated gene pairs. We randomly selected 10,000
gene pairs from each species and computed
r
values
be-tween their expression profiles. We determined a cutoff
from the distribution of
r
values for random gene pairs
in each species and required that 95% of the
r
values
ob-tained from the distribution be less than this cutoff
value. The duplicated gene pairs with
r
less than this
cutoff can be considered to have diverged in expression
(Additional file
1: Figure S15 and S16).
Detecting gene conversion
The method used to detect gene conversion is as
de-scribed in former studies [89,
108,
109]. Firstly, we
iden-tified homologous gene quartets, comprised of two
paralogs in the species of interest and their respective
orthologs in outgroup species. For
Arabidopsis,
Aethio-nema arabicum,
Eutrema salsugineum,
Capsella rubella,
and
Arabidopsis lyrata
were used as outgroup species.
For rice (O. sativa
L. (ssp. japonica)),
Sorghum bicolor,
Brachypodium distachyon,
Leersia perrieri, and
Oryza
sativa
L. (ssp. indica) were used as outgroup species.
The number of homologous gene quartets identified
be-tween
Arabidopsis
and the four outgroup species
A.
ara-bicum,
E. salsugineum,
C. rubella, and
A. lyrata
are 615,
1165, 1355, and 788 respectively. The number of
hom-ologous gene quartets identified between rice and the
four outgroup species
S. bicolor,
B. distachyon,
L.
per-rieri, and
O. sativa-indica are 761, 718, 917, and 1140.
To identify the gene conversion events in different
modes of duplicated gene pairs, we chose
A. arabicum
and
S. bicolor
as outgroups for
Arabidopsis
and rice
re-spectively to determine homologous gene quartets. The
frequency of gene conversion events for different modes
of duplicated gene pairs was determined in model plants
Arabidopsis
and rice. Then, we compared gene similarity
or tree topology between homologs in quartets by
esti-mating synonymous nucleotide substitution rates (K
s)
between them. We performed a bootstrap test to
evalu-ate the significance of putative gene conversions with
1000 repetitive samplings to produce a bootstrap
fre-quency indicating the confidence level of the supposed
conversion [89,
108]. The pipelines used to identify
homologous gene quartets and detect gene conversion
are available on GitHub (https://github.com/qiao-xin/
Scripts_for_GB/tree/master/detect_gene_conversion).
All homologous gene quartets identified in this study
have been deposited on FigShare (https://doi.org/
10.6084/m9.figshare.7264667.v1).
Inferring the orthogroups of 141 green plants
matches and m8 format output) for each pairwise
gen-ome comparison between species and self-gengen-ome
com-parisons by using protein sequences. Then, we ran
OrthoFinder with default parameters using the BLASTP
outputs as inputs and obtained a file containing the
orthologous groups (or gene families) of genes from
these 141 species. Furthermore, we assigned the genes in
each orthogroup into each single species and acquired
the repertoire of gene families for each species (freely
available on FigShare,
https://doi.org/10.6084/m9.fig-share.7264667.v1). We then investigated the distribution
of gene family size in all studied plants.
Gene ontology enrichment analysis
Because the members of a gene family have similar
func-tions, we only conducted the functional enrichment analysis
for the
Arabidopsis
gene sets from the most-conserved,
intermediate-conserved, and least-conserved gene families
(or orthogroups) in 141 plants. Firstly, we retrieved all
Arabi-dopsis
genes from most-preserved, intermediate-preserved,
and least-preserved gene families respectively. GO
annota-tions for the genes in
Arabidopsis
were downloaded from
Phytozome11 (https://phytozome.jgi.doe.gov/pz/portal.html).
Furthermore, we detected the overrepresented GO slim
terms in these
Arabidopsis
genes by using the GOATOOLS
package [111]. The
P
values used to evaluate significant
en-richment of certain GO terms were calculated based on
Fish-er
’
s exact test and corrected by an FDR test correction
method (false discovery rate implementation using
resam-pling). Finally, we used corrected
P
value < 0.01 as the
threshold to determine significant overrepresentation of
cer-tain GO terms.
Additional files
Additional file 1:Supplementary Table S1 and Figure S1-21. (DOCX 5373 kb)
Additional file 2:The detailed information of 141 plant species used in this study. (XLSX 76 kb)
Additional file 3:The absolute number of different modes of duplicate gene pairs in each taxon. (XLSX 49 kb)
Additional file 4:The fittedKspeak for WGD genes in each species.
(XLSX 62 kb)
Additional file 5:The enriched GO terms for tandem and proximal duplicate genes inArabidopsis thaliana. (XLSX 69 kb)
Additional file 6:The list of all RNA-Seq samples collected from differ-ent plants investigated in this study. (XLSX 105 kb)
Additional file 7:The 232 most conserved gene families in 141 plants. (XLSX 1968 kb)
Additional file 8:The enriched GO terms for the most-preserved, intermediate-preserved and least-preserved gene families in 141 plants. (XLSX 1018 kb)
Acknowledgements
We thank Barry Marler and Leiting Li for IT support. We thank Xiyin Wang for providing valuable script to detect gene conversion events. We also thank Maosong Pei and Weiwei Zeng for their help in data visualization.
Funding
This work was funded by the National Key Research and Development Program of China (2018YFD1000107), Key Program of National Natural Science Foundation of China (31830081),“Taishan Scholar”project from Shandong Province of China, the Earmarked Fund for China Agriculture Research System (CARS-28), Jiangsu Province Science and Technology Support Program (BE2018389), the US National Science Foundation to AHP and XW (MCB-1021718; 1339727), and the China Scholarship Council.
Availability of data and materials
All accession numbers and URLs for raw data used in this study are provided in Additional file2[112–227]. TheDupGen_finderpipeline is freely available on GitHub (https://github.com/qiao-xin/DupGen_finder) [228]. The different modes of duplicate gene pairs identified in 141 plant genomes are available at Plant Duplicate Gene Database (PlantDGD,http://pdgd.njau.edu.cn:8080) [229]. The orthologous groups inferred by OrthoFinder using all genes from the 141 plants are available for download from FigShare (https://doi.org/10.6084/ m9.figshare.7264667.v1) [230]. The custom scripts used in this study are freely available on GitHub (https://github.com/qiao-xin/Scripts_for_GB) [228].
Authors’contributions
AHP, SZ, and XQ conceived and designed the experiments. XQ performed the experiments. XQ and AHP analyzed the data. LL and RW contributed analysis tools/materials/Perl scripts. QL, HY, and KQ assisted in the data analysis. XQ, SZ, and AHP wrote the paper. All authors read and approved the final manuscript.
Ethics approval and consent to participate Not applicable.
Consent for publication
All authors are aware of the content and agree with the submission.
Competing interests
The authors declare that they have no competing interests.
Publisher
’
s Note
Springer Nature remains neutral with regard to jurisdictional claims in published maps and institutional affiliations.
Received: 18 May 2018 Accepted: 8 February 2019
References
1. Goffeau A, Barrell BG, Bussey H, Davis RW, Dujon B, Feldmann H, Galibert F, Hoheisel JD, Jacq C, Johnston M, et al. Life with 6000 genes. Science. 1996; 274:546–67.
2. Wolfe KH, Shields DC. Molecular evidence for an ancient duplication of the entire yeast genome. Nature. 1997;387:708–13.
3. Aury JM, Jaillon O, Duret L, Noel B, Jubin C, Porcel BM, Segurens B, Daubin V, Anthouard V, Aiach N, et al. Global trends of whole-genome duplications revealed by the ciliateParamecium tetraurelia. Nature. 2006;444:171–8. 4. McGrath CL, Gout JF, Doak TG, Yanagi A, Lynch M. Insights into three whole-genome duplications gleaned from theParamecium caudatum
genome sequence. Genetics. 2014;197:1417–28.
5. McGrath CL, Gout J-F, Johri P, Doak TG, Lynch M. Differential retention and divergent resolution of duplicate genes following whole-genome duplication. Genome research. 2014;24:1665–75.
6. Dehal P, Boore JL. Two rounds of whole genome duplication in the ancestral vertebrate. PLoS Biol. 2005;3:e314.
7. Nakatani Y, Takeda H, Kohara Y, Morishita S. Reconstruction of the vertebrate ancestral genome reveals dynamic genome reorganization in early vertebrates. Genome Res. 2007;17:1254–65.
8. Braasch I, Gehrke AR, Smith JJ, Kawasaki K, Manousaki T, Pasquier J, Amores A, Desvignes T, Batzel P, Catchen J, et al. The spotted gar genome illuminates vertebrate evolution and facilitates human-teleost comparisons. Nat Genet. 2016;48:427–37.
9. Makino T, McLysaght A. Ohnologs in the human genome are dosage balanced and frequently associated with disease. Proc Natl Acad Sci. 2010; 107:9270–4.