the frequently used preprocessing task in several image enhancement techniques. The software implementation of the histogram is hardware inefficient and provides poor performance. To improve the performance, hardware implementation is done. The existing algorithms/architectures are inefficient. Therefore, two new low complexity histogram algorithm are proposed in this paper. The proposed algorithms prop1 and prop2 reduce the number of counters by 50% and 75% and reduces the delay by 23.8% and 31.04%, respectively. Therefore, the proposed algorithm can be effectively applied to achieve high performance designs.
Keywords: Histogram Generator, Image Processing, Integrated Circuits, VLSI, Low Power Design.
I. INTRODUCTION
The operations which are used to improve the visual quality of the image are called as image enhancement and include noise cancellation, de-burring, sharpening, upgrading the contrast, edge high lightening, and brightening of the image . These image enhancement operations are employed in several applications from consumer electronics to medical imaging For example, in medical image, the quality may be poor due to the motion or vibration of the target/patient, inappropriate illumination in the room, noise in the electronic devices etc. therefore, requires image enhancement before analysis of the medical image. Most of the operations are software based i.e. done by writing a program which are inefficient and consume more power and provide poor performance. Design of dedicated hardware reduces the delay of the operation and significantly improves the performance of the application. Among the different image enhancement operations, the image histogram finds several usages in image segmentation such as number plate categorization, performance monitor of the channel etc. A histogram is the graphical representation of the number of pixels for the given grayscale intensity level. For example, in case of 8-bit per pixel grayscale image, there are 256 different intensity levels and therefore the horizontal axis in histogram will start with 0 and ends at 255 while the vertical axis will show number of pixel occurrence. Although the histogram is being used in several applications, most of the applications employ a software program to achieve it and very little efforts have been given to design a hardware architecture for the histogram generator. This paper addresses the limitations of existing software level approach by implementing a VLSI architecture for of the histogram In this paper new high performance architectures for the image histogram are proposed that show very small area of implementation over the existing architectures. In the proposed architecture, the computation complexity is reduced by reducing the number of bins i.e. the pixels which are differ by one are approximate to the same value.
The remainder of the paper is organized as follows. Section II basic of histogram generator whereas Section III provides related work on histogram generator. Section IV present proposed histogram algorithms. Experimental analysis is given in Section V while conclusion is given in Section VI.
II. HISTOGRAM AND ITS USAGE
A histogram is the plot to represent the frequency of the data in a set of continuous data [8]. For example, in an image, histogram shows the frequency of the pixel’s intensity. It can be used to determine the data statistic/distribution of the e.g. skewed, outliner etc. An example, the age of the men in a company is given below, then the histogram shown in Fig. 1 shows the number of mans of the specific ages in that company. From this histogram it can be observed that most of employee in this company are of average age.
Technology (IJRASET)
Fig. 1: Histogram of age of mans in a company.
Since the histogram is vertical chart to represent the distribution of the set of data, it can be used to see the distribution of the measurements in an experiment whether they are distributed in the whole range or in a specific set [9]. It will then help us to do experiment with appropriate set of data. The histogram is very useful when you want to do the following:
Summarize large data sets graphically
Compare process results with specification limits Communicate information graphically
Use a tool to assist in decision making
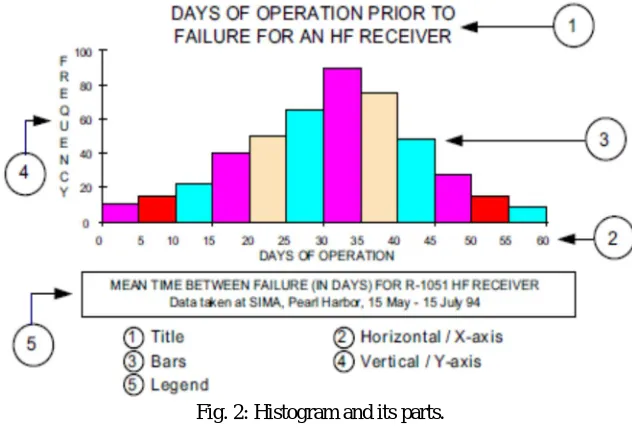
The various parts of a histogram are as follows as shown in Fig. 2 .
Title: The title briefly describes the information that is contained in the Histogram.
Horizontal Axis: The horizontal axis shows you the scale of values into which the measurements fit. These measurements are generally grouped into intervals to help you summarize large data sets. Individual data points are not displayed.
Bars: The bars have two important characteristics: height and width. The height represents the number of times the values within an interval occurred. The width represents the length of the interval covered by the bar. It is the same for all bars.
Vertical Axis: The vertical axis is the scale that shows the number of times the values within an interval occurred. The number of times is also referred to as "frequency."
Legend: The legend provides additional information that documents where the data came from and how the measurements were gathered.
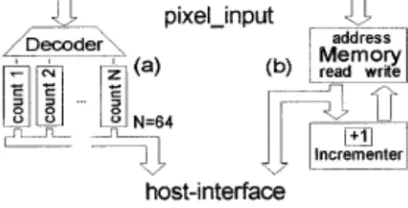
[image:3.612.146.462.456.674.2]Fig. 3: Two histogram architectures.
The architecture in Fig. 3(a), exhibits array of counter for each pixel intensity while a decoder allows only one counter to increment the pixel value. On the other hand, in the architecture as shown in Figure 3(b) does not exhibit counter. In the second architecture, the pixel value works as address and access the memory. For each access, the contents of them memory is increased by one. Therefore, each pixel requires a read after write operation to compute the histogram of the image. The number of memory and the counter depends on the number of different grayscale values. The major limitation of the array of counter method for histogram generation is inefficient use of the counters, therefore second method i.e. memory bases method is commonly used.
B. Parallel pipelined histogram architectures
Cadenas et al. presented parallel pipelined architectures of the histogram where k-data items are processed in parallel to compute 2D histogram in one-time step. The major challenge in designing the parallel architecture using memory method is handling of updates to the specific bin specially when there are multiple writes to the same bin. To avoid this multi-write conflict, the multi-port memory is used. This architecture computes the histogram of n bits for m-bins in n+m-1 time steps, where m-1 is the latency of the pipeline architecture. Another pipelined architecture for the histogram generation is also developed that can process k-data bits per time step and computes histogram in n/k+[floor(m-1/2q)] time step. These architectures provide very fast histogram at the cost of increased design overhead. Another parallel array histogram architecture is proposed in by Gan et al. that can be efficiently utilized in embedded applications. This paper presents architecture that does not utilizes the pipelining technique to improve the performance but exploits the array of registers to store the value of the histogram bin. The parallel array histogram architecture (PAHA), exhibits m, N:2N decoder, 2N accumulators to accept m n-bit data. In this architecture, each accumulator is associated to one register bin. This architecture can process m-bits in parallel can update the value of the register accordingly without any conflict. This architecture provides improved performance over the existing architectures. The author implemented this design and simulated. The results show that this architecture can improve the performance by 3.2X, 13.1X and 43.7X for 1-way, 4-way and 16-way PAHA architectures compared to the conventional software implementation.
C. Reconfigurable histogram architecture
Technology (IJRASET)
Fig. 4: Histogram sub-cell module.
D. Low complexity histogram generation algorithms
Ghosh et al. presented an algorithm for grayscale image histogram generation. This algorithm can compute the histogram of any grayscale image very fast and provide quality which is very similar to the quality produced by the inbuilt function of MATLAB. The algorithm employs the following steps to compute the histogram.
It initially converts the 2D image into 1D vector by scanning from left to right and top to bottom.
A 1D array of size equal to the number of grayscale levels (256) is initialized that will store the frequency of different intensity levels.
Finally, the algorithm scans each pixels and value of the corresponding grayscale counter is increased by one.
The author implemented this algorithm in Verilog and simulated with benchmark images. The simulation results show nearly same quality as produced by the inbuilt function of MATLAB. The author showed that the proposed algorithm takes very less time to compute the histogram of the image.
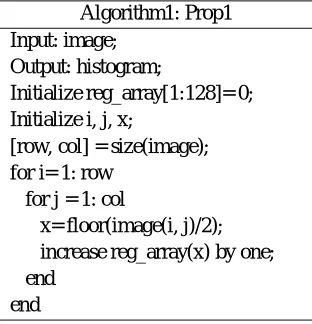
[image:5.612.165.446.492.699.2]resulting image will provide the same information as that of original while significantly reducing the number of counters and registers from 256 to 128. At the hardware implementation point of view, this can be achieved by considering only seven most significant bits (MSB) for the addressing the corresponding register.
Algorithm1: Prop1 Input: image;
Output: histogram;
Initialize reg_array[1:128]= 0; Initialize i, j, x;
[row, col] = size(image); for i= 1: row
for j = 1: col
x= floor(image(i, j)/2); increase reg_array(x) by one; end
end
Similarly, the truncation of two least significant bits in the pixels results in 64 different intensity level i.e. pixels which are having difference of four are approximated by one single intensity level. The consideration of six MSB bits of input pixel reduces the number of counters and registers from 256 to 64 only i.e. this approximation reduces the implementation complexity by 75%.
V. EXPERIMENTAL RESULT & ANALYSIS
The proposed design is compared over the existing designs on the basis of quality and design metrics. To compare the quality of the histogram, the designs are implemented on MATLAB and simulated with benchmark images such as Baboons, Lena images etc. The histograms of the images are extracted via proposed and existing architectures. Further, the histogram algorithms are implemented in Verilog and implemented on FPGA Vertex6 (XC6VHX380T). The design metrics (area and delay) are evaluated and compared.
A. Histogram Quality Analysis
The proposed and the existing algorithm for the histograms are implemented on MATLAB and simulated with the benchmark images as shown in Fig. 6.
[image:6.612.228.384.235.397.2](a) Lena image (b) Cameraman image
Technology (IJRASET)
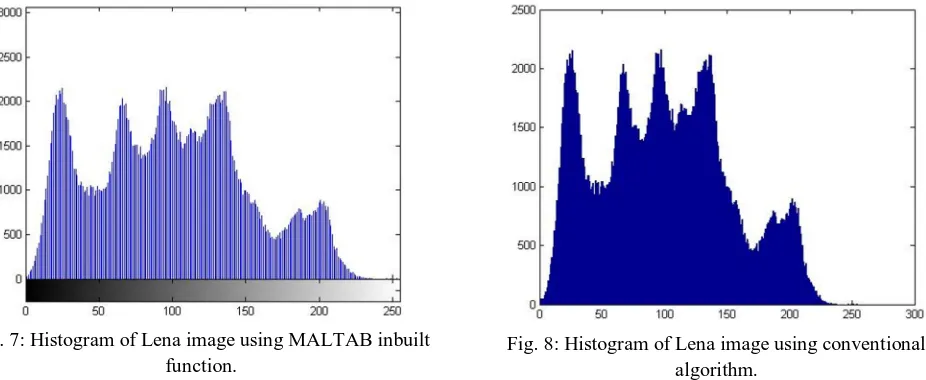
[image:7.612.63.526.116.306.2]The histogram of the Lean image ( see Fig. 6(a) ) using the MATLAB’s inbuilt function ( imhist() ) is shown in Fig. 7. This histogram reflects the frequency of the pixels intensity where it can be seen that image have very small number of pixel with higher values.
[image:7.612.313.525.120.280.2]Fig. 7: Histogram of Lena image using MALTAB inbuilt function.
Fig. 8: Histogram of Lena image using conventional algorithm.
Further, the program is written to compute the histogram using conventional method and this program is simulated with the Lena image. The histogram of the Lena image using conventional algorithm is shown in Fig. 8.
[image:7.612.203.412.427.488.2]The number of counters and array registers required for the different algorithms are shown in Table 1. It can be seen from the table that proposed algorithm1 reduces the number of counters and registers by 50% over the conventional algorithm. Therefore, the proposed algorithm significant reduces the implementation complexity over the existing algorithms. The proposed algorithms prop1 and prop2 reduce the number of counters by 50% and 75% respectively. Therefore the proposed algorithm can be effectively applied to reduce the implementation complexity.
TABLE I: Counters and array registers for different histogram algorithm.
Parameter Conventional Prop1 Prop2
Array
Register 256 128 64
Counters 256 128 64
B. Design Metrics
The proposed and the existing algorithm for the histogram generation are implemented in Verilog and functionality is verified by writing test bench. The designs are simulated and area, delay metrics are extracted after synthesis on Vertex 6. The simulation results are tabulated in Table 2. The area of the different histogram architectures are computed in terms of number of slice registers, slice-LUT and LUT-BUFF pairs. The value of delay is extracted in nenoseconds.
TABLE II: Design metrics for different histogram architectures
Parameter Conventional Prop1 Prop2
Delay (nS) 3.585 2.732 2.472
Frequency
(MHz) 278.9 365.97 404.757
#Slice Registers 8 7 6
# Slice LUTs 41 39 14
syntheses and post synthesis results shows that proposed architectures consume small area over the conventional histogram generator. The area in terms of LUTs register and LUT-BUF pairs is evaluated and compared.
REFERENCES
[1] R.C. Gonzalez and R.E. Woods, Digital Image Processing, Prentice Hall, 2nd Edition, 2001.
[2] F.T. Arslan, 1.M. Moreno, and A.M. Grigoryan, "New Methods of Image Enhancement," in the Proceedings of the SPIE conference on Visual Information Processing XIV, 2007.
[3] Lorraine Denby and Colin Mallows, "Variations on the histogram", Journal of Computational and Graphical Statistics, January 2007.
[4] Shahbahrami, A., Hur, J.Y., Juulink, B., and Wong, S.: ‘FPGA implementation of parallel histogram computation’. 2nd HiPEAC Workshop on Reconfigurable Computing, Goteborg, Sweden, 2008, pp. 63–72.
[5] Medeiros, H., Holguin, G., Shin, P.J., and Park, J.: ‘A parallel histogram-based particle filter for object tracking on SIMD-based smart cameras’, Comput. Vis. Image Underst., 2010.
[6] Shahbahrami, A., Juurlink, B., and Vassiliadis, S.: ‘SIMD vectorization of histogram functions’. Proc. of ASAP, Montreal, Quebec, Canada, 2007, pp.174–179. [7] Jamro, E., Wielgosz, M., and Wiatr, K.: ‘FPGA implementation of the strongly parallel histogram equalization’. Proc. IEEE Workshop on DDECS, Krakow,
Poland 2007, pp. 1–6.
[8] P.R.R. Hasanzadeh, A. Shahmirzaie, and A.H. Rezaie, “Motion detection using differential histogram equalization,” in Proceedings of IEEE International Symposium on Signal Processing and Information Technology, 2005, pp. 186–189.
[9] N. Dalal and B. Triggs, “Histograms of oriented gradients for human detection,” in Proceedings of IEEE Computer Society Conference on Computer Vision and Pattern Recognition, 2005, vol. 1, pp. 886–893.
[10] M.U. Chowdhury, R. Rahman, J. Sana, and S.M.R. Kabir, “Fast scene change detection based histogram,” in Proceedings of IEEE/ACIS International Conference on Computer and Information Science, 2007, pp. 229–233.
[11] Muller, Steffen. "A new programmable VLSI architecture for histogram and statistics computation in different windows." Image Processing, 1995. Proceedings. International Conference on. Vol. 1. IEEE, 1995.
[12] Cadenas, J., R. Simon Sherratt, and P. Huerta. "Parallel pipelined histogram architectures." Electronics letters 47.20 (2011): 1118-1120.
[13] Maggiani, L., Salvadori, C., Petracca, M., Pagano, P., & Saletti, R. (2014, June). Reconfigurable architecture for computing histograms in real-time tailored to FPGA-based smart camera. In Industrial Electronics (ISIE), 2014 IEEE 23rd International Symposium on (pp. 1042-1046). IEEE.
[14] Ghosh, S., Hazra, S., Maity, S. P., & Rahaman, H. “A new algorithm for grayscale image histogram computation”, In India Conference (INDICON), 2015 Annual IEEE (pp. 1-6). IEEE.