Technology (IJRASET)
©IJRASET: All Rights are Reserved
1
Simultaneous Visualization and Segmentation of
Hyperspectral Data Using Fuzzy K Means
Clustering
Dr.T. Arumuga Maria Devi1 , M.Mathan Raja2
1
Assistant Professor, 2PG student , Centre for Information Technology and Engineering Manonmaniam sundaranar university, Tirunelveli, India
Abstract— Hyperspectral imaging collects and processes information from across the electromagnetic spectrum. The goal of hyperspectral imaging is to obtain the spectrum for each pixel in the image of a scene, with the purpose of finding objects, identifying materials, or detecting processes. The existing approaches uses optimization-based method for simultaneous fusion and unsupervised segmentation of hyperspectral remote sensing images by exploiting redundancy in the data. Then the weights are optimized to improve those statistical characteristics. The optimal recovery of the weight matrix additionally provides useful information in segmenting the hyperspectral data set spatially. But it is not suitable for multi spectral data set. In the proposed system uses fuzzy k-means clustering for simultaneous visualization and segmentation of hyperspectral data.
Keywords—Hyperspectral visualization,segmentation,TV-norm, Fuzzy kmeans clustering.
I. INTRODUCTION
Hyperspectral sensors collect information as a set of 'images'. Each image represents a narrow wavelength range of the
electromagnetic spectrum, also known as a spectral band. These 'images' are combined to form a three-dimensional (x,y,λ)
hyperspectral data cube for processing and analysis, where x and y represent two spatial dimensions of the scene, and λ represents
the spectral dimension (comprising a range of wavelengths). Technically speaking, there are four ways for sensors to sample the hyperspectral cube: Spatial scanning, spectral scanning, snapshot imaging, and spatio-spectral scanning. Hyperspectral cubes are
generated from airborne sensors like the NASA's Airborne Visible/Infrared Imaging Spectrometer(AVIRIS), or from satellites
like NASA's EO-1 with its hyperspectral instrument Hyperion. However, for many development and validation studies, handheld sensors are used. The precision of these sensors is typically measured in spectral resolution, which is the width of each band of the spectrum that is captured. If the scanner detects a large number of fairly narrow frequency bands, it is possible to identify objects even if they are only captured in a handful of pixels. However, spatial resolution is a factor in addition to spectral resolution. If the pixels are too large, then multiple objects are captured in the same pixel and become difficult to identify. If the pixels are too small, then the energy captured by each sensor cell is low, and the decreased signal-to-noise ratio reduces the reliability of measured features. The acquisition and processing of hyperspectral images is also referred to as imaging spectroscopy or, with reference to the
hyperspectral cube, as 3D spectroscopy. There are four basic techniques for acquiring the three-dimensional (x,y,λ) dataset of a
hyperspectral cube. The choice of technique depends on the specific application, seeing that each technique has context-dependent advantages and disadvantages.
Although hyperspectral data is not sparse in itself, the gra- dient of the data contains many near-zero values. This is due to the gradually varying nature of the reflectance spectrum of any material. Minimization of total-variation (TV) norm of a vector leads to a representation whose gradient is sparse. Our proposed approach exploits this model of hyperspectral data to estimate a weight array having a sparse gradient by minimizing its TV norm. However, we need to minimize the
3-D TV norm as opposed to the popular 2-D TV norm used in solving the image restoration problem [12]. The difficulty in the minimization of the TV norm due to its non-differentiability is overcome using the majorization-minimization algorithmic ap-
proach suggested by Oliveira et al. in [13], which approximates the TV-norm function by an upper bound quadratic function and then
minimizes it. Imposing the piecewise-constant smoothness constraint on the weights helps in preserving and enhancing the edges. Optimization of the overall cost function is posed as an unconstrained optimization problem and solved by a simple gradient descent algorithm.
Technology (IJRASET)
©IJRASET: All Rights are Reserved
2
segmentation map by using the k-means clustering algorithm on the weight array. A point to note is that this formulation is very
different from end-member unmixing [14] and does not seek to express the pixel spectra as a weighted sum of standard spectra of elemental materials. It requires no training or learning.
The organization of this paper is as follows. In Section II, we look at some recently suggested algorithms for the problem of visualization of hyperspectral images. Section III presents in detail the formulation of the proposed algorithm. In Section IV, we present test results of our algorithm on standard hyperspec- tral data sets and contrast our results with the currently existing algorithms using standard quality metrics for both fusion and segmentation process.
II. SURVEY O F RELATED WORK
Hyperspectral data processing typically demands enormous computational resources in terms of storage, computation, and input/output throughputs, particularly when real-time processing is desired. In this paper, a proof-of-concept study is conducted on compressive sensing (CS) and unmixing for hyperspectral imaging. Specifically, we investigate a low-complexity scheme for hyperspectral data compression and reconstruction. In this scheme, compressed hyperspectral data are acquired directly by a device similar to the single-pixel camera based on the principle of CS. To decode the compressed data, we propose a numerical procedure to compute directly the unmixed abundance fractions of given endmembers, completely bypassing high-complexity tasks involving
the hyperspectral data cube itself[1].The visualization approach and the fusion model, presented in this paper, are derived from the
now well-known preservation of spectral distance criterion which measures the agreement between the distance of spectrums associated to each pair of pixels and their perceptual color distance in the final fused image to be displayed. This intuitive criterion was already used for estimating an informative color mapping, allowing the efficient visualization of hyperspectral images[2]. We focus on the restoration approach and propose a novel method based on sparse representation over learned dictionaries. The dictionaries for PAN image and low resolution MS image are learned from source images adaptively. Furthermore, a novel strategy is designed to construct the dictionary for high-resolution MS image from the dictionaries for PAN image and low-resolution MS
image[3]. A bilateral filtering-based approach is presented for hyperspectral image fusion to generate an appropriate resultant
image. The proposed approach retains even the minor details that exist in individual image bands, by exploiting the edge-preserving
characteristics of a bilateral filter. It does not introduce visible artifacts in the fused image[4]. Hyperspectral image visualization is
usually provided as a functionality in hyperspectral image analysis software such as Multispec, ENVI, Geomatics, TnTlite, HyperCube, and HIAT. A direct visualization method is to render the image as a 3-D cube The main problem that we observed is that existing methods map spectral samples to unbounded 3-D Euclidean space. After dimension reduction, they all use not only a second nonuniform mapping to color space that creates colorful images but also the illusion of salient features that are not present in
the data[5]. The third method presented was developed specifically to fuse hyperspectral images for visual analysis. This new
method uses the spatial frequency response (contrast sensitivity) of the human visual system to determine which features in the input images need to be preserved in the composite image(s) thus ensuring the composite image maintains the visually relevant features from each input image[6]. Several fusion techniques have been developed in the literature for visualization of hyperspectral data. The amount of computation needed for such techniques is directly related to the volume of the data. Most of these techniques involve a significant amount of computation due to high volume of the data, making the fusion processes slow. We analyze the statistical characteristics of this data in order to develop a technique for faster fusion[8]. One of them employs matched-filtering based on the spectral characteristics of various materials and is very promising for classification purposes. The information content of the hyperspectral bands as well as the quality of the obtained RGB images are quantitatively assessed using measures such as the
correlation coefficient, the entropy, and the maximum energy—minimum correlation index [9].a new clustering method, but simply
an efficient implementation of Lloyd's k-means algorithm.The idea of storing the data points in a kd-tree in clustering was considered by Moore in the context of estimating the parameters of a mixture of Gaussian clusters. He gave an efficient implementation of the well-known EM algorithm. The application of this idea to k-means was discovered independently by Alsabti et al., Pelleg and Moore (who called their version the blacklisting algorithm), and Kanungo et al.. The purpose of this paper is to
present a more detailed analysis of this algorithm[11].The optimization problem was solved using the Euler–Lagrange equation.
This method, however,does not preserve the edge information in the fused image. The fusion part of the technique proposed in this paper is quite similar to this method, but the qualitative goals for fusion have been much improved, and the process has been
extended toperform simultaneous image segmentation.
Technology (IJRASET)
©IJRASET: All Rights are Reserved
3
A. Introduction
With the advancement in the remote sensing technology, several hundred narrow-band images of the same area on the Earth are available. The hyperspectral sensors provide high-resolution spectral information covering the visible and the infrared wavelength spectra. This information is collected over contiguous narrow spectral bands by measuring the reflectance response of the surface to different wavelengths. The hyperspectral image applications have extensively been researched in the areas of remote sensing, environment monitoring, geological surveying, and surveillance due to their distinct advantages in classification and object identification. Recently, hyperspectral imaging has also been found to be extremely useful in surveillance for coastal and cross-border material transport. However, the analysis of hyperspectral data faces following challenges.
B. Visualization of Hyperspectral Images
The process of image fusion aims at the formation of a single image that selectively merges the maximum possible features from the source images. In the case of hyperspectral image bands, the images are obtained by sampling a continuous spectrum at narrow wavelength intervals (e.g., each channel of the Airborne Visible/Infrared Imaging Spectrometer (AVIRIS) instrument has a nominal bandwidth of 10 nm). As the spectral response of the scene does not vary much over the adjacent bands, extracting specific information contained by a particular band is the key to the fusion process. We calculate the value of each pixel of the fused image by a normalized weighted average of the pixels among different bands at the corresponding location. The critical part of the algorithm lies in choosing appropriate weights representing the subtle information at each location along the available spatial and spectral ranges, which indicates selecting different weights for every pixel in each of the image band. We define the weight of the particular pixel in the image from the relative importance of the feature with respect to its neighborhood. A smoothing 2-D filter removes the slowly varying features from the image, and therefore, subtracting the filtered image from the original image gives the important local details in the image.
C. Image Fusion
The objective of fusing a subset of the hyperspectral data cube is to obtain a single image that retains the features from all the constituent bands as much as possible. The hyperspectral images are generated as the reflectance response of the surface, which mainly depends on the properties and composition of the material in the scene. Certain substances exhibit a stronger
response over a given wavelength range and form strong and sharp features in the corresponding subset of the image cube. On the other hand, certain substances have a peak reflectance response over a very narrow wavelength range. These substances form weak features, i.e., edges and textures, which are
seen only in few images. Let I(x, y, λ1) to I(x, y, λM) be the subset of a hyperspectral image cube, containing M images from
consecutive wavelength bands λ1 to λM. We calculate the weight at each pixel (x, y) for each image, w1 to wM, using the bilateral
filter as shown in the following:
wi(x, y) =
| ( , , ) ( , , )|
∑ (| ( , , ) ( , , )| )……...(1)
where IBF is the corresponding bilateral filtered image. K is a positive real number that allows flexibility in the fusion process by
increasing or decreasing the effect of actual weight components and prevents numerical instability at homogenous regions.
D. Hierarchical Fusion
A typical hyperspectral image data set in remote sensing contains a few hundred images to be fused into a single image (for grayscale) or three images (for RGB). Combining all the image bands of the given data set together results in assigning very small fractional weights to the locations in the each of the image bands. In this procedure, some of the weights are comparable to the truncation errors, and hence, some of the minor details may wash out during fusion. Furthermore, the data along the spectral dimension are needed for the computation of such fractional weights. Therefore, the procedure requires the entire hyperspectral cube to be read into memory. Considering the huge size of a hyperspectral image cube, the memory requirement goes over a few hundreds of megabytes e.g., J steps. By generating three fused images at the prefinal stage and assigning them to appropriate color channels, we can obtain the RGB representation of the hyperspectral image cube for the tristimulus visualization.
E. Implementation
The fusion process is controlled by three parameters σS, σR, and K. The choice of appropriate values of these parameters is necessary
Technology (IJRASET)
©IJRASET: All Rights are Reserved
4
Figure 3.1 Scheme of the hierarchical fusion for the hyperspectral image cube
We calculate the difference between the maximum and minimum values of intensity of a given image data set to find the actual
intensity range in the image. We choose the value of σR as the fraction of the intensity range to define the edge measure
σR = α [max (I(x, y, λ)) − min (I(x, y, λ))]………(2)
where α is set to 0.02 during experiments for all data sets. The choice of σS decides the size of spatial details retained during fusion,
which is related to the ground-projected instantaneous field of view in remote sensing.
IV.PROPOSINGSYSTEM
A. Introduction
Hyperspectral imaging captures the reflectance map of a scene at various wavelengths of light, typically in the range of 0.4–2.5 μm
with a resolution of 10 nm. Such a high spectral resolution leads to a very large number of image bands that suffer from a lot of redundancy of data. The problem of efficient mining of information from such data sets has drawn considerable attention over the past few decades. Image fusion and segmentation are two important operations performed on remote sensing hyperspectral data sets. Image fusion offers the first step in visualizing a scene in a meaningful way for a human observer, whereas segmentation offers an object level description of the scene. In previous studies, many different techniques have been developed to perform these operations. Although the end results of the solutions to these two problems, i.e., visualization and segmentation, are different, they have a certain common structure associated with them. In both the problems, some measure of spatial and/or spectral distance between the pixels can be used to operate on the data set to obtain the output. By exploiting this similarity of structure, we suggest here an alternative approach that can perform these tasks simultaneously and in an interdependent manner. Most image fusion algorithms aim at extracting the salient features from the hyperspectral data set and combining them into a single image for observer interpretation. Traditional methods include the use of techniques such as principle and independent component analysis (ICA) to reduce the dimensionality of a data set to produce a small number of bands that capture statistically significant information from the data.
B. Proposed Approach
We define the following qualitative goals for the image fusion process.
Highlight salient spatial features from the individual bands without introducing artifacts.
Technology (IJRASET)
©IJRASET: All Rights are Reserved
5
Match the intensity range of the image to the range of display device.
Minimize noise without blurring image features.
Similar goals for fusion of hyperspectral bands have been defined in the past, although they have not been dealt with concurrently. Each of these goals is associated with certain statistical properties of the image. We associate a cost function with these properties
and minimize it using a gradient descent algorithm. The hyperspectral data is represented as a 3-D cube f(x, y, λ) of size m × n × B.
The size of each image in the cube ism × n, whereas the total number of spectral bands is B. The fused image is represented by g(x,
y), and the weights are represented by w(x, y, λ). Sum of the point-wise product between the data and the weights across the spectral
axis gives the pixel values of the final fused image g(x, y)
g(x, y) =∑ f(x, y,λ)w(x, y,λ)………(4.1)
with
∑ w(x, y)=1∀ (x, y)………(4.2)
Figure:4.1 Proposed System Architecture
C. Derivation Of Cost Function
1) Kurtosis Minimization: The Shannon-entropy quantifies the amount of information content in an image. A higher value of entropy is desirable in the fused image, which necessitates the fused image to approach a uniform intensity distribution. Out of the set of all possible discrete valued probability mass functions without empirical constraints, the uniform distribution has the maximum entropy. Thus, in order to maximize the entropy of the image, the histogram of the image must tend to be uniform. Such a distribution will exploit the dynamic range of the display device better and provide greater contrast, hence improving the visual representation of the image. Kurtosis is a statistical property of a distribution that is closely related to its shape. Kurtosis relates to the “peak ness” of a distribution; it is defined as the ratio of the fourth moment around the mean to the square of the variance
2) Display Range Maximization: The dynamic range of the display device on which the fused image is to be displayed plays an important role. In order to avoid under-saturation of dark regions or oversaturation of bright regions in the image, the mean pixel value should be placed at the center of the dynamic range of the display device. Such a cost function has been widely used in solving the image restoration problem in astrophysical images, known as “MENT” restoration. The following function, which penalizes the pixels lying at the extreme ends of the range of image intensity value and pulls them to the mean, is minimized. It also pulls the mean of the fused image to the center value of display device’s dynamic range
Input
Hyperspectr
al data
Spectral Band 1
Spectral Band 2
Spectral Band n
Technology (IJRASET)
©IJRASET: All Rights are Reserved
6
K[g] = [( ) ]
( [( ) ]) ………..(4.3)
where [0,N] is the dynamic range of the display device. Such a cost function was previously used by Kotwal and Chaudhuri [4].
3) Target Gradient Fitting : In hyperspectral imaging, the presence of hundreds of bands can be very efficiently used to obtain rich spatial details in the fused image. One of our goals is to capture a large number of consistent edge-features from the various spectral bands. An elegant solution to this problem for the fusion of multispectral data was suggested by Socolinsky and Wolff [11] and further expounded by Piella [10]. Edge information is captured in the gradient-map of an image. Here, we attempt to create a “target” gradient map from the data set by extracting the maximal gradient at each pixel location, among all bands. This is done by doing a weighted addition of the local geometry at each pixel across all bands. Higher weights are assigned to the bands with greater magnitude of gradient. Such a weighted addition ensures that edge information is contributed by all bands and that the larger gradient value gets captured in the target gradient map.Using the target gradient, we define the following cost
M(g) =∑ ∑ g(x, y)log( ( , )
. )………(4.4)
It may be noted that the computation of the target-gradient map needs to be performed only once at the beginning of the optimization process and not at each iteration.
4) Smoothness Constraint: In hyperspectral images, the presence of noise is generally seen to be higher in a few particular spectral bands for a given sensor due to errors in its optical system [24]. Several methods have been suggested in the past to identify these noisy bands and remove them before processing the data set further [25], [26]. In addition, the noise is seen to occur in a set of adjacent row or columns of pixels in these bands and appear as noisy vertical or horizontal lines in the images. The use of the “target-gradient” cost term defined earlier in (4.8) captures maximum gradient across all the bands and hence is expected to carry over the line-noise to the fused image as well. In order to avoid this, we impose the piecewise constant smoothness constraint on the weight array. This piecewise-constant continuity of the weights prevents from giving unduly high or low weights to these sparsely
occurring noisy image pixels thus reducing thenoisy horizontal or vertical lines from occurring in the fused image. The
piecewise-constant continuity is exploited by us for performing unsupervised segmentation as well on the data set, as explained in the next section. Piecewise-constant smoothness of weights is achieved by minimizing the 3-D total-variation norm of the weights.
TV(w) =∑, , w + w + w ……… (4.5)
5) Normalization Of Weights: The sum of the weights along the bands at each pixel location (x, y) should sum to unity. To ensure this, we minimize the following cost term
U =∑ ∑ ∑ w(x, y,λ) −1 ……… (4.6)
Although this does not impose a strict condition on the weights summing to unity, it converts a constrained optimization problem to unconstrained optimization for computational benefit. We also put a hard constraint during the iterations to force the weights to saturate within the range [0, 1].
6) Overall Cost And Optimization: All the cost terms in the previous section are summed together to form the total cost
C(w) = μKK(w) + μMM(w) + μVV (w) +μQQTV(w) + μUU(w). ……….(4.7)
μi’s are the relative weights, or the optimization step size, allotted to each cost term. There have been a few optimizationbased
schemes in the literature [4], [9], which have also defined certain cost functions. The proposed cost function is very different in the sense that we try to achieve all the goals specified at the beginning of this section. The effectiveness of each term in the cost
Technology (IJRASET)
©IJRASET: All Rights are Reserved
7
optimizing.
7) Unsupervised Segmentation: The fusion process aforementioned conveys no information about the spatial distribution of the various materials in the scene. This information can be summarized by means of a segmentation map of the data set. A segmentation map uniquely labels each group of pixels, which have similar underlying spectral responses. A simple method of achieving this is using the k-means clustering algorithm directly on the input data, giving the spectral response at each pixel location as the input to the algorithm. This method suffers from many disadvantages. A common problem in hyperspectral data is the possibility of shift in the radiometric values at different pixels even for the same underlying material. Due to this, the use of any distance metric in the k-means algorithm will lead to improper clustering. Furthermore, the presence of noisy bands in the hyperspectral data aggravates the problem of incorrect segmentation substantially. However, since the aim in this paper is only to demonstrate the superiority of using the weight array over the actual hyperspectral data for segmentation, we have limited ourselves to the use of standard k-means algorithm. Without any loss of generality, an improved segmentation performed on the weight array is shown to be a by-product of the proposed smoothness constraint on the weight array, any other segmentation scheme may be used in conjunction with the proposed optimization scheme.
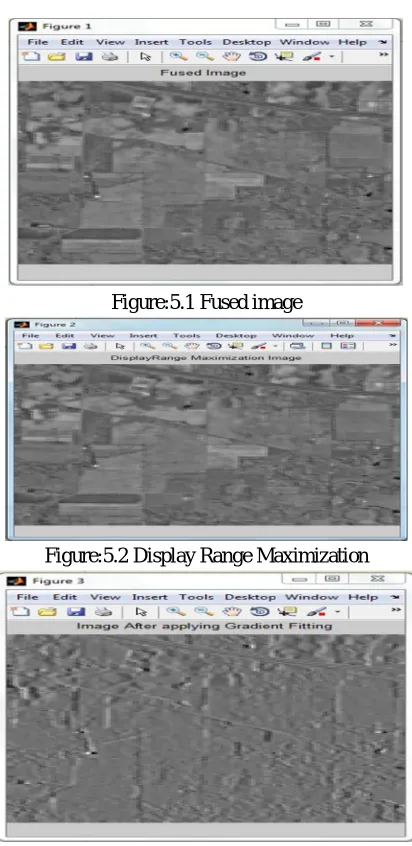
[image:8.612.203.409.283.706.2]V. RESULTS AND DISSCUSSION
Figure:5.1 Fused image
Figure:5.2 Display Range Maximization
Technology (IJRASET)
©IJRASET: All Rights are Reserved
8
Figure: 5.4 Image After applying smoothness
Figure:5.5 Normalized image
Figure: 5.6 segmentation
Technology (IJRASET)
©IJRASET: All Rights are Reserved
9
Figure: 5.8 Average Gradient Versus Iterations
Figure:5.9 Average Normalized Mean Pixel Values
Technology (IJRASET)
©IJRASET: All Rights are Reserved
10
Figure: 5.11Average Fusion Factor
V. CONCULSION
This paper presents a new approach for fusion of hyperspectral images that also facilitates a good segmentation. The image fusion has been performed by obtaining an optimal weight at each spatial location and at each spectral band. The contribution of this paper lies in formulating a refined set of qualitative goals that ensure an enhanced fused image ready to be visualized on a display device. These goals have been achieved by associating them with quantitative quality measures of the fused image and optimizing the weights to improve them. The problem was posed as an unconstrained optimization problem and solved using a simple gradient descent algorithm. The significant improvements that were obtained in our method over previous methods of similar construction include the optimization of the entropy of the fused image, which was solved by posing the problem as a kurtosis minimization problem, extracting the spatial features in the bands using the closeness of the gradient of the fused image to the “gradient Fitting” cost term, and, most importantly, the edge-enhancement and noise removal, which was achieved by imposing a piecewise-constant smoothness constraint on the weight array by minimization of its 3-D TV norm. The resulting weight array is also seen to be good suited for segmentation than the hyperspectral data set itself because of its piecewise constant nature.
REFERENCES
[1] V. Tsagaris, V. Anastassopoulos, and G. Lampropoulos, “Fusion of hyperspectral data using segmented PCT for color representation and classification,” IEEE Trans. Geosci. Remote Sens., vol. 43, no. 10, pp. 2365–2375, Oct. 2005.
[2] T. Wilson, S. Rogers, and M. Kabrisky, “Perceptual-based image fusion for hyperspectral data,” IEEE Trans. Geosci. Remote Sens., vol. 35, no. 4, pp. 1007– 1017, Jul. 1997.
[3] K. Kotwal and S. Chaudhuri, “A fast approach for fusion of hyperspectral images through redundancy elimination,” in Proc. 7th ACM ICVGIP, 2010, pp. 506– 511.
[4] K. Kotwal and S. Chaudhuri, “An optimization based approach to fusion of hyperspectral images,” IEEE J. Sel. Topics Appl. Earth Observ. Remote Sens., vol. 5, no. 2, pp. 501–509, Apr. 2012.
[5] J. Tyo and R. Olsen, “Principal component based display strategy for spectral imagery,” in Proc. IEEE Workshop Adv. Tech. Anal. Remotely Sensed Data, 2003, pp. 276–281.
[6] Y. Zhu, P. Varshney, and H. Chen, “Evaluation of ICA based fusion of hyperspectral images for color display,” in Proc. 10th Int. Conf. Inf. Fusion, 2007, pp. 1–7.
[7] J. J. Lewis, R. J. O. Callaghan, S. G. Nikolov, D. R. Bull, and N. Canagarajah, “Pixel and region-based image fusion with complex wavelets,” Inf. Fusion, vol. 8, no. 2, pp. 119–130, Apr. 2007, Special Issue on Image Fusion: Advances in the State of the Art.
[8] B. Guo, S. Gunn, B. Damper, and J. Nelson, “Adaptive band selection for hyperspectral image fusion using mutual information,” in Proc. 8th Int. Conf. Inf. Fusion, 2005, vol. 1.
[9] T. Stathaki, Image Fusion: Algorithms and Applications. Amsterdam, The Netherlands: Elsevier, 2011.
[10] G. Piella, “Image fusion for enhanced visualization: A variational approach,” Int. J. Comput. Vis., vol. 83, no. 1, pp. 1–11, Jun. 2009.
[11] D. Socolinsky and L. Wolff, “Multispectral image visualization through first-order fusion,” IEEE Trans. Image Process., vol. 11, no. 8, pp. 923– 931, Aug. 2002.
[12] L. I. Rudin, S. Osher, and E. Fatemi, “Nonlinear total variation based noise removal algorithms,” Phys. D, Nonlinear Phenom., vol. 60, no. 1–4,pp. 259–268, Nov. 1992.
[13] J. P. Oliveira, J. M. Bioucas-Dias, and M. A. Figuiredo, “Adaptive total variation image deblurring: A majorization minimization approach,” Signal Process., vol. 89, no. 9, pp. 1683–1693, Sep. 2009.
Technology (IJRASET)
©IJRASET: All Rights are Reserved
11
[15] K. Kotwal and S. Chaudhuri, “A novel approach to quantitative evaluation of hyperspectral image fusion techniques,” Inf. Fusion, vol. 14, no. 1, pp. 5–18, Jan. 2013.
[16] C. Pohl and J. L. Van Genderen, “Review article multisensor image fusion in remote sensing: Concepts, methods and applications,” Int. J. Remote Sens., vol. 19, no. 5, pp. 823–854, Jan. 1998.
[17] L. Alparone et al., “Comparison of pansharpening algorithms: Outcome of the 2006 GRS-S data-fusion contest,” IEEE Trans. Geosci. Remote Sens., vol. 45, no. 10, pp. 3012–3021, Oct. 2007.
[18] M. Cui, A. Razdan, J. Hu, and P.Wonka, “Interactive hyperspectral image visualization using convex optimization,” IEEE Trans. Geosci. Remote Sens., vol. 47, no. 6, pp. 1673–1684, Jun. 2009.
[19] N. Jacobson, M. Gupta, and J. Cole, “Linear fusion of image sets for display,” IEEE Trans. Geosci. Remote Sens., vol. 45, no. 10, pp. 3277– 3288, Oct. 2007. [20] K. Kotwal and S. Chaudhuri, “Visualization of hyperspectral images using bilateral filtering,” IEEE Trans. Geosci. Remote Sens., vol. 48, no. 5, pp. 2308–
2316, May 2010.
AUTHORS
Assistant Professor Dr. T. Arumuga Maria Devi Received B.E. Degree in Electronics & Communication Engineering from Manonmaniam Sundaranar University, Tirunelveli India in 2003, M.Tech degree in Computer & Information Technology from Manonmaniam Sundaranar University, Tirunelveli, India in 2005 and Worked as Lecturer in department of Electronics & Communication Engineering in Sardar Raja College of Engineering and also received Ph.D Degree in Information Technology – Computer Science and Engineering from Manonmaniam Sundaranar University, Tirunelveli , India in 2012 and also the Assistant Professor of Centre for Information Technology and Engineering of Manonmaniam Sundaranar University since November 2005 onwards. Her research interests include Signal and Image Processing, Multimedia and
Remote Communication.