Fuzzy Base Enhanced LEACH IN WSN
Renu Tyagi1,Dr. K.K. Paliwal2
1M.Tech Scholar, Panipat institute of Engineering and Technology
2Director, Panipat institute of Engineering and Technology
Abstract— Wireless sensor networks (WSN) are highly distributed networks of autonomous small, lightweight sensors (nodes) in large numbers to monitor physical or environmental conditions by the measurement of, temperature, vibration, pressure, motion or pollutants, sound, and to cooperatively pass their data through the network to a main location (often called a sink). In designing WSN routing protocol, enhancing energy efficiency and extending the lifetime of WSNs are the most important challenges for researchers. In LEACH protocol each sensor nodes elects itself as a cluster head based on the probability model. Every sensor node will become cluster head in every cycle to evenly distribute the work loads. Main problem of LEACH protocol is it only depends on the probability model to elect the cluster head and therefore it is possible that no cluster heads or too many are selected in a single round. Moreover, selected cluster heads may be located near to each other or even near to the edge of the networks which leads to inefficient energy distribution. From the above discussion, we conclude that the focus of almost researches is to conserve energy at its maximum level. Our proposed model is also an improvement in the leach algorithm.
Keywords—WSN, LEACH, Fuzzy, energy, probability
I. INTRODUCTION
WIRELESS Sensor Network (WSN) [1] consists of one or more sinks and large number of sensor nodes scattered in an area. With the integration of information sensing, computation and wireless communication, sensor nodes can sense the physical phenomenon, (pre-) process the “raw” information, share the processed information with neighboring nodes, and report information to the sink. The downstream traffic from the sink to the sensor nodes usually is a one-to-many multicast. The upstream
traffic from sensor nodes to the sink is a many-to-one communication.
II. MAIN ISSUE IN WSN
A. Energy Considerations
During the creation of an infrastructure, process of setting up the routes is greatly influenced by energy considerations. By the transmission power of a wireless radio is proportional to distance squared or even higher order in the presence of obstacles, multi-hop routing will consume less energy than direct communication. Anyhow, multi-hop routing introduces
significant overhead for topology management and medium access control [2]. The direct routing would perform well enough if all the nodes were very close to the sink. Almost the time sensors are scattered randomly over an area of interest and multi-hop routing becomes unavoidable
III. ENERGY EFFICIENCY IN WIRELESS SENSOR NETWORK
the data dynamics and keep lazy when data consistency is maintained.
IV. ROUTING PROTOCOL LEACHIN WSN
LEACH [3] stands for Low-Energy Adaptive Clustering Hierarchy and is one of the first hierarchical protocols. When the node in the network fails or its battery stops working then LEACH protocol is used in the network. Leach is self-organizing, adaptive clustering protocol in which sensor nodes will organize themselves into local clusters and cluster members elect cluster head (CH) to avoid excessive energy consumption and incorporate data aggregation which reduces the amount of messages sent to the base station to increase the lifetime of the network. Therefore this algorithm has an effect on energy saving.
Cluster head is responsible for collecting data from its cluster members. To reduce inter cluster and intra cluster collisions, LEACH uses a TDMA/code-division multiple access (CDMA) [4]. The decision whether a node elevates to cluster head is made dynamically at a time interval. However, data collection is performed periodically. Therefore, the LEACH protocol is mainly used for constant tracking by the sensor networks. When the node becomes cluster head for the current round, then each elected cluster head broadcasts information to rest of the nodes in the network. To balance the energy dissipation of nodes, the cluster heads change randomly over time [5].
A. DIRECT V. MINIMUM TRANSMISSION
Fig 1: (a) shows the direct transmission (b) Minimum Transmission Energy
The amount of energy used in figure (a) can be modeled by this formula:
eampk(3d1 + d2)2
Whereas the amount of energy used in figure (b) uses this
formula:
eampk(3d12 + d22)
B. THE AMOUNT OF ENERGY DEPLETION
This is the formula for the amount of energy depletion by data transfer:
The energy being dissipated to run the transmitter: Eelec =50nJ/bit
The energy dissipation of the transmission amplifier: εamp
=100pJ/bit/m2.
Transmission costs: ETX (k,d) =Eelec k + εamp kdλ
Receiving Costs: ERX (k) = Eelec k
Where k is the length of the message in bits.
D is distance between nodes and
λ represents the path loss exponent (λ ≥ 2).
C. STOCHASTIC THRESHOLD ALGORITHM
In each round, each node independently generates the random number between 0 and 1. If the generated number is less than the threshold value T(n) which defines by (1), the node ills self elect to become the cluster head for the current round.
Cluster-heads can be chosen stochastically (randomly based) on this algorithm:
Senso r Nodes
T(n) =
p
1 − p × rmod 1p , if nϵG
0 , otherwise
(1)
r is the round which already ended;
p is the proportion of the nodes to cluster heads;
G is a set of nodes which have never been cluster head in the last 1/p rounds.
If n < T(n), then that node becomes a cluster-head.
D. DETERMINISTIC THRESHOLD ALGORITHM
1. A modified version of this protocol is known as LEACH-C (or LEACH Centralized).
2. This version has a deterministic threshold algorithm [6], which takes into account the amount of energy
in the node…
T(n) =1 − P × (r mod P )P EE_
_
Where En_current is the current amount of energy and
En_max is the initial amount of energy
E. DIFFERENCE BETWEEN THE STOCHASTIC AND DETERMINISTIC
The goal of these protocol is to increase the life of the network
The changes between the LEACH stochastic algorithm and the LEACH-C deterministic algorithm alone is proven to increase the FND (First
Node Dies) lifetime by 30% and the HND (Half Node Dies) lifetime by 20%.
F. DRAWBACK OF LEACH
1. LEACH depends on only the probability model to elect the cluster head, elected cluster head may be very close to each other.
2. In each round the number of the cluster head is dynamic and it cannot guarantee the data stream received at the base station [7].
3. Cluster head will appear in the edge of the network or in the place where the node density is very low.
V. PROPOSED WORK
The performance of the LEACH protocol depends on the cluster head. So the election of the cluster head is the crucial task. The proposed work uses a fuzzy logic controller for the selection of Cluster head. The cluster head must have the energy greater than the average energy. The distance of the cluster head from the base station should be kept low as distance increases the energy consumption increases. The cluster head must be surrounded by other nodes so that the data can be easily forwarded and collected. Depending upon these factors the proposed work selects the cluster head on the basis of these factors.
1. Residual Energy
2. Node centrality
3. Node Density
4. Distance
These factors are taken as input for fuzzy logic controller as the fuzzy logic controller is used to elect the cluster head. Following Figure shows the fuzzy logic controller. Various components of fuzzy logic controller are described below.
Sensor
Nodes Base Statio
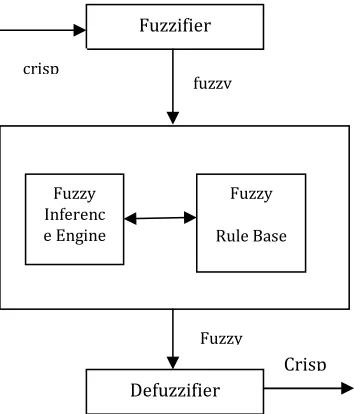
Fig 2: Fuzzy Inference System Architecture
Fuzzfier: It translates crisp inputs into fuzzy values. It transforms the system inputs, which are crisp numbers, into fuzzy sets. This is done by applying a fuzzification function.
Fuzzy Inference Engine: It applies reasoning to compute fuzzy outputs.
Defuzzyfier: Translates fuzzy outputs into crisp values.
Fuzzy Rule Base: Defines rules and membership functions.
In fuzzifier, inputs with crisp value change into a fuzzy set and results are transferred to defuzzifier through fuzzy inference engine and fuzzy rules base. Defuzzifier changes a fuzzy set to crisp value. These four parameter can give the output on the basis of the fuzzy rule base.This output decide the cluster head. The proper Cluster head Selection leads to the Proper clustering and the energy efficient operation. Following table shows the fuzzy rule base, the mapping of input with output. As total input are 4 with each having 3 possibilities so the total number of rules in rule base are 3*3*3*3=81 as given in the table.
Fuzzifier
fuzzy
Fuzzy Inferenc e Engine
Fuzzy
Rule Base
Defuzzifier Fuzzy
Sr No . Residua l Energy Density Node Centralit y Distance from Base station Probabilit y
1 Low Sparsel y
Close Close Medium
2 Low Sparsel y
Close Adequat e
Lower Medium
3 Low Sparsel y
Close Far Little Weak
4 Low Sparsel y
Adequat e
Close Lower Medium
5 Low Sparsel y Adequat e Adequat e Little Weak
6 Low Sparsel y
Adequat e
Far Weak
7 Low Sparsel y
Far Close Little Weak
8 Low Sparsel y
Far Adequat e
Weak
9 Low Sparsel y
Far Far Very Weak
10 Low Mediu m
Close Close Higher Medium
11 Low Mediu m
Close Adequat e
Medium
12 Low Mediu m
Close Far Weak
13 Low Mediu m
Adequat e
Close Medium
14 Low Mediu m Adequat e Adequat e Lower Medium
15 Low Mediu m
Adequat e
Far Little Weak
16 Low Mediu m
Far Close Little Weak
17 Low Mediu m
Far Adequat e
Lower Medium
18 Low Mediu m
Far Far Weak
19 Low Densel y
Close Close Little Strong
20 Low Densel y
Close Adequat e
Higher Medium
21 Low Densel y
Close Far Little Weak
22 Low Densel y
Adequat e
Close Higher Medium
23 Low Densel y Adequat e Adequat e Medium
24 Low Densel y
Adequat e
Far Weak
25 Low Densel y
Far Close Lower Medium
26 Low Densel y
Far Adequat e
Medium
27 Low Densel y
Far Far Little Weak
28 Mediu m
Sparsel y
29 Mediu m Sparsel y Close Adequat e Medium 30 Mediu m Sparsel y
Close Far Lower Medium 31 Mediu m Sparsel y Adequat e Close Medium 32 Mediu m Sparsel y Adequat e Adequat e Lower Medium 33 Mediu m Sparsel y Adequat e Far Little Weak 34 Mediu m Sparsel y
Far Close Lower Medium 35 Mediu m Sparsel y Far Adequat e Little Weak 36 Mediu m Sparsel y
Far Far Weak
37 Mediu m
Mediu m
Close Close Little Strong 38 Mediu m Mediu m Close Adequat e Higher Medium 39 Mediu m Mediu m
Close Far Little Weak 40 Mediu m Mediu m Adequat e Close Higher Medium 41 Mediu m Mediu m Adequat e Adequat e Medium 42 Mediu m Mediu m Adequat e Far Lower Medium 43 Mediu m Mediu m
Far Close Lower Medium 44 Mediu m Mediu m Far Adequat e Medium 45 Mediu m Mediu m
Far Far Little Weak
46 Mediu m
Densel y
Close Close Strong
47 Mediu m Densel y Close Adequat e Lower Strong 48 Mediu m Densel y
Close Far Lower Medium 49 Mediu m Densel y Adequat e Close Strong 50 Mediu m Densel y Adequat e Adequat e Higher Medium 51 Mediu m Densel y Adequat e Far Little Weak 52 Mediu m Densel y
Far Close Medium
53 Mediu m Densel y Far Adequat e Higher Medium 54 Mediu m Densel y
Far Far Lower Medium
55 High Sparsel y
Close Close Strong
56 High Sparsel y
Close Adequat e
Higher Medium
57 High Sparsel y
Close Far Medium
58 High Sparsel y
Adequat e
59 High Sparsel y Adequat e Adequat e Medium
60 High Sparsel y
Adequat e
Far Lower Medium
61 High Sparsel y
Far Close Medium
62 High Sparsel y
Far Adequat e
Lower Medium
63 High Sparsel y
Far Far Little Weak
64 High Mediu m
Close Close Strong
65 High Mediu m
Close Adequat e
Little Strong
66 High Mediu m
Close Far Lower Medium
67 High Mediu m
Adequat e
Close Little Strong
68 High Mediu m Adequat e Adequat e Higher Medium
69 High Mediu m
Adequat e
Far Medium
70 High Mediu m
Far Close Medium
71 High Mediu m
Far Adequat e
Higher Medium
72 High Mediu m
Far Far Lower Medium
73 High Densel y
Close Close Very Strong
74 High Densel y
Close Adequat e
Strong
75 High Densel y
Close Far Medium
76 High Densel y
Adequat e
Close Very Strong
77 High Densel y Adequat e Adequat e Strong
78 High Densel y
Adequat e
Far Lower Medium
79 High Densel y
Far Close Higher Medium
80 High Densel y
Far Adequat e
Strong
81 High Densel y
Far Far Medium
A. Simulation
TABLE 1 RESULT ANALYSIS OF PROPOSED LEACH
No of Nodes
Through put(kbps)
Energy(J) End 2 End delay(ms)
No of alive
Nodes
25 20833.20 0.6965 216.912 25
50 37449.65 1.85 298.302 50
75 57155.97 2.74 298.334 4
100 77649.68 4.63 330.660 4
TABLE 2 RESULT ANALYSIS OF EXISTING LEACH
No of Nodes
Through put(kbps)
Energy(J) End 2 End delay(ms)
No of alive
Nodes
25 20833.20 0.6965 216.912 25
50 37449.65 1.85 298.302 50
75 57155.97 2.74 298.334 4
The tabular analysis for the performance of the existing and proposed protocol shows that the performance of the proposed protocol is better than the performance of existing protocol; as the end 2 end delay is reduced by 0.112% and the energy consumption is reduced by 0.288% while the throughput is enhanced by 0.063%. The analysis is done on various networks having the different number of nodes as already shown in the table 2 and table 3. It means the proposed protocol performs well even for the large-scale network as well as for small-scale network
1. VI. CONCLUSION
The paper elected the cluster head on the basis of the fuzzy controller. The fuzzy controller gets residual energy, node centrality, node density and distance from BS as input and output the cluster head on the basis of fuzzy database. The simulation shows that proper cluster head selection leads to less energy consumption i.e. increase in network life time. In future work, movement can be provided to the sink node to balance the load and sub clustering can be done if the cluster is at large distance from the base station.
REFERENCES
1. [1] I. F. Akyildiz, W. Su, Y. Sankara subramaniam and
E. Cayirci, “Wireless sensor networks: A survey,”
Computer Networks J., vol. 38, pp. 393-422, 2002.
2. [2]I.F. Akyildiz, W. Su, Y. Sankarasubramaniam,
E.Cayirci, “Wireless sensor networks: a survey”
IEEE Commu.Mag., vol.40, no. 8, pp. 102-104, Aug. 2002.
3. [3] Ankita Joshi &Lakshmi Priya.M, “A Survey of Hierarchical Routing Protocols in Wireless Sensor
Network”, MES Journal of Technology and
Management, pp. 67 –71.
4. [4] Kiran Kumar, T. V. U., & Karthik, B. (2013). Improving Network Life Time using Static Cluster Routing for Wireless Sensor Networks. Indian Journal of Science & Technology, 6.
5. [5] Kemal Akkaya and Mohamed Younis, (2005) “A Survey on Routing Protocols for Wireless Sensor
Networks”, Ad Hoc Networks, pp. 325-349.
6. [6] Mitra, R., & Biswas, A. Enhanced Clusterhead Selection Algorithm Using LEACH Protocol for Wireless Sensor Networks. International Journal Of Computational Engineering Research/ISSN, 2250-3005.
7. [7] Siew, Z. W., Bono, A., Yoong, H. P., Yeo, K. B., & Teo, K. T. K. (2012). Cluster Formation of Wireless Sensor Nodes using Adaptive Particle Swarm Optimisation.
8. [8] The Network Simulator Wiki. [Online]. Available: http://nsnam.isi.edu/nsnam/ index.php/