Journal of Chemical and Pharmaceutical Research, 2014, 6(11):507-514
Research Article
CODEN(USA) : JCPRC5ISSN : 0975-7384Heavy metal ions removal from water using modified zeolite
Peng Zhang
1*, Wenjie Ding
1, Yanjun Zhang
2, Kanghai Dai
1and Wei Liu
11
School of Civil Engineering, Hunan University of Science and Technology, Xiangtan, Hunan, China
2
School of Life Science, Hunan University of Science and Technology, Xiangtan, Hunan, China
_____________________________________________________________________________________________
ABSTRACT
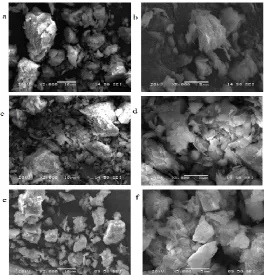
Zeolite was modified by HNO3 solution and NaOH solution in order to improve the adsorption performance. The
characterization of the modified zeolite by scanning electron microscope(SEM) and infrared spectroscopy(IR) was displayed. In order to obtain the optimum conditions for adsorption of Sb3+ and Mn2+, resulting in a better removal
efficiency, parameters such as the concentration of HNO3 and NaOH, dosage of modified zeolite, adsorption time,
initial concentration and adsorption temperature were examined. Results showed that the zeolite modified by 0.8 mol/L HNO3 had better adsorption rate for Sb3+, the zeolite modified by 1.4 mol/L NaOH had better adsorption rate
for Mn2+, and the highest adsorption rate of Sb3+ and Mn2+ were 89.1% and 99.6%, respectively. Isotherm process
was well predicted by Freundlich model when adsorption Sb3+ by using HNO3 modified zeolite, and the Langmuir
model fitting the equation well when adsorption Mn2+ by using NaOH modified zeolite. Kinetic process was predicted well by pseudo second-order model when adsorption Sb3+ by using HNO3 modified zeolite and adsorption
Mn2+ by using NaOH modified zeolite .
Key words: Adsorption, Antimony ion, Manganese ion, Modified Zeolite, Isotherms, Kinetics
_____________________________________________________________________________________________
INTRODUCTION
Due to the large-scale continuous mining and mineral separation for long-term, it has resulted in numbers of heavy metals entering into mine soil[1-2]. Upon rainfall, the heavy metal pollutants from contaminated soil is easy to dissociate and transform in soil-water interface, forming a pollution stream of heavy metal along with the rainfall infiltration and transporting by surface runoff, leading to a heavy metal pollution to the water environment[3-4]. Now heavy metal pollution in water environment and the harmful to human are very outstanding[5-6]. Once the heavy metals into the environment, they could not degradation, and there will be persist presence in the water environment. Numerous methods such as physical, chemical and biological processes including adsorption, biosorption, precipitation, ion-exchange, reverse osmosis, filtration and other membrane separations are employed to treat the heavy metal contaminated water[7]. However, adsorption has proven to be economical and efficient for removing heavy metals[8]. Several adsorbents such as zeolite, silica, and active carbon could be used in the water treatment. Zeolite as an kind of adsorbent material has lots of advantages, such as wide range of sources of raw materials, cheap and good adsorption effect, and it is widely used as adsorbents, ion exchangers and catalysts which could also be used for drying gases, purification and sewage treatment[9-10]. The present work aimed to used HNO3
● Fourier Transformed Infra Red (FT-IR) Spectrophotometer (Niclet 6700, Niclet instrument Company, USA) ● Atomic Absorption Spectrometer(AA-7001, East & West Analysis InstrumentCo., Ltd., China)
● Water bath oscillator (THZ-82, Jintan Ronghua Instrument Manufacturing Co., Ltd., China)
2.2 Pretreated zeolite and modification
First, the zeolite was placed in a beaker which was added 100mL ultra pure water for immersing 2h, filtered, and then washed three times and dried in a vacuum at 105˚C for several days. Finally immersing the zeolite with 0.8 mol/L HNO3 solution and 1.4 mol/L NaOH solution. In 50 ℃ water bath heating 4h, pouring the supernatant,
washing with deionized water for 3 times, dried in a vacuum at 85˚C for use.
2.3 Batch adsorption studies
Erlenmeyer flasks (250mL) containing 1.2 g of modified zeolite in 100 mL of antimony trichloride solutions were employed. Modified zeolite were dosed under the rotary shaker at 150 rpm for 4 h, the mixtures were then centrifuged at 3000 r/min for 5 min. The residual Sb3+ and Mn2+ concentration in the solution was then determined using atomic absorption spectrometer. The adsorption capacity was calculated using the following equation:
V
W
C
C
Qe
=
0−
ewhere Qe is the adsorption capacity (mg/g), C0 is the initial DMP concentration (mg/L), Ce is the final DMP
concentration (mg/L), W is the weight of adsorbent used (g) and V is the volume of DMP solution (L). The experiments were carried out in triplicates to obtain average results.
2.4 Isotherm study
Isotherm study was conducted using batch equilibrium experiments. Absorbent 1.2 g was added into every conical flask with 100 mL of aqueous solution containing the concentration solutions of Sb3+ between 5.0 and 25.0mg/L, and the concentration solutions of Mn2+ between 50.0 and 250.0mg/L. The pH of solution need not to adjust. The mixtures were covered and oscillation in a shaker at a constant speed of 150 r/min and temperature of room temperature. The mixtures were then centrifuged at 3000 r/min for 5 min. The residual Sb3+ and Mn2+ concentration in the solution was then determined using atomic absorption spectrometer.
2.5 Kinetic study
Batch kinetic experiments were performed by mixing a fixed amount of absorbent (1.2 g) with 100 mL Sb3+ solution of Sb3+ concentration at 10mg/L for 30-240 min and the Mn2+ concentration at 100.0mg/L for 30-270 min . The pH of solution need not to adjust. The mixtures were covered and oscillation in a shaker at a constant speed of 150 r/min and temperature of room temperature. After a certain period of oscillation, the entire suspension was taken from a conical flask and solid-liquid separation was achieved by centrifugation at 3000 r/min for 5 min. The residual Sb3+ and Mn2+ concentration in the solution was then determined using atomic absorption spectrometer.
Figure 2. IR spectroscopy of Natural zeolite(a), modified zeolite by HNO3(b),modified zeolite by NaOH(c)
3.2 Single influential factor analysis 3.2.1 The selection of modifiers
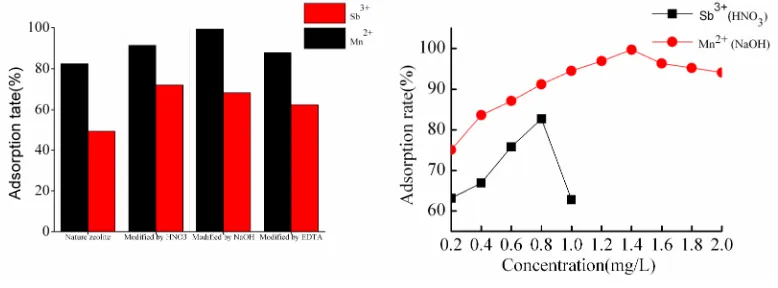
The effect of the kind of modifier was investigated. HNO3, NaOH, and EDTA were used, respectively. The results as
shown (Figure 3) that zeolite modified by HNO3 was had the best adsorption of Sb3+ and the zeolite modified by
NaOH was had the best adsorption of Mn2+. In order to fixed the concentration of the HNO3 as modifier. The
concentration of HNO3 ranged from 0.2 up to 1.0 mol/L was selected to investigate the adsorption effect. As the
increased of concentration of HNO3 ranged from 0.2 g to 0.8 mol/L, the removal rate of Sb3+ increased from 63.1%
[image:4.595.116.505.414.558.2]to 82.7%, and when the concentration increased to 1.0 mg/L, the adsorption decreased to 62.8%. So 0.8 mol/L was chosen as an optimum concentration. And in order to fixed the concentration of the NaOH as modifier. The concentration of NaOH ranged from 0.2 up to 2.0 mol/L was selected to investigate the adsorption effect. As the increased of concentration of NaOH ranged from 0.2 g to 1.4 mol/L, the removal rate of Mn2+ increased from 75.1% to 99.7%, and when the concentration increased to 2.0 mol/L, the adsorption decreased. So 1.4 mol/L was chosen as an optimum concentration.
Figure 3.Effect of modifier on adsorption Figure 4.Modifier concentration on adsorption
3.2.2 Effect of modified zeolite dosage on adsorption capacity and adsorption rate
The effect of the dosage of modified zeolite adsorption was investigated. The dosage of modified zeolite ranged from 0.6 up to 1.4 g was selected to investigate the adsorption effect (Figure5). As shown in when the dosage was increased, the adsorption capacity and removal rate was increased, that because with the increase of the amount of modified zeolite, the total surface area of the modified zeolite increased, which resulting in an increase of the adsorbent effective adsorption sites. As the increased of HNO3 modified zeolite dosage ranged from 0.6 g to 1.2 g,
Figure 5. Effect of dosage on adsorption
3.2.2 Effect of contact time on adsorption capacity and adsorption rate
The effect of contact time on adsorption was investigated. The contact time ranged from 1 h up to 5 h was selected to investigate the contact time (Figure 6). As shown in the adsorption of Sb3+ when the contact time was increased, the adsorption capacity and removal rate was increased, especially within 4 h, adsorption and removal efficiency was increased sharply. When the time was 4 h, the removal rate reached 86.8%, while continuing to extend the contact time to 5 h, the adsorption capacity reaches up to 88.3%. Between 4-5 h, the adsorption capacity increased slowly. That indicated that the adsorption process was the fast adsorption process, when the concentration of Sb3+ was higher, the more adsorbent exposure, the more opportunities for the Sb3+ contact with the adsorbent, with the extension of adsorption time, the concentration of the Sb3+ becoming lower and the chance of molecular adsorbent contact with the Sb3+ reduced, resulting in the adsorption rate decreased. So, the 4 h was selected as the optimum time. But the adsorption of Mn2+ was a fast progress, the adsorption rate could reach 96.4% when the contact time was 1 h, extend the contact time to 3 h, it could reach up to 98.9%, continuing extend the contact time to 5 h, the adsorption rate increased smoothly, so 3 h was selected as the optimum time when using NaOH modified zeolite to adsorb the Mn2+.
Figure 6. Effect of contact time on adsorption
3.2.3 Effect of Sb3+ and Mn2+ initial concentration on adsorption capacity and adsorption rate
Figure 7. Effect of initial concentration on adsorption
3.2.4 Effect of temperature on adsorption capacity and adsorption rate
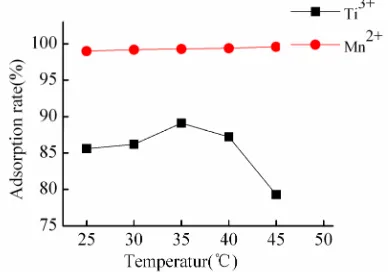
The effect of the temperature on modified zeolite adsorption was investigated. The temperature was ranged from 25 up to 45 was selected to investigate the adsorption effect (Figure 8). As shown in with the increased of the temperature, the adsorption efficiency of Sb3+ and adsorption capacity increased firstly and then decreased when the temperature exceed 35 . When the temperature increased from 25 to 35 , the adsorption efficiency increased from 85.6% to 89.1%. That because as the initial temperature of the solution increased, the movement of Sb3+ increased, which lead to accelerate the opportunity of their mutual collisions, and resulting in increased adsorption capacity and adsorption efficiency, but when the temperature exceed 35 ,the desorption rate on the surface accelerate, which lead to the removal rate decreased to 79.3%. But the temperature from 25 ℃ to 35 ℃ on the adsorption of Mn2+ was not obvious, the adsorption rate were all exceeded to 99.0%.
Figure 8. Effect of temperature on adsorption
3.3 Adsorption isotherm
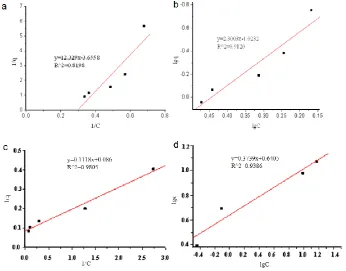
At room temperature, the initial concentration of Sb3+ were 5.0 mg/ L, 10.0 mg/L, 15.0 mg/ L, 20.0 mg/L, 25.0mg/L, respectively, at the condition of contact time was 4 h, measured the residual concentration of Sb3+ in solution when reached the experimental adsorption equilibrium point, then calculated adsorption capacity, Langmuir and Freundlich equations were used to fit the data, the results shown in Figure 6(a) and Figure 6(b) which was the modified zeolite adsorption isotherm of Sb3+, the adsorption capacity of Sb3+ by HNO3 modified zeolite increased
[image:6.595.211.406.377.513.2]Figure 9. Adsorption isotherm of Sb3+, Mn2+ fitted to Langmuir model and Freundlich model
3.4 Adsorption kinetics
The Sb3+ adsorption kinetics on modified zeolite was studied by using Sb3+ initial concentration of 10.0 mg/L. As shown in Figure 10 that the Sb3+ and Mn2+ adsorption capacity also increased with increasing contact time. Two commonly used kinetic models, pseudo first-order and second-order kinetic models have been applied to describe the adsorption of Sb3+ and Mn2+ onto modified zeolite as a function of contact time. The pseud first-order kinetic model is expressed as below:
t
k
Inq
q
q
In
(
e−
t)
=
e−
1where, qt (mg/g) and qe (mg/g) represent the amount of adsorbate adsorbed at time t and at equilibrium time,
respectively, and k1 represents the adsorption rate constant. The adsorption rate constant (k1) was calculated from the
plot of ln(qe-qt ) against t. The pseudo second-order kinetic model can be expressed as below.
e e
t
q
t
q
k
q
t
+
=
22
1
where, k2 (g/(mg· min)) is the pseudo second-order rate constant of sorption, qe (mg/g) is the amount of adsorbate
sorbed at equilibrium and qt (mg/g) is the amount of adsorbate on the surface of the adsorbent at any time t. The qe
and k2 can be obtained by linear plot of t/qt versus t. According to the calculated kinetic parameters shown in Figure
Figure 7. (a)Pseudo first-order kinetic model of Sb3+ , (b)Pseudo second-order kinetic model of Sb3+, (c)Pseudo first-order kinetic model
of Mn2+, (d)Pseudo second-order kinetic model of Mn2+
CONCLUSION
In this study, the adsorption test for removing Sb3+ and Mn2+ by modified zeolite have been researched. The single influential factor was investigated, including the dosage of the modified zeolite, the contact time, the initial concentration and the temperature of the solution. The highest adsorption rate of Sb3+ and Mn2+ were 89.1% and 99.6%, respectively. The isotherm process was well predicted by Freundlich model when adsorption Sb3+ by using HNO3 modified zeolite and the Langmuir model fitting the equation well when adsorption Mn2+ by using NaOH.
The kinetic process was well predicted by pseudo second-order model when both adsorption Sb3+ by using HNO3
modified zeolite and adsorption Mn2+ by using NaOH modified zeolite .
Acknowledgments
This research is supported by Scientific Research Fund of Hunan Provincial Education Department(14B059), Hunan University of Science and Technology Research Project(E51395).
REFERENCES
[1] X Liang; YH Chen; XF Wu; FY Zhang. J. Centr. Sou. Univer. Fores. & Techno., 2012, 32(12), 104-109. [2] CX Gao; C Li; J Peng; D Su. J. Chongqing Techno.& Busine. Univer.(Natu. Sci. Edit.), 2013, 30(8):78-83 [3] W Shotyk; B Chen; M Krachler. J. Environ. Monitor., 2005, 7(12): 1148-1154.
[4] P Smichowski. Talanta, 2008, 75(1), 2-14.
[5] M Karniba; A Kabbani; H Holail; Z Olama. Energy Procedia, 2014, 50, 113-120.
[6] RS Juang; SH Lin; TY Wang. Chemosphere, 2003, 53(10), 1221-1228.
[7] AS Mohammad; AQ Zakaria; BM Khalid; RQ Mohammed; A Malek. Chem. Eng. J., 2015, 260, 749-756. [8] Q Weng; ZG Zhang. Chinese Journal of Environmental Engineering, 2014, 8(2), 548-552.
[image:8.595.93.515.58.356.2]