International Journal of Emerging Technology and Advanced Engineering
Website: www.ijetae.com (ISSN 2250-2459,ISO 9001:2008 Certified Journal, Volume 3, Issue 2, February 2013)
197
A Survey On Different Approaches Used In Image Quality
Assessment
Anna Geomi George
1, A. Kethsy Prabavathy
21PG Scholar, 2Assistant Professor, Dept.of.CSE, Karunya University, INDIA
Abstract—Image quality assessment means estimating the quality of an image and it is used for many image processing applications. Image quality can be measured in two ways, subjective and objective method. Objective method is more preferable than subjective because most of the time the original image is not available for the comparison and it is not that much expensive like the subjective method. These methods are used to predict the visual quality by comparing a distorted image against a reference image. In this paper we are comparing the different approaches of image quality assessment.
Keywords— Image Quality Assessment (IQA), NR Method, Objective QA, Statistical Feature Extraction.
I. INTRODUCTION
The quality of the image is reduced due to the distortions and these distortions occurred during the transmission, storing or sharing time of information between the devices. Quality measuring is needed for many applications, for example if the designer of a medical device want to decide from which device get the better results so he want to measure the quality of the images from those devices. Quality can be measured in two ways subjective and objective. The presence of blur in an image can be easily identified by the human eye but it is difficult for the computer. Subjective methods are expensive so we move to objective measurements.
In objective we are predicting the perceived image quality automatically. Several methods have been used for the objective quality assessment i.e. depending on the presence of reference image they are classified in to full reference, reduced reference, and no reference approaches. Objective IQA is mainly used in the visual communication application for monitoring the QoS. Objective image metric is used to monitor and adjust the image quality and also it optimizes algorithms and parameter settings of image processing systems [2].
All these methods want to have high correlation with human perception or judgments. In this paper we are discussing about the various methods used to find the quality of an image.
II. IMAGE QUALITY ASSESSMENT
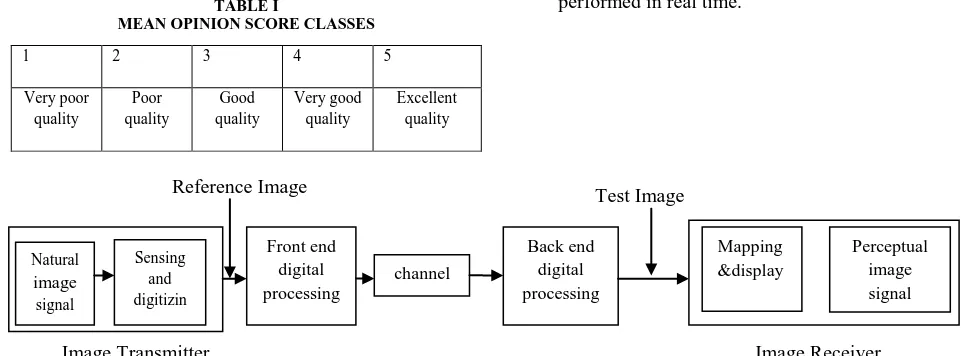
Basically image quality is measured in two ways subjective and objective method. In Subjective image quality assessment the evaluation of quality by humans is obtained by mean opinion score (MOS) method where in objective evaluation of quality is done by algorithms. The diagram for the IQA is shown in fig.1.It concerned with how image is perceived by a viewer and gives his or her opinion on a particular image and judge quality of the multimedia content. The human eyes extract structural information from the viewing field, so the human visual system is highly adapted for this purpose. Therefore, the measurement of structural distortion should be a good approximation of perceived image distortion [1].So the accurate and more efficient IQA measures will certainly enhance their applicability in real-world applications.
III. METHODS USED IN SUBJECTIVE QUALITY ASSESSMENT
In subjective methods the human subjects are utilizedto perform the task of assessing visual quality. The advantages of this method is, it is most reliable methodology and it provide useful information for the subsequent modeling phase and it gives better understanding of mechanisms underlying the quality perception[3]. The different methods used in are:
A. Single Stimulus (SS) Method
This method is used for evaluating the IQA algorithms[4,5] i.e. here a set of stimuli is taken one at a time and include a reference image in that set and it is not informed to the observer. Observer evaluates the quality and score is expressed in a numerical category rating. Single judgment is required per assessment and then the average score has been calculated. The quality range will be spanned by the stimuli. But this method induces inconsistency so we move to the other method called quality ruler method.
B. Quality Ruler (QR) Method
International Journal of Emerging Technology and Advanced Engineering
Website: www.ijetae.com (ISSN 2250-2459,ISO 9001:2008 Certified Journal, Volume 3, Issue 2, February 2013)
198 It detect the quality difference between them and the observer find the reference image closest in the quality to the test stimulus by visual matching and quality score is
noted. Compared to SS method it is more consistent and QR scores are highly correlated to objective measure of distortions than the SS scores [3].
Input [image:2.612.104.539.167.226.2]
Fig.1. Diagram for IQA
C. Mean Opinion Score
Mean opinion score produce the accurate results with small number of scores. It is generated by averaging the results of a set of standard, subjective test and act as an indicator for the perceived image quality [6, 8].Score classes are shown in Table 1.
TABLE I
MEAN OPINION SCORE CLASSES
1 2 3 4 5
Very poor quality
Poor quality
Good quality
Very good quality
Excellent quality
The other method used are force-choice method but it does not tell the difference between the quality of images where in pair wise similarity judgment method the quality difference between the two images are noted [7]. Disadvantages of subjective assessment are time consuming and are difficult to design and cannot be performed inreal time.
Reference Image
Image Transmitter Image Receiver
Fig.2. Diagram for FR IQA Method
IV. METHODS USED IN OBJECTIVE QUALITY ASSESMENT
The methods existing for objective quality assessment are of three based on the presence of reference images. These are:
4.1. Full reference method
In full reference IQA the reference image is want to be known and predict the visual quality by comparing the distorted signal against the reference image Mean Square error (MSE) and peak signal to noise ratio(PSNR) are mostly used.
Measurement methods consider the human visual System characteristics to incorporate with perceptual quality. The diagram for FR IQA method is shown in Figure 2.
The HVS measure use the psychophysical measurements to compute the visual quality and the image is decomposed to obtain the gain control model in the sub band decomposed domain[9] MSE is used to evaluate the quality and is defined as :
MSE = -
Where x is the original image and y is the distorted image M N are the width and height of the image. When
MSE value increases as the compression ratio increases. If the MSE value decreases to zero then pixel by pixel matching of images become perfect. MSE is a simpler one. Image
processing system
Updating
algorithms Quality measures
IQA Evaluation
Natural image
signal
Sensing and digitizin
g
Front end digital processing
channel
Back end digital processing
Mapping &display
[image:2.612.45.529.317.495.2]International Journal of Emerging Technology and Advanced Engineering
Website: www.ijetae.com (ISSN 2250-2459,ISO 9001:2008 Certified Journal, Volume 3, Issue 2, February 2013)
199 The other one is PSNR and is denoted by:
PSNR=10 lo
Where L is the dynamic range of the pixel values. But both of them do not correlate well with human perception of quality. To improve the traditional metric like MSE and PSNR, the Structural similarity (SSIM) metric is introduced and is defined as the function of luminance comparison,contrast,and structural comparison term. It is written as follows:
SSIM[f(i)g(i)]=l[f(i),g(i)]c[f(i),g(i)]s[f(i),g(i)]
Where f(i) and g(i) are the image patches and it measures the similarity between the two images and its value lies between 0 and 1.SSIM shows Symmetric property as well as the boundedness property.
The linear dependence measurement can be taken by the use of correlation coefficient in SSIM index [9].
[image:3.612.55.577.329.441.2]In information fidelity criterion method (IFC) the GSM model is used and the sub band filter coefficient of the reference image is modeled as random variables using NSS models. This information theoretic framework is known as IFC [12].It is applied in the sub band filtered domain but it does not provide any advantage over multistage SSIM indices. The extension of IFC metric is Visual Information Fidelity (VIF) and is defined as the relation of distortion image information to the reference image information. It also uses the GSM model, the VIF index that predict improvement in the quality due to the contrast enhancement and avoids the numerical instabilities occur in the IFC [13].
Fig 3. RR IQA Method
[image:3.612.59.279.550.697.2]Only VIF has the ability to predict the visual image quality that has been obtained by a contrast enhancement operation.VIF is better than IFC due to the use of contrast comparison function in addition to the structural comparison is as shown in Table 2 with other metrics.
TABLE II
Spearman correlation for full reference algorithms
Ideal metrics Noise JPEG Full
MSE 0.704 0.877 0.525
PSNR 0.704 0.877 0.525
IFC 0.663 0.898 0.569
VIF 0.820 0.956 0.750
MSSIM 0.813 0.957 0.853
SSIM 0.856 0.964 0.808
4.2. Reduced Reference
RR metric requires a feature vector from the reference image to evaluate the quality and these feature vectors are derived from ‗m‘ the parameters of statistical models. The block diagram will shown in Figure 3. The different approaches used in RR QA are first based on the modelling image distortions [14], second is based on HVS and third is based on NSS. The block diagram will shown in Figure 3. The different approaches used in RR QA are first based on the modelling image distortions [14], second is based on HVS and third is based on NSS.
Based on the HVS method, the features are extracted to provide a reduced description of the image and they are not directly related to any specific distortion system. Training for different types of distortion is needed [15,16]. Unnaturalness will occur due to the distortions and is measured based on the natural image statistics and here training is not needed for it and is more relevant to the visual perception of image quality.
Image Transmitter
Image transmitter
Image Channel Front end
digital
processing Channel Natural
image signal
Sensing and digitizing
Back end digital
processing Mapping &display image signal Perceptual Test image
Side information
Image Transmitter
Image transmitter
Image Channel Image Receiver
International Journal of Emerging Technology and Advanced Engineering
Website: www.ijetae.com (ISSN 2250-2459,ISO 9001:2008 Certified Journal, Volume 3, Issue 2, February 2013)
200 The statistical redundancies between wavelet coefficients can be reduced by using the divisive normalisation transform and this DNT is computed by the GSM model. Quality can be evaluated by comparing the set of reduced reference statistical features extracted from DNT domain representations of the reference and distorted images. The statistical properties are significally changed under the different types of image distortions [17].
[image:4.612.51.290.216.464.2]
Figure 4.1 1) Jpeg 2) White Noise Affect
4.2.
No Reference MethodsThe no reference approaches still lags advances in the full reference methods. Many of the blind image quality assessment is distortion specific. The various distortion affects are shown in Figure 4.1 and 4.2. BLIINDS index is a no reference approach and is used to predict image quality based by extracting the statistics of local discrete cosine transform coefficients and compute its kurtosis. The degree of peakness and tail weight is then quantified.
Where is the mean of x and is the standard deviation. Each values are then computed and the resulting values are pooled together to obtain the global image kurtosis value [18].
By No reference approach the blur and noise in the image can be quantified by using a no reference sharpness metric.
Local gradients affect is taken and then decomposed to singular value and characterize its behaviour in the presence of blur and noise. The sharpness metric is defined as:
H=
Where is the noise variance and is the fixed small positive constants.[19]. By using a no reference technique with multineural channel aspect of human visual system and standard score formula the blocking artifact is quantified. It measures the visibility of distortions as a combination of blocking artefact and undistorted image edges. The bit patterns are used to identify image regions that are affected by JPEG compression .The metric used is called visually significant blocking artifact metric (VSBAM) and is defined as:
VSBAM=
Here the numerator and denominator denote the blocking artefact. The value of VSAM is between 0 and 1. If the value is closer to one then it is considered as high blocking artefact and the value closer to zero is considered as the low blocking artifact[20].This method is used to extract visually important blocking artefacts but it does not satisfy the LSB bit patterns. Diagram for the NR IQA is shown in Figure 5. Using the artifact metrics the blockiness, blurriness and the noise in the videos can be predicted. Minkowski metric is used to obtain the overall annoyance model and it is written as:
Yp= ( .Blockines + +
If the value of p=1, then it become a linear model and these models have no statistical difference in performance. Many of the times the distortions in the image are unknown and then it is complex to evaluate the quality but in two step framework it does not need any knowledge about the distortion process if it is trained once. The techniques are based on NSS approach and assess the quality using distorted image statistics. Each distortions has its own unique signatures and is characterised using DIS and classify the images in to distortion categories this will be the first stage. Then combine it with distortion aware IQA and obtained the blind image quality index. This Framework will be a modular one [21].
Blind image quality index is
International Journal of Emerging Technology and Advanced Engineering
Website: www.ijetae.com (ISSN 2250-2459,ISO 9001:2008 Certified Journal, Volume 3, Issue 2, February 2013)
201 Where is the probability of each distortions in the
image and is the quality score corresponding to the distortions. Here the performance of each QA modules is not independent of each other. Probability weighted summation is used to find the BIQI score, so it improve the
overall performance of BIQI. This method is also highly correlated with human perception [22]. But for the compressed images the blocking, blurring and ringing affect can be computed and obtained the quality score using Murkowski summation.
Fig. 5. NR IQA Method
The blocking is measured as:
BIM=
[
Where, is the number of vertical and
horizontal blocks in the processed image. The blurring affect is due to the attenuation of the high spatial frequency coefficient which occurs during the compression stage and is denoted as:
BM=
Where (i,j) is the pixel (i,j) intensity of a component
of size M pixels. is the binary image resulting
from the edge detection. is the
complementary. Spatial information and pixel
activity is also included in it [23]. Ringing affect is measured as the ratio of region activities of middle low and high frequencies present in the ringing regions.
RM =
(i,j) is pixel (i,j) intensity, is pixel(i,j)
intensity. Then the inter pooling model is used to compute the quality score.
So the linear combination of first order terms of blurring, blocking and ringing measures have been taken and then introduce different associated cross terms and denoted as
+ BIM+ BM+ RM+ BIM
BM+ BIM RM+ BM RM
Where (i=0,...6) are the weights to be optimized[23].
This method is less expensive and uses the spatial information contained in the processed image.
Distortions in the image reduce the quality of the image and by using the no reference DIIVINE algorithm the quality of the image can be predicted across the multiple distortion categories. The statistical features are extracted under the NSS models. DIIVINE means the distortion identification based image verity and integrity evaluation (DIIVINE) index. DIIVINE index has two stages first is distortion identification and second is the distortion specification. In this the oriented band pass responses are obtained by decomposing the distorted image in to wavelet transform and then extract the statistical features and stacked to form a vector and it describes the distortions in the image. The proportion of distortion is identified from the subset and then estimates the quality of the image. On linear SVM training for the classification and non linear SRV training for regression is used within each class. Multidistortion QA is not done directly by DIIVINE. It requires large dimension feature spaces and because of the large number of computational features it is expensive [24]. The other method used to extract statistical features is BRISQUE method.
Natural image signal
Sensing and digitizing
Front end digital
processing Channel
Back end digital processing
Perceptual image signal
Mapping &display Test Image
International Journal of Emerging Technology and Advanced Engineering
Website: www.ijetae.com (ISSN 2250-2459,ISO 9001:2008 Certified Journal, Volume 3, Issue 2, February 2013)
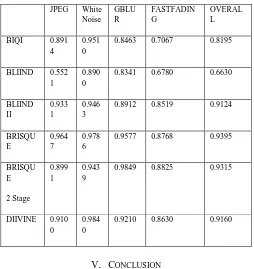
[image:6.612.42.295.306.580.2] [image:6.612.42.296.309.578.2]202 In this distortion orientation information can be obtained by using normalized luminance signals .MSCN and AGGD model is used for the processing[25].The combined effect of distortion identification and distortion specification produces an independent measure of image quality, where in BLIINDS II ,the features are extracted in DCT domain and DCT coefficients are generalized using Gaussian modeling.After the feature extraction it predict the quality score by the probabilistic model.BLIINDS II requires lower dimensional feature space and is simpler one. Disadvantage of this method is time consuming because of the computation of block statistics of DCT [26].The spearman correlation for the NR methods are shown in Table 3.
Table III
Spearman correlation for no reference algorithms
JPEG White Noise GBLU R FASTFADIN G OVERAL L
BIQI 0.891 4
0.951 0
0.8463 0.7067 0.8195
BLIIND 0.552 1
0.890 0
0.8341 0.6780 0.6630
BLIIND II 0.933 1 0.946 3
0.8912 0.8519 0.9124
BRISQU E 0.964 7 0.978 6
0.9577 0.8768 0.9395
BRISQU E 2 Stage 0.899 1 0.943 9
0.9849 0.8825 0.9315
DIIVINE 0.910 0
0.984 0
0.9210 0.8630 0.9160
V. CONCLUSION
In this paper we discussed about the various approaches used to evaluate the quality of an image. The experimental results shows that the MSE and PSNR methods are simple and are easy to implement but it does not correlate highly with human perception. Because of the large computational complexities DIIVINE method is a time consuming one. Quality assessment algorithms are needed to monitor the quality for real time applications. Subjective methods are impossible to implement in real time systems, so objective methods are more attracted in recent years. But accurate and efficient IQA measures help to enhance their applicability in real time applications.
REFERENCES
[1 ] Z. Wang, A. C. Bovik, and L. Lu, ―Why is image quality assessment so difficult,‖ in Proc. IEEE Int. Conf. Acoustics, Speech, and Signal Processing, vol. 4, Orlando, FL, May 2002, pp. 3313–3316. [2 ] Zhou wang, member, ieee, alan c. bovik, fellow, IEEE Image quality
assessment: from error visibility to structural similarity. IEEE transactions on image processing, vol. 13, no. 4, april 2004. [3 ] Judith Redi, Hantao Liub, Hani Alersb, Rodolfo Zuninoa, and Ingrid
He ―Comparing Subjective Image Quality Measurement Methods for the Creation of Public Databases‖ spie-is&t/ vol. 7529 752903-1 2010,.
[4 ] Sheikh, H. R., Wang, Z., Cormack, L., and Bovik, A. C., "LIVE
Image Quality Assessment
DatabaseRelease2,"http://live.ece.utexas.edu/research/quality/subject ive.htm (2005)
[5 ] Ponomarenko, N., Carli, C., Lukin, V., Egiazarian, K., Astola, J., Battisti, F. "Color Image Database for Evaluation of Image Quality Metrics", Proc. International Workshop on Multimedia Signal Processing 2008, 403-408 (2008).
[6 ] David M. Rouse⋆, Romuald P´epion†, Patrick Le Callet†, and Sheila S. Hemami.‖Tradeoffs in Subjective Testing Methods for Image and Video Quality Assessment‖.
[7 ] Rafał K. Mantiuk, Anna Tomaszewska, and Radosław Mantiuk. In:.‖Comparison of four subjective methods for image quality assessment Computer Graphics Forum (in print), 2012
[8 ] Atidel Lahouhou, Emmanuel Viennet and Azeddine Beghdadi Selecting Low-level Features for Image Quality Assessment by Statistical Methods Journal of Computing and Information Technology - CIT 18, 2010,
[9 ] Z.Wang, A. C. Bovik, H. R. Sheikh, and E. P. Simoncelli, ―Image quality assessment: from error visibility to structural similarity,‖ IEEE Trans. Image Process., vol. 13, no. 4, pp. 600–612, 2004. [10 ]Z. Wang and A. C. Bovik, ―A universal image quality index,‖ IEEE
Signal Process. Lett., vol. 9, no. 3, pp. 81–84, 2002.
[11 ]H. R. Sheikh, A. C. Bovik, and G. de Veciana, ―An information fidelity criterion for image quality assessment using natural scene statistics,‖ IEEE Trans. Image Process., vol. 14, no. 12, pp. 2117– 2128, 2005.
[12 ]H. R. Sheikh and A. C. Bovik, ―Image information and visual quality,‖ IEEE Trans. Image Process., vol. 15, no. 2, pp. 430–444, 2006.
[13 ]Cheng, G., Cheng, L., ―Reduced reference image quality assessment based on dual derivative priors,‖ IEEE Electronic Letters, 45(18), 937-939 (2009).
[14 ]Ciancio, A., Costa, A. L. N., Silva, E. A. B., Said, A., Samadani, R., Obrador, P., ―No-Reference Blur Assessment of Digital Pictures Based on Multifeature Classifiers,‖ IEEE Transaction on Image Processing, 20(1), 64-75 (2011).
[15 ]CPIQ Phase 1 v.1.10. ―Camera Phone Image Quality – Phase 1 – Fundamentals and review of considered test methods.‖ International Imaging Industry Association (I3A), 50 (2007).
[16 ]Q. Li and Z. Wang, ―Reduced-reference image quality assessment using divisive normalization-based image representation,‖ IEEE J. Sel. Topics Signal Process., vol. 3, no. 2, pp. 202–211, Apr. 2009. [17 ]A DCT Statistics-Based Blind Image Quality IndexMichele A. Saad,
International Journal of Emerging Technology and Advanced Engineering
Website: www.ijetae.com (ISSN 2250-2459,ISO 9001:2008 Certified Journal, Volume 3, Issue 2, February 2013)
203 [18 ]J. Caviedes and S. Gurbuz, ―No-reference sharpness metric based on
local edge kurtosis,‖ in Proc. of IEEE Int. Conf. on Image Processing, vol. 3, 2002, pp. 53–56.
[19 ]S. Suthaharan, ―No-reference visually significant blocking artifact metric for natural scene images,‖ Signal Processing, vol. 89, no. 8, pp. 1647–1652, 2009.
[20 ]M. Farias and S. Mitra, ―No-reference video quality metric based on artifact measurements,‖ in IEEE International Conference on Image Processing, vol. 3, 2005, pp. 141–144.
[21 ]A. K. Moorthy and A. C. Bovik, ―A two-step framework for constructing blind image quality indices,‖ IEEE Signal Processing Letters, vol. 17,no. 2, pp. 587–599, May 2010
[22 ]R. Barland and A. Saadane, ―A reference free quality metric for compressed images,‖ Proc. of 2nd Int. Workshop on Video Processing and Quality Metrics for Consumer Electronics, 2006. [23 ]A.K. Moorthy and A.C. Bovik. Blind image quality assessment:
From natural scene statistics to perceptual quality. IEEE Transactions on Image Processing, 2011.
[24 ]Blind/referenceless image spatial quality evaluator anish mittal, anush k. moorthy and alan c. Bovik