Optimization of Pull-Type Production Process with
Computer Aided Process Planning
Debrina Puspita Andriani1,*, Azizah Putri Nur Aini1, Intan Mardiono2, Adam Khano1
1
Department of Industrial Engineering, Brawijaya University, Malang, Indonesia
2
Department of Industrial Engineering, Institut Teknologi Sumatera, Lampung, Indonesia
Received July 15, 2019; Revised October 1, 2019; Accepted December 23, 2019
Copyright©2019 by authors, all rights reserved. Authors agree that this article remains permanently open access under the terms of the Creative Commons Attribution License 4.0 International License
Abstract
Pull type is production that is based on actual demand and requires a fast and precise manufacturing process in the system. The conventional method caused consumers‘ frequent dissatisfaction with the results and took long production times and high cost. The purpose of this study was to compare between the application for conventional methods and Computer Aided Process Planning (CAPP) method in pull-type production system. Starting with identifying the problems that exist in the results of observations in the field study, then setting the goal of improving the initial production method. Furthermore, the process was conducted by comparing production time using time study method and breaking even calculation. The results show that CAPP method obtained the reduction in the cost and time production than conventional methods.Keywords
Computer Aided Process Planning, Generative Management, Optimization, Pull-Type Production, Time Study1. Introduction
At present in the fashion industry, it is seen that most processes for making fashion production are still conventional and use the pull-type production system [1]. Conventional productions’ methods had caused consumers’ often dissatisfaction with the results, the length of time of production, and many costs incurred. Making the conventional design requires a long time, one of which is due to a lack of tools and technologies [2, 3].
Along with technological development, the emergence of an alternative form of design makes design software, results constraints that occur on the design in the fashion industry with the conventional methods that could be overcome [4]. Process planning in the fashion industry was the liaison between the activities of the design and production of
clothing. The process of producing clothes was planned to be optimal based on a variety of existing processes, so that the product could be produced at the right time with low production costs [5]. Of course, all the production processes will lead to the need for computer-based systems that can conduct this process planning function or called Computer Aided Process Planning (CAPP) [6].
This study took a case study by comparing women's shirt manufacture by implementing conventional methods and computer aided process planning (CAPP) through the design process, time, and cost required in the production process.
2. Research Methods
This research included quantitative comparative research, which provided a calculation of a number of data sets for research results, which are then analyzed and compared with real conditions and used to provide a solution [7]. This quantitative research focused on the best production process to see the time and benefits generated [8].
The first step in this research was to conduct literature and field studies to identify problems. In this study, the problems rose were the length of time and the amount of costs incurred for the production process with conventional methods, so the proposed methods were required to overcome these problems. The proposed method was the use of computer aided process planning (CAPP), while the parameters analyzed in this study were the time and cost of the production process.
Universal Journal of Mechanical Engineering 7(6B): 6-11, 2019 7
CAD is a technology related to the use of computer systems to assist in the creation, modification, analysis, and optimization of designs [9, 10]. Any computer program that activates graphic systems and application programs that facilitate the functions of engineering in the design process can be classified as CAD software [11, 12]. CAD is everything that is related to the creation of designs whose processes are assisted by computers [13-15].
Design making turned out to be quite broad meaning, starting from collecting ideas, sketching (concepts), making models, making detailed drawings, analyzing designs, to making simulations and animations [16, 17]. The tools used are tools for creating, changing attributes, and rendering. Marvelous Designer 3 software is one of the CAD softwares that is used to be able to assist in solving existing problems. This software has a function to facilitate the process of making clothes and can increase customer satisfaction ordering because it has a function in giving a real view of how the clothing looks. In addition, the presence of 3D and simulation will make it easier to provide descriptions to both consumers and other process units [18].
The CAPP development method is categorized into three main methods, which are variant, generative, and semi-generative methods [19]. The methods in this study included generative methods that were generated through decision logic, formulation, search, algorithms and geometric based data [20, 21]. The input of this method was the design using a CAD system. Generally, the format of the CAPP system input can be divided into two categories [22]. The first category is input text, where the user answers a number of questions (defined as interactive input). The second category is graphical input, where part data is taken through the CAD module.
3. Results and Discussion
At this stage, data processing was conducted in accordance with the research steps described earlier. This data processing was done to overcome and find solutions for the problem.
3.1. Production Process
Based on the OPC, it was known that in the production process by conventional methods resulted in the operation, inspection, and a combination of 15, 6, and 15 activities and demonstrated the entire process time of 338 minutes or 5 hours 58 minutes.
The groove design manufacture used known conventional methods to make the production process should be conducted after the manufacture of the design stage, take more time to design and manufacture the consumer's consent. The production process can be worked after the design process, so it took a long time for each process.
3.2. Computer Aided Process Planning (CAPP)
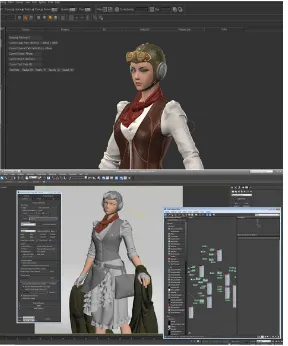
The application with the CAPP method was discovered to produce processes for operations, inspections, and combinations of 5, 1, and 25 activities and production time of 2 hours 5 minutes. The process of making designs on CAPP method performed using a CAD system from Marvelous Designer 3 software that can be seen in Fig. 1.
Figure 1. Design Using a CAD System
3.3. Production Cost
The calculation of the cost was used to determine the profits on goods and services [23]. Cost calculation was conducted on the Fixed Cost (FC), Variable Cost (VC) and Total Cost (TC) [24-26]. The equation for calculating total production costs is Eq. 1.
𝑇𝐶=𝐹𝐶+𝑉𝐶 (1)
3.3.1. Cost Calculations with Conventional Methods Details of the cost components for conventional methods and CAPP are shown in Table 1. By using Eq. 1, the calculation of the costs required by using the conventional method to produce 100 orders divided into 20 pieces for each different size is as follows:
TC = ((800.000×12)×3) + (50.000×48) + (150.000×12) + (50.000×4) + (200.000×48) + (10.000×100) + (150.000×12) + (50.000×4) + ((54.500×20) + (59.000×20) + (63.000×20) +
(64.500×20) + (66.000×20)) TC = Rp 51.940.000/year TC = Rp 4.328.333,333/ month
For the production of women's shirts with sizes of S, M, L, XL, and XXL, it required a fee of Rp. 4,328,333,333 per
month or Rp. 51,940,000 per year. Furthermore, the profit analysis of conventional methods was conducted by using BEP analysis per unit. BEP per unit was achieved when 1,346 shirts will have been sold with a total cost of Rp. 134,559,585.5.
3.3.2. Cost Calculations with CAPP Methods
The same calculation based on Table 1 was conducted for different cost details using the CAPP method as follows:
TC = ((800.000×12)×3) + (50.000×48) + (150.000×12) + (50.000×4) + (220.000×48) + (150.000×12) + (50.000×4) +
((51.500×20) + (55.500×20) + (59.500×20) + (62.500×20) + (64.000×20))
TC = Rp 51.620.000/year TC = Rp 4.301.666,667/ month
Universal Journal of Mechanical Engineering 7(6B): 6-11, 2019 9
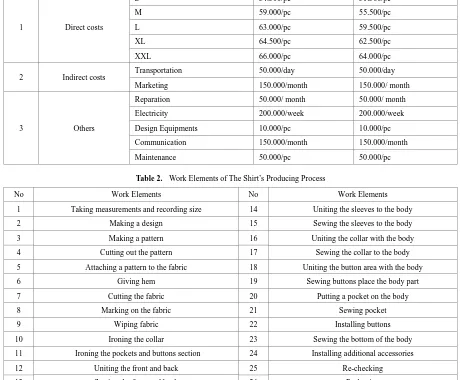
Table 1. The Detail of Cost Components
No Type of costs Explanation Costs (in Rupiah)
Conventional CAPP
1 Direct costs
S 54.500/pc 51.500/pc
M 59.000/pc 55.500/pc
L 63.000/pc 59.500/pc
XL 64.500/pc 62.500/pc
XXL 66.000/pc 64.000/pc
2 Indirect costs Transportation 50.000/day 50.000/day
Marketing 150.000/month 150.000/ month
3 Others
Reparation 50.000/ month 50.000/ month
Electricity 200.000/week 200.000/week
Design Equipments 10.000/pc 10.000/pc
Communication 150.000/month 150.000/month
[image:4.595.74.534.129.509.2]Maintenance 50.000/pc 50.000/pc
Table 2. Work Elements of The Shirt’s Producing Process
No Work Elements No Work Elements
1 Taking measurements and recording size 14 Uniting the sleeves to the body
2 Making a design 15 Sewing the sleeves to the body
3 Making a pattern 16 Uniting the collar with the body
4 Cutting out the pattern 17 Sewing the collar to the body
5 Attaching a pattern to the fabric 18 Uniting the button area with the body
6 Giving hem 19 Sewing buttons place the body part
7 Cutting the fabric 20 Putting a pocket on the body
8 Marking on the fabric 21 Sewing pocket
9 Wiping fabric 22 Installing buttons
10 Ironing the collar 23 Sewing the bottom of the body
11 Ironing the pockets and buttons section 24 Installing additional accessories
12 Uniting the front and back 25 Re-checking
13 Sewing the front and back 26 Packaging
3.4. Production Time
In this study, an analysis was conducted to determine the most minimal time generated by determining the sequence of work or work elements between conventional methods and CAPP in a continuous production process. The analysis was conducted using a time study with continuous timing method [27]. The own time study is a way to measure a person's performance by using a stopwatch or a tool to determine the time needed to complete a job [28, 29]. Table 2 shows work elements that are measured in this study both conventional and CAPP methods.
3.4.1. Time Study with Conventional Methods
The calculation of time with conventional methods in the production process was obtained from 30 times the data collection in each production process by giving
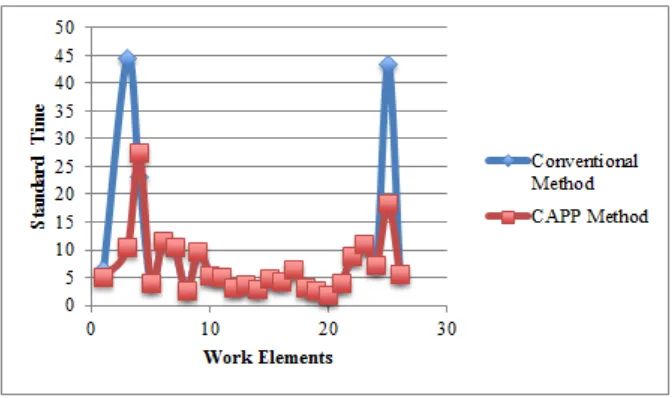
concessions of 7.5% because the work carried out with a working position on a table with an equivalent load of around 0-2.25 kg can be seen in Fig. 2. The time for the production of a women's shirt with conventional methods from the beginning of measurement to packaging took 482.14 minutes or 8 hours.
3.4.2. Time Study with CAPP Methods
Figure 2. Standard Time for Conventional and CAPP Method.
3.5. Next Comparison between Conventional Method with CAPP
From the results of the analysis, it could be seen that the comparison between design and conventional method and the CAPP method. Comparison of the results discovered that the use of the CAPP method had a better advantage on the element of accuracy, conformity with tangible results, the accuracy between the design with the final results, visualization, and time compared to conventional methods. While the cost of raw materials with the CAPP method was more expensive than the conventional method, this was because the CAPP method required additional investment by purchasing Marvelous Designer software at the beginning, but it could be used for the long term and profits will have been covered when selling 1,429 units. The difference in BEP (units) between conventional methods and CAPP methods was 83 units with a difference in costs of Rp. 1,237,083.00, which did not mean the use of the CAPP method results in greater costs for the next production stage, because the results of time calculation state that the use of the CAPP method could save time by 2 hours 3 minutes, so the costs required in production in the following year would be smaller by using the CAPP method compared to using conventional methods that would increase due to rising prices of raw materials to purchase design tools.
4. Conclusions
The results of applying the CAPP method in this study could be assessed from the cost and time of production. Based on a cost perspective, the CAPP method costs were greater than the conventional method, because the use of the CAPP method required additional investment, Marvelous Designer software, at the beginning of the
purchase but could be used for the long term and profits will have been covered when 1,429 units are sold.
Building upon a time perspective with a time study analysis, it was known that there were differences in time of 140.11 minutes or 2.34 hours between conventional methods and CAD systems in the CAPP method that combined the process of making designs and making patterns into a single unit, where the CAPP method was faster. In addition to time and cost, the use of the CAPP method had a better advantage in the element of accuracy, conformity with tangible results, accuracy between design and final results, and visualization compared to conventional methods. Therefore, CAPP implementation on pulling type production process was very effective to implement in pull-type production process.
Acknowledgements
This work was supported by Department of Industrial Engineering, Universitas Brawijaya and Department of Industrial Engineering, Institut Teknologi Sumatera.
REFERENCES
[1] Park M, Yoo J. Benefits of mass customized products: moderating role of product involvement and fashion innovativeness. Heliyon, 4, e00537, 2018.
[2] Yao Y, Xu Y. Dynamic decision making in mass customization. Computers & Industrial Engineering, 120, 129–136, 2018.
Universal Journal of Mechanical Engineering 7(6B): 6-11, 2019 11
[4] Grieco A, Caricato P, Gianfreda D. An Industry 4.0 case study in fashion manufacturing. Procedia Manufacturing, 11, 871 – 877, 2017.
[5] Dong B, Jia H, Li Z, Dong K. Implementing Mass Customization in Garment Industry. Systems Engineering Procedia, 3, 372 – 380, 2012.
[6] Marri HB, Gunasekaran A, Grieve RJ. Computer-Aided Process Planning: A State of Art. Int J Adv Manuf Technol, Vol. 14, 261-268, 1998.
[7] Sugiyono. Metode Penelitian Kuantitatif Kualitatif dan R&D. Jakarta: Alfabeta; 2012.
[8] Andriani DP, Zamroni MH, Alesi TC, & Rahman F. The Layout Optimization of Production Process Facilities in Apple Processing to Improve Productivity and Sustainability SMEs. 6th IEEE International Conference on Advanced Logistics and Transport (ICALT), 184-188, 2018.
[9] Cingi CC. Computer aided education. Procedia - Social and Behavioral Sciences, 103, 220 – 229, 2013.
[10]Becker JMJ, Wits WW. Enabling Lean Design Through Computer Aided Synthesis: The Injection Moulding Cooling Case. Procedia CIRP, 37, 260 – 264, 2015. [11]Bogusch R, Lohmann B, Marquardt W. Computer-aided
process modeling with MODKIT. Computers and Chemical Engineering, Vol. 25, 963–995, 2001.
[12]Kutin A, Dolgov V, Sedykh M, Ivashin S. Integration of different computer-aided systems in product designing and process planning on digital manufacturing. Procedia CIRP, 67, 476 – 481, 2018.
[13]Islamoglu OS, Deger KO. The location of computer aided drawing and hand drawing on design and presentation in the interior design education. Procedia - Social and Behavioral Sciences, 182, 607 – 612, 2015.
[14]Açici FK, Sönmez E. The Place of Hand Drawing and Computer Aided Design in Interior Design Education. Procedia - Social and Behavioral Sciences, 143, 716 – 720, 2014.
[15]Daemei AB, Safari H. Factors affecting creativity in the architectural education process based on computer-aided design. Frontiers of Architectural Research, Vol. 7, 100– 106, 2018.
[16]Lundgren M, Hedlind M, Kjellberg T. Model Driven Manufacturing Process Design and Managing Quality. Procedia CIRP, 50, 299 – 304, 2016.
[17]Sugiono, Widhayanuriyawan D, Andriani DP. The impact of road complexity on the psychophysiological load experienced by car drivers using electroencephalography (EEG) measurement of brainwaves. Acta Neuropsychologica, Vol. 16, No. 4, 361-374, 2018. [18]Can FC, Lapcin O, Ayan B, Cevik M. Human Machine
Interface Design for a 3 DoF Robot Manipulator. Universal Journal of Mechanical Engineering, Vol. 6, No. 3, 47-53, 2018.
[19]Gawlik E. The Analysis of Methods for Computer Aided Process Planning, Poland: Cracow University of Technology Cracow, 2002.
[20]Reichler A, Gerbers R, Falkenberg P, Turk E, Dietrich F, Vietor T, Droder K. Incremental Manufacturing: Model-based part design and process planning for Hybrid Manufacturing of multi-material parts. Procedia CIRP, 79, 107-112, 2019.
[21]Zhang F, Zhang YF, Nee AYC. Using Genetic Algorithms in Process Planning for Job Shop Machining. IEEE Transactions on Evolutionary Computation, Vol. 1, No. 4, 1997.
[22]Kardos C, Vancza J. Application of generic CAD models for supporting feature based assembly process planning. Procedia CIRP, 67, 446 – 451, 2018.
[23]Zahabiyah R, Andriani DP. Analisis Kelayakan Investasi Pembelian Truk Sebagai Armada Transportasi Pengiriman Produk Pada PT Jaya Beton Indonesia. Jurnal Rekayasa dan Manajemen Sistem Industri, Vol. 7, No. 2, 10-22, 2019. [24]Chougule PD, Kumar S, Raval HK. Relating Product
Manufacturing Decisions to Environmental and Cost Performance Using CAPP. Procedia Materials Science, 6, 476 – 481, 2014.
[25]Kahlert A, Giljohann S, Klingauf U. Cost-benefit Analysis and Specification of Component-level PHM Systems in Aircraft. Universal Journal of Mechanical Engineering, Vol. 4, No. 4, 88-98, 2016.
[26]Zong Y, Mao J. Tolerance optimization design based on the manufacturing-costs of assembly quality. Procedia CIRP, 27, 324 – 329, 2015.
[27]Pakpahan BM, Tama IP, Andriani DP. Penentuan Jumlah Operator Optimal pada Pengalengan Jamur dengan Stopwatch Time Study dan Workload Analysis (Studi Kasus: PT Eka Timur Raya). Jurnal Rekayasa dan Manajemen Sistem Industri, Vol. 3, No. 8, 1686-1695, 2015.
[28]Andriani DP. Penentuan Waktu dan Output Baku pada Proses Produksi Tube Lamp Dengan Methods Time Measurement. SINERGI, Vol. 21, No. 3, 204-212, 2017. [29]Andriani DP. Penentuan Rating Performance & Allowance