Analysis of Location Selection of Fish Collection Center
Using Ahp Method in National Fish Logistic System
Verani Hartati
1,2,*, Fharidaty Aprilia Islamiati
11Industrial Engineering, Faculty of Engineering, Widyatama University, Indonesia 2Logistics and Supply Chain Center, Widyatama University, Indonesia
Copyright©2019 by authors, all rights reserved. Authors agree that this article remains permanently open access under the terms of the Creative Commons Attribution License 4.0 International License
Abstract
Indonesia is an archipelagic country that has a sea area of approximately 70% compared to land, with fisheries production reaching 20.72 million tons per year. Ministry of Maritime Affairs and Fisheries of the Republic of Indonesia (MMF) stated the regulation Number 5/KP/2014, on National Fish Logistics System (NFLS). Referring to the regulation then made fish collection center (FCC) site selection, which aims to optimize the supply chain system of fish. Thus, it is expected that prices at the producer level and consumer level will be more stable, and provide guarantees for the procurement, storage, transportation, and distribution of fish and fishery products for the needs of the community. Determination of FCC location requires the selection of criteria on the basis that the location, infrastructure, and supply. A method analytical hierarchy processes (AHP) is used to compare between criteria so that the level of importance is known. The location is an alternative as the location of the fish collection center, namely Ocean Fisheries Port (OFP) and Nusantara Fisheries Port (NFP). The ports are clustered based on the port which is passed by the sea toll so that there are 4 lane clusters. Determining the location criteria for each port is done by looking for the x and y coordinate points using the Center of Gravity (COG) method, then the distance between the points of the COG location and the point of location of the port is measured. The results of the distance measurements are carried out by frequency distribution to determine the location criteria for each port and the criteria for infrastructure and supply of each port by accumulating criteria for each port. Weighting each criterion comparison methods AHP is based on the opinions of four respondents who are experts on NFLS. The results are obtained FCC on each cluster, namely cluster 1 on Ambon NFP, Cluster 4 on Kejawanan Cirebon NFP, Cluster 5 on Ternate NFP, and Cluster 6 on Sibolga NFP.Keywords
AHP, National Fish Logistics System, Selection of Location1. Preliminary
Indonesia is an archipelagic country that has a sea area with an area of approximately 70% compared to land. Fisheries production in 2014 reached 20.72 million tons, consisting of capture fisheries production of 6.72 million tons and aquaculture production of 14.52 million tons. This makes Indonesia has a huge potential of marine and fisheries resources to be developed. Marine and fisheries resources have the potential to be the main driver of the national economy and a source of food for human needs. The maritime and fisheries sector is very much needed for its role in improving community welfare.
Ministry of Maritime Affairs and Fisheries (MMAF) determined Regulation of the Minister of Marine and Fisheries of Indonesia Number 5/KP/2014 on National Fish Logistics System. Referring to the Ministerial Regulation, the location of the fish collection center is conducted, which aims to provide guarantees for the procurement, storage, transportation and distribution of fish and fishery products for the needs of the community and the fish processing industry. The choice of the location of the fish collection center acts as a counterweight to the supply chain system so that the purchase price at the producer level will increase and the price of sales at the consumer level is more stable.
42 Analysis of Location Selection of Fish Collection Center Using Ahp Method in National Fish Logistic System
fishing vessels that carry out fishing activities in Indonesian waters and the Indonesian Exclusive Economic Zone.
The choice of location for collecting fish uses clustering based on the division of the sea toll. Sea toll lanes are used to facilitate connecting between ports and the logistics distribution process to be evenly distributed throughout Indonesia. The results of this study can be used as a material for Government input in making policy on developing facilities and infrastructure to support fish availability at the collection center.
2. Literature Review
Supply Chain Management (SCM) or supply chain management is a set of methods and approaches to improve integrity and efficiency between suppliers, manufacturers, warehouses, and stores so that merchandise can be produced and distributed accurately both in terms of quantity, location and time (Levi, 2000; Aderinola, et.al. 2012; Aberoumand, 2014; Prakash, et.al. 2014 ; Baba, Sanchi & Manga, 2015).
SCM has actually been known for several years and is integrated with logistics. SCM confirms the interaction between marketing functions, production in a company. Utilizing the opportunity to improve services and reduce costs can be done through coordination and cooperation between the procurement of raw materials and distribution (Indrajit & Djokopranoto, 2002).
This is related to supply chain activities that are indirectly controlled by logistics activities. At present, it is undeniable that large and small companies must carry out logistics activities, both logistical within the company and outside the company. Channels of raw material supplies to the distribution of finished goods are in dire need of logistics (Siagian, 2005). These activities include traditional purchasing functions plus other important activities that relate between suppliers and distributors.
The component of SCM according to (Turban, 2004) consists of three main components, namely Upstream Supply Chain which includes the activities of a manufacturing company with its suppliers and the
relationships between suppliers. Supplier relationships can be extended to several parts, starting with raw materials to finished goods. The main activity in the upstream supply chain is procurement. The second component is the Internal Supply Chain which includes all in house processes used in transforming inputs from suppliers into the manufacturing process. In the main internal supply chain activities carried out are the production, fabrication, and control of inventory. The last component is a downstream supply chain which includes all activities that involve the delivery of products to end customers. In the downstream supply chain, attention is directed to distribution, transportation warehousing, and after-sale service.
2.1. National Fish Logistics System
Regulation Number 5/KP/2014 explains that NFSL is a fish supply chain management system and fishery products as well as information ranging from procurement, storage, transportation to distribution, as a unity of policies to increase capacity and stabilize upstream-downstream fisheries production systems, control disparities and price stabilization, and to meet domestic consumption needs.
The purpose of NFSL is 1) Increasing the capacity and stabilization of the national fisheries production and marketing system; 2) Strengthening and expanding connectivity between upstream production centers, downstream production and marketing efficiently; 3) Improve the efficiency of fish supply chain management, materials, production equipment and information from upstream to downstream. Meanwhile NFSL component is same as the logistics system in general, which include purchasing process, storage, transportation, and distribution.
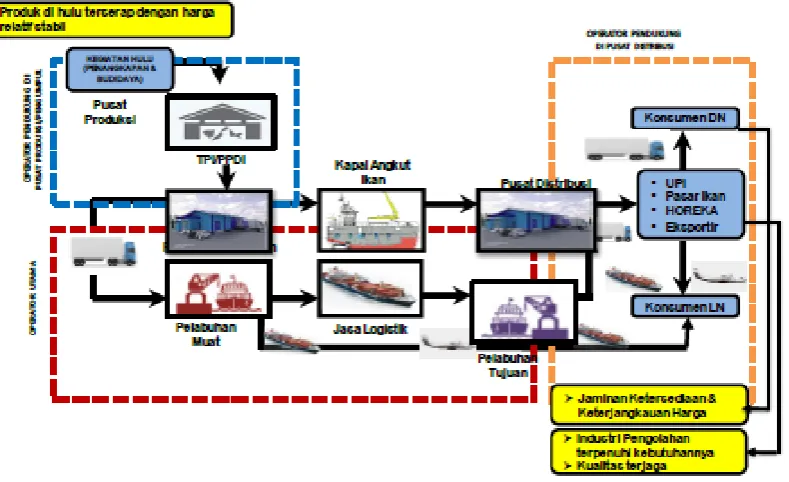
Source: Directorate General of Strengthening Competitiveness of Marine and Fishery Products, KPP, 2016 Figure 1. NFSL Operational Scheme
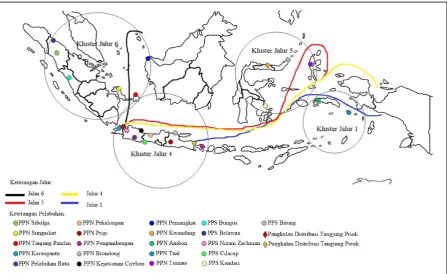
[image:3.595.86.512.389.645.2]Source: Kominfo.go.id, 2017
Figure 2. Sea Toll Road
2.2. Sea Toll Road Program
Many people view the sea as a land separator. Perspectives from the mainland's eyes have made us alienated and less utilizing the strength of the sea. This understanding gave rise to the idea of the sea toll. The sea
44 Analysis of Location Selection of Fish Collection Center Using Ahp Method in National Fish Logistic System
Figure 2 shows six sea toll lanes that connect between ports. The Ministry of Transportation in 2016 launched 6 scheduled sea transport routes that will connect large and small ports throughout the country to transport logistics and community needs.
The aim of the Sea Toll program is to move the economy wheel efficiently and evenly. One day there will be a big ship that will go back and forth in the Indonesian sea, so the logistics costs will be cheap. That is why sea toll is one of President Jokowi's priority programs to develop the maritime sector. One supporting factor is the need for a deep sea port to provide a way for large vessels to cross the Sabang to Merauke route.
The Sea Toll Road is a track that stretches for 5,000 kilometers or one-eighth around the earth. The ideas on the Sea Toll program include 1) the establishment of a national maritime logistics system; 2) Creating equitable development; 3) Ensure economic connectivity between islands; 4) Streamline the distribution of goods, and 5) Suppress the price disparity. Aspects of the sea toll program include sea transportation aspects, port aspects, and shipping safety and security aspects.
2.3. Analytical Hierarchy Processes
The Analytical Hierarchy Processes (AHP) method was developed by Thomas L. Saaty, a mathematician. AHP methods help solve complex problems by structuring a hierarchy of criteria, interested parties, results and by attracting various considerations to develop weights or priorities. This method also combines the strengths of the feelings and logic involved in various problems, then synthesizes various diverse considerations into results that match our estimates intuitively as presented in the considerations that have been made (Saaty, 2005).
AHP method is carried out with the following steps (Suryadi, 1998):
1. Define the problem and determine the desired solution. In this stage, we try to determine the problem that we will solve clearly, in detail and easily understood.
2. Make a hierarchical structure that starts with the main goal. After arranging the main goal as the top level, a hierarchy level will be arranged below, namely, the criteria that are suitable to consider or assess the alternatives we provide and determine these alternatives. Each criterion has a different intensity. The hierarchy is continued with sub-criteria (if possible).
3. Make pairwise comparison matrices. The matrix used is simple, has a strong position for a framework of consistency, obtains other information that may be needed with all possible comparisons and is able to analyze the sensitivity of the overall priority for changing considerations.
4. Perform and define paired comparisons. The results of the comparison of each element will be a number
from 1 to 9 which shows a comparison of the importance of an element. The scale of the comparison of pairs and their meanings introduced by Saaty are as follows:
Intensity of Interest
1 = Both elements are equally important, Two elements have the same effect;
3 = The one element is slightly more important than the other elements, Experience and assessment support a single element slightly compared to the other elements;
5 = The one element is slightly more important than the other elements, Experience and assessment support a single element slightly compared to the other elements;
7 = One element is more important than the other, Experience and judgment strongly support one element compared to the other;
9 = One element is clearly more important than the other elements, One element that is strongly supported and dominant is seen in practice;
2,4,6,8 = Values between two values of adjacent considerations, This value is given if there are two compromises between 2 choices;
Reverse = If for activity i get one number compared to activity j, then j has the opposite value compared to i.
5. Calculate the eigenvalue and test its consistency, if it is not consistent then the data retrieval is repeated. Count steps 3, 4 and 5 for all levels of the hierarchy. 6. Calculate the eigenvector of each pairwise
comparison matrix which is the weight of each element for prioritizing elements at the lowest hierarchy level until it reaches the goal.
7. Check hierarchy consistency. What is measured in AHP is the consistency ratio by looking at the consistency index. The expected consistency is near perfect so as to produce a decision that is almost valid. Although it is difficult to achieve perfect, the consistency ratio is expected to be less than or equal to 10%.
3. Research Methods
The data processing phase is carried out by researchers to resolve and correct the problems that have been studied. The steps taken in processing data are:
Determine clustering or grouping of ports based on the sea toll;
Determine the value of the location criteria using
Determine the criteria for infrastructure
Determine the value of supply criteria
Comparison of criteria for pairs that refer to the intensity of interests
Figure 3. Distribution of Port Locations Based on the Lau Toll Road t
4. Discussion
4.1. Determination of Port Clustering
Clustering is used to group ports into clusters or groups. Clustering at ports based on the distribution of sea toll lanes that have been determined by the Government. The clustering of the location of Ocean and Archipelago Fisheries Ports is divided into four parts of the sea toll lane cluster including the following:
1. Cluster Line 1: The intended port is Ambon Port and Tual Port. Capacity on 115 TEUS toll lanes and with a distance of 5.456 miles.
2. Cluster Line 4: The intended port is Karangantu, Pelabuhan Ratu, Pekalongan, Prigi, Kejawanan Cirebon, Brondong, Nizam Zachman, Pengambengan, and Cilacap Port. Capacity on 350 TEUS toll lanes and with a distance of 4.644 miles.
3. Cluster Line 5: The ports in question are Kwandang, Kendari, Bitung, and Ternate Ports. Capacity on 350 TEUS toll lanes and with a distance of 2.608 miles. 4. Cluster Line 6: The ports in question are Sibolga
Sungailiat Port, Tanjung Pandan, Belawan, Bungus, and Pemangkat. Capacity on toll lane 5.000 tons and with a distance of 1.400 miles.
Distribution of these clusters facilitates the selection of the location of the fish collection center. Figure 3 shows the distribution of locations based on the sea toll cluster clustering
4.2.1. Determination of Location Criteria Values
Determining the value of location criteria is carried out by the following stages:
1. Determine point location of the Center of Gravity (COG) in each cluster. The data used is the data point coordinates X and Y at each port, and the volume of fisheries production at each port. The formula used is as follows:
𝐽𝐽 =∑ 𝐵𝐵∑ 𝐵𝐵𝑖𝑖𝐽𝐽𝑖𝑖
𝑖𝑖
Where :
Bi: Production volume (tons)
Ji: coordinate from point i
Example of COG calculation for Cluster 1 which covers the ports of Ambon and Tual
𝐽𝐽𝑥𝑥=∑(−3.67𝑥𝑥68397) + (−5.63𝑥𝑥21217)∑(68397 + 21217)
𝐽𝐽𝑥𝑥= −4.13
𝐽𝐽𝑦𝑦=∑(128.18𝑥𝑥68397) + (132.74𝑥𝑥21217)∑(68397 + 21217)
𝐽𝐽𝑥𝑥= 129.26
The results of the COG point on each cluster of the sea toll lane are then searched through Google maps to find out where the COG is located. The results of the COG location in each cluster are as follows:
a Cluster 1
46 Analysis of Location Selection of Fish Collection Center Using Ahp Method in National Fish Logistic System
show locations in the Banda Sea. b Line Cluster 4
The results of the COG point at point -6.93 and 109.64 show locations in the Java Sea.
c Line Cluster 5
The COG point results at points 0.59 and 124.86 show locations in the Maluku Sea.
d Line Cluster 6
The COG point results at points 2.51 and 101.16 show locations in the Malacca Strait.
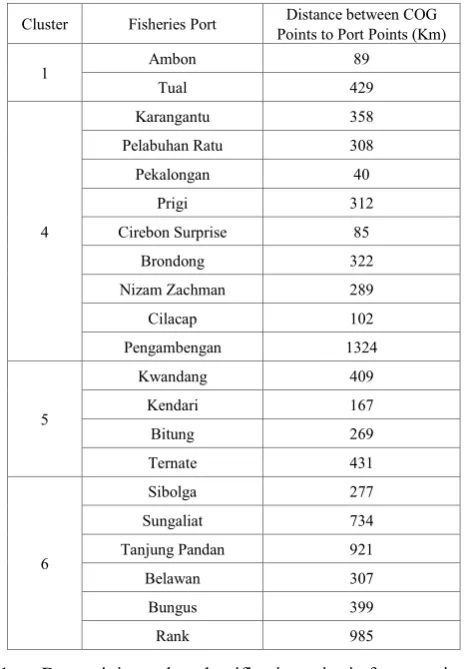
2. Next, determine the distance between the point of the port location and the COG point in each cluster of the sea toll. Table 1 shows the results of processing the distance between the COG Points to the Port Points. 3. Determining value classification criteria for grouping
[image:6.595.304.538.315.636.2]data was conducted by the COG distance between the points to the harbor. This data grouping uses the Frequency Distribution method. This step is intended to determine the location criteria based on the shortest distance between the COG points to the port. Table 2 shows the classification of values on location criteria.
Table 1. The distance between COG Points to Port Points
Cluster Fisheries Port Points to Port Points (Km)Distance between COG
1 Ambon 89
Tual 429
4
Karangantu 358
Pelabuhan Ratu 308
Pekalongan 40
Prigi 312
Cirebon Surprise 85
Brondong 322
Nizam Zachman 289
Cilacap 102
Pengambengan 1324
5
Kwandang 409
Kendari 167
Bitung 269
Ternate 431
6
Sibolga 277
Sungaliat 734
Tanjung Pandan 921
Belawan 307
Bungus 399
Rank 985
1. Determining value classification criteria for grouping data was conducted by the COG distance between the point to the harbor. This data grouping uses the Frequency Distribution method. This step is intended
[image:6.595.61.290.376.708.2]to determine the location criteria based on the shortest distance between the COG points to the port. Table 2 shows the classification of values on location criteria.
Table 2. Location Criteria Value Classification
Distance between ports to COG (Km) Value
40-253 6
254-467 5
468-681 4
682-895 3
896-1.109 2
1.110-1.324 1
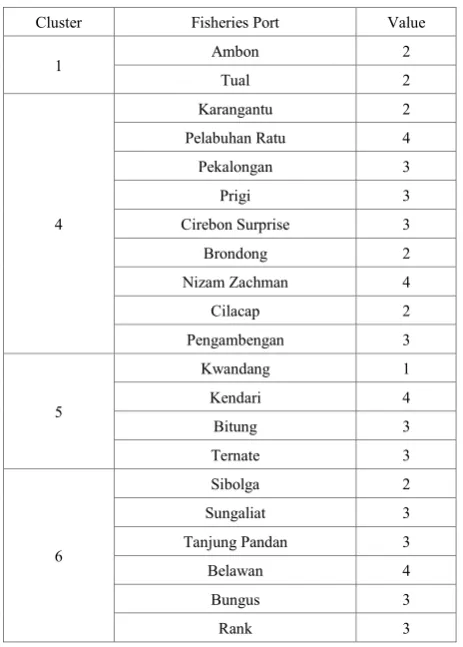
2. Determine the value of location criteria for each port. By giving a score based on the classification of the values set in the previous step. Table 3 shows the location criteria for each port.
Table 3. Value of Location Criteria for Each Port
Cluster Fisheries Port Value
1 Ambon 6
Tual 5
4
Karangantu 5
Pelabuhan Ratu 5
Pekalongan 6
Prigi 5
Cirebon Surprise 6
Brondong 5
Nizam Zachman 5
Cilacap 6
Pengambengan 1
5
Kwandang 5
Kendari 6
Bitung 5
Ternate 5
6
Sibolga 6
Sungaliat 3
Tanjung Pandan 2
Belawan 5
Bungus 5
Rank 2
4.2.2. Determination of Infrastructure Criteria Value Determination of the value of port criteria is carried out based on Article 16 of Regulation Number 5/KP/2014 that adequate infrastructure must be available. Sach ports should have the infrastructure facilities supporting fishing p and proses roses logistics. These facilities are based on Ministerial Regulation Number 8/KP/2012 article 4 is: 1. The main facilities are nine, including:
[image:6.595.57.291.377.712.2]Groin, pier, jetty, swimming harbors, shipping lanes, roads, and land.
2. Eight functional facilities, including:
Marketing of fishery products, navigation and communication navigation, guidance and testing of fisheries quality results, maintenance of ships and fishing equipment, handling and testing of the results of fisheries, offices, transportation, and waste processing.
3. Supporting facilities are six, including:
Meeting hall for fishermen, operator rooms, fishing houses, social and public, shops, and guard posts.
[image:7.595.305.539.221.542.2]So that the number of facility infrastructures owned is a maximum of 23 types of facilities. Based on secondary data, it can be seen the amount of infrastructure owned by each port. Then the data are grouped using the frequency distribution method in order to obtain the classification of infrastructure criteria values, as is done in determining the value of the previous criteria. With the same procedure, the infrastructure criteria for each port are obtained in Table 4.
Table 4. Value of Infrastructure Criteria in Each Port
Cluster Fisheries Port Value
1 Ambon 2
Tual 2
4
Karangantu 2
Pelabuhan Ratu 4
Pekalongan 3
Prigi 3
Cirebon Surprise 3
Brondong 2
Nizam Zachman 4
Cilacap 2
Pengambengan 3
5
Kwandang 1
Kendari 4
Bitung 3
Ternate 3
6
Sibolga 2
Sungaliat 3
Tanjung Pandan 3
Belawan 4
Bungus 3
Rank 3
4.2.3. Determination of Value of Supply Criteria
Supply in each port must have at least 5 supplies to support the function of the fishing port, as determined by
the KPP through Article 16 of the KP-KP / 2014 Regulation. Supplies include available electricity supplies, clean water, fish auction sites, fuel oil (BBM), and ice (Cold Storage). Based on secondary data, it can be seen the amount of supply owned by each port. Then the data is grouped using the frequency distribution method in order to obtain the classification of supply criteria, as is done in determining the value of the previous criteria. With the same procedure, the value of the supply criteria is obtained at each port presented in table 5.
Table 5. Supply Criteria Value for each Port
Cluster Fisheries Port Value
1 Ambon 2
Tual 2
4
Karangantu 2
Pelabuhan Ratu 4
Pekalongan 3
Prigi 3
Cirebon Surprise 3
Brondong 2
Nizam Zachman 4
Cilacap 2
Pengambengan 3
5
Kwandang 1
Kendari 4
Bitung 3
Ternate 3
6
Sibolga 2
Sungaliat 3
Tanjung Pandan 3
Belawan 4
Bungus 3
Rank 3
4.2.4. Comparison of Pairing Criteria
This study uses the AHP method with Expert Choice software. The use of Software Expert Choice begins with creating a Hierarchy Diagram to provide information on linkages and paths between criteria. Figure 4 shows the hierarchy program on the criteria.
[image:7.595.59.291.339.663.2]48 Analysis of Location Selection of Fish Collection Center Using Ahp Method in National Fish Logistic System
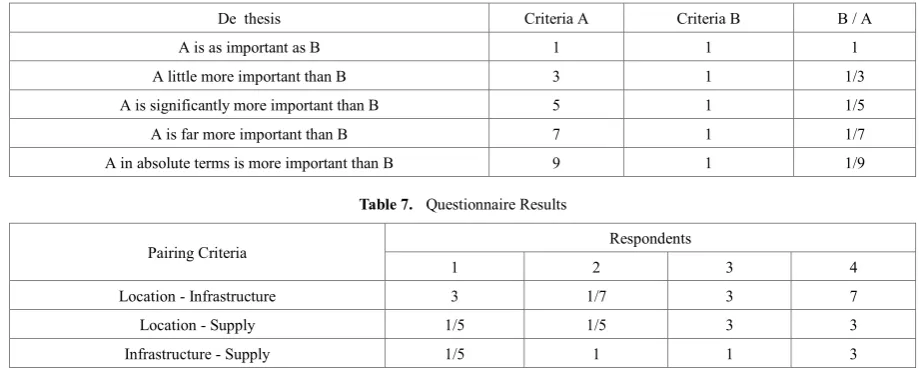
Table 6. Pairwise Interpretation of Comparations in AHP
De thesis Criteria A Criteria B B / A
A is as important as B 1 1 1
A little more important than B 3 1 1/3
A is significantly more important than B 5 1 1/5
A is far more important than B 7 1 1/7
[image:8.595.66.526.91.276.2]A in absolute terms is more important than B 9 1 1/9
Table 7. Questionnaire Results
Pairing Criteria Respondents
1 2 3 4
Location - Infrastructure 3 1/7 3 7
Location - Supply 1/5 1/5 3 3
Infrastructure - Supply 1/5 1 1 3
The process of weighting criteria in this study was given by respondents who using a questionnaire. This questionnaire involved four respondents in which 1 respondent was the distribution management staff of the Logistics Directorate. Directorate General of PDSPKP, 1 respondent was Chairman of Supply Chain Indonesia (SCI), and 2 respondents were NFSL reviewers. Respondents gave weights to pairwise comparison criteria on criteria. Overall there are 9 numbers that might be given as a scale of comparison with interpretation as presented in Table 6.
Questionnaireresults from4 respondents can be seen in Table 7
The results of the questionnaire for each respondent were then processed using Expert Choice software. The first thing is to enter the respondent's data in a comparison of criteria in pairs between the location and the infrastructure. The results obtained are in the form of criteria based on the order of importance, namely the supply criteria with a weight of 0.374, locations weighing 0.363, and infrastructure with a weight of 0.263.
4.2.5. Determining the Location of a Fish Collection Center for Each Line Cluster
Determining the location of the fish collection center in this study using weighting. Weighting is done by using the results of pairwise comparisons between criteria that have been done in the previous processing using expert choice software. The results of these comparisons are obtained by weight to determine the location of the fish collection center.
Obtained location weighting criteria of 36.3%, infrastructure 26.3% and supply 37.4% with a total of 100%. The weight obtained is then processed with the criteria value at each port. The calculation results show that (Sinaga et al., 2019):
Cluster 1, the highest value of 3,826 for Ambon Harbor;
Cluster 4, the highest value of 4, 089 for Cirebon Kejawanan Ports;
Cluster 5, the highest value of 4, 352 for Kendari Port;
Cluster 6, the highest value of 3,826 for Sibolga Port.
5. Conclusions
Determining the location of the fish collection center based on the sea toll road cluster and by considering the criteria for location, infrastructure, and supply, the following results were obtained (Saudi et al., 2019):
Cluster 1, the location of fish collection center at Ambon Harbor;
Cluster 4, the location of fish collection centers in Cirebon Kejawanan Port;
Cluster 5, the location of fish collection center in Kendari Port;
Cluster 6, the location of fish collection center in Sibolga Port.
The results of this study are expected to help the government in determining the location of fish collection in the National Fish Logistics System.
REFERENCES
[1] Aberoumand, A. (2014). Nutritional Properties of Some Novel Selected Fish Species in Khuzestan Province, Iran. Journal of Food Technology Research, 1(1), 52-59. [2] Aderinola, O. J., Kusemiju, V., & Clarke, E. O. (2012).
Trace metal distribution in surface water, sediment, and tissues of freshwater catfish (Clarias. gariepinus), from Oke-Afa canal, Lagos Nigeria. International Journal of Geography and Geology, 1(1), 10.
[4] Book of Marine and Fisheries Statistics. (t.year). 2012: Bappenas.
[5] Book of Report on Marine Fishing in Statistics According to the WPPNRI 2005-2014. (t.year).
[6] Directorate General of Fisheries. (1994). Development and Development of Fisheries Port Infrastructure. Jakarta. [7] Directorate General of Strengthening Maritime and Fishery
Products Competitiveness, Ministry of Maritime Affairs and Fisheries. (2015). Jakarta: Introduction to the National Fish Logistic System FGD.
[8] Fisheries Port. (t.year). Port Profile. Picked in August 2017, from the Fisheries Port Information Center: pipp.djpt.kkp.go.id
[9] Indrajit, & Djokopranoto. (2002). Supply Chain Management Concept. Jakarta: Grasindo.
[10]KKP. (2015). Capture Fisheries Performance. Secretariat of the Directorate of Capture Fisheries, Directorate of Fish Resource Management. Directorate of Ships and Fishing Equipment, Directorate of Services, Directorate of Fisheries Port and Directorate of Fisheries Port.
[11]Levi. (2000). Designing and managing the supply chain: Concept, strategies, and. Irwin McGraw-Hill.
[12]Prakash, S., Immaculate Jeyasanta, K., Edward, J. P., & Patterson, J. (2014). Effect of gamma irradiation on the microbial quality of dried fishes. The Asia Journal of Applied Microbiology, 1(3), 26-48.
[13]Regulation of the Minister of Marine and Fisheries of the Republic of Indonesia Number 08 / PERMEN-KP / 2012 concerning Port. (t.year). PERMEN KP 05/2014. (t.year). [14]Regulation of the Minister of Marine and Fisheries of the
Republic of Indonesia Number 5 / PERMEN-KP / 2014 concerning the National Fish Logistics System. (t.year). [15]Saaty. (2005). Decision making with the analytic hierarchy
process. USA: University of Pittsburgh.
[16]Saudi, M.H.M., Sinaga, O., Roespinoedji, D., & Jabarullah, N.H. (2019) Industrial, Commercial and Agricultural Energy Consumption and Economic Growth Leading to Environmental Degradation, Ekoloji, 28 (107), 299 – 310. [17]Siagian, Y. (2005). Application of Supply Chain
Management in the Business World. Jakarta: Grasindo. [18]Sinaga, O., Saudi, M.H.M., Roespinoedji, D., & Jabarullah,
N.H. (2019) Environmental Impact of Biomass Energy Consumption on Sustainable Development: Evidence from ARDL Bound Testing Approach, Ekoloji, 28 (107), 443 – 452.
[19]Suryadi, K. (1998). Decision Support Systems: A Structural Discourse of Idealization and Implementation of Decision-Making Concepts. Bandung: Teenagers Rosdakarya Offset.