Journal of Chemical and Pharmaceutical Research, 2015, 7(1):227-236
Research Article
CODEN(USA) : JCPRC5
ISSN : 0975-7384
Cytotoxic xanthones from the stem bark of Garcinia cowa Roxb
Fatma Sri Wahyuni
1, Khozirah Shaari
2, Johnson Stanslas
3, Nordin Hj. Lajis
2and
Dachriyanus
1,4*1Faculty of Pharmacy, Andalas University, Kampus Limau Manis, Padang, West Sumatra, Indonesia 2Laboratory of Natural Products, Institute of Bioscience, Universiti Putra Malaysia, UPM, Serdang, Selangor,
Malaysia
3Faculty of Medicine and Health Sciences, Universiti Putra Malaysia, UPM, Serdang, Selangor, Malaysia 4Current address: Faculty of Nursing, Andalas University, Padang, West Sumatra, Indonesia
_____________________________________________________________________________________________
ABSTRACT
The aims of this study was to isolate compounds from the methanol extract of stem bark of Garcinia cowa and to evaluated their cytotoxic activity against breast (MCF-7) and lung (H-460) cancer cell lines. The ethyl acetate fraction was separated by successive silica gel column chromatography to give three compounds. Based on spectroscopic comparison with those of the literature, these compounds were elucidated as 6-hydroxy-calabaxanthone (2), 2-(3-methyl-2-butenyl)-1,5,6-trihydroxy-3-methoxy-4-(1,1-dimethyl-2-propenyl)-9H-xanthen-9-one(3), rubraxanthone (4), α-mangostin (5), a new compound 1,3,6-trihydoxy-7-methoxy-4-(4-acetoxy-3-methyl-2-butenyl)-8-(3,7-dimethyl-2,6-octadienyl)xanthone (6) and cowanin (7). Complete NMR assignment of 6-hydroxy-calabaxanthone (2) and cowanin (7) were published for the first time. All isolated compounds were subjected to MTT assay against MCF-7, H-460 and DU-145 cancer cell lines. α-mangostin (5) and cowanin (7) were found to be potent against MCF-7 while 6-hydroxy-calabaxanthone (2) potent against DU-145 cell lines. Conclusion: The results indicate that G. cowa stem bark could be one of important sources of natural cytotoxic compounds.
Keywords: Structure elucidation, NMR spectroscopy, xanthones, Garcinia cowa Roxb., cytotoxic activity, MCF-7,
H-460, DU-145
_____________________________________________________________________________________________
INTRODUCTION
Garcinia cowa Roxb known as asam kandis in West Sumatera is a medium-sized tree, which attains a height of ca.
O
H OH
H
3C
1
2
3 4
5
1'
2'
3'
4'
5'
6' 7' 8'
9'
10'
11'
12'
13'
14'
15'
16'
(1)O
O
O
HO
MeO
OH
2'
1'
3'
1
9
8
4
5
1"
3"
4"
5"
7
2
O
O
OH
OMe
OH
HO
1 3
4a
5a
8a 9a
8
7
1"
2"
3"
1'
2'
4'
(2) (3)
O
O
MeO
HO
OH
OH
1
H
H
H
4
5
7
1'
4'
6'
8'
10'
9'
O
O
OH
OH
H
H
HO
MeO
1
2
4
5
7
8
1'
3'
4'
5'
1"
3"
4"
5"
(4) (5)
O O OH HO OH MeO H H O O 3 4a 5 7 8 9 9a 2' 4' 5' 2" 4" 7" 8" 9" 10"
O
O
OH
HO
OH
OMe
1
1'
1"
4"
6"
8"
4
5
8
2'
4'
[image:2.595.140.473.77.628.2](6) (7)
Fig. 1. Isolated compounds from the stem bark of G. cowa
In continuation of our study, the crude methanol extract of the stem bark of G. cowa was found to be active against several cell lines. Herein, we report the structure elucidation of five known xanthones and one new xanthone as well as their cytotoxic against MCF-7, H-460 and DU-145 cancer cell-lines.
EXPERIMENTAL SECTION
Plant collection
G. cowa Roxb (stem bark) was collected at Sarasah Bonta, Harau Valley, and West Sumatra. The specimens
______________________________________________________________________________
Plant materials were chopped into small pieces and air-dried. The dried plant materials were ground into powder before extraction.
Isolation of xanthones from the stem bark of G. cowa
The ground air-dried stem bark (2.2 kg) was percolated three times with methanol. The combined extracts were evaporated under reduced pressure to give a dark mass (113.54 g). The extract was successively partitioned between water and hexane followed by ethyl acetate and finally by butanol to give 5.7 g, 43.0 g and 45.0 g, respectively, of gums. All fractions were subjected to cytotoxic activity assay towards H460 cell line and base on the results, further work was continued on the ethyl acetate soluble fractions since it was found to be the active fraction.
A portion of ethyl acetate fraction (40 g) was subjected to CC on silica gel and successively eluted with hexane followed by hexane-EtOAc mixture, and finally washed with methanol to give five combined fractions (A-E). Each fraction was then tested for cytotoxic activity against H-460 cells. Except for fraction A, all fractions showed good activity with IC50 value range of 6.3-26.9 µg/mL. Fraction B was subjected to repetitive RC (on 4 mm and 2 mm
plates) to give 6-hydroxy-calabaxanthone (2) (11 mg) as yellow needles, after recrystallization from EtOAc-hexane (1:2). Fraction C was subjected to flash vacuum chromatography followed repetitive CC on silica gel and purification on RC gave two semi-purified fractions, which were crystallized with EtOAc-hexane as 2-(3-methyl-2-butenyl)-1,5,6-trihydroxy-3-methoxy-4-(1,1-dimethyl-2-propenyl)-9H-xanthen-9-one (3) (5 mg), rubraxanthone (4) (93 mg) and α-mangostin (5) (47 mg). Fraction D (3.2 g) was subjected to silica gel CC using hexane as eluent followed by hexane-EtOAc mixture, EtOAc and finally with methanol to obtain four combined fraction (DA-DD).
Further repetitive CC on sub-fraction DD (1.3 g) and RC afforded
1,3,6-trihydoxy-7-methoxy-4-(4-acetoxy-3-methyl-2-butenyl)-8-(3,7-dimethyl-2,6-octadienyl)xanthone (6) (5.2 mg) and cowanin (7) (30 mg) as yellowish needles.
Cytotoxic asssay:
The ability of the extracts and pure compounds to induce growth inhibition on several cell lines was determined using MTT assay [10]. Cells were attached by incubate suspension cells (180 µl in each well axcept blank) for over night. Varying concentrations of the fractions and pure compounds were prepared from the stock solutions by serial dilution (100 µM, 10 µM, 1 µM, 0.1 µM) in RPMI-1640 to give a volume of 200 µl in each well of microtiter plate (96-well). The assay for each concentration of extract was performed in quarduplicate and the culture plate incubated at 37 0C with 5 % (v/v) CO2 for 96 hours. After 96 hours of incubation, 50 µl of 2 mg/mL MTT solution
was added to each well and allowed to incubate for a further 4 hours. After 4 hours incubation, discard all supernatant. Subsequently, 100 µl DMSO was added to each well and vigorously mixed to dissolve the formazan crystals. Absorbance values at 550 nm was measured with a microplate reader. Cytotoxicity was expressed as IC50.
6-hydroxy-calabaxanthone (2) was isolated as yellowish needles, m.p. 152-154oC, UV MeOH λmax (log ε) nm: 203
(4.00), 290 (4.12), 329 (3.84); IR Vmax (KBr) cm -1
: 3413, 2923, 1600, 1122; EIMS m/z (rel. int): 408,4 (M+, 24), 393 (100), 375 (23), 365 (57), 337 (9), 323 (14). 1H NMR (500 MHz, d6-Acetone): see Table 1. 13C NMR (125 MHz, d6
-Acetone): see Table 1
2-(3-methyl-2-butenyl)-1,5,6-trihydroxy-3-methoxy-4-(1,1-dimethyl-2-propenyl)-9H-xanthen-9-one (3) was isolated as yellow crystals; m.p. 115-117; requires 411.1788). UV EtOH λmax (log ε) nm: 201 (4.50), 259 (4.46), 328 (4.02); IR νmax (KBr) cm-1: 3420, 2960, 2930, 1630, 1606, 1570, 1532, 1467, 1432, 1417, 1354, 1313, 1282, 1194, 1179, 1122, 1100, 1015, 985, 892, 794, 778. High-resolution FABMS gave [M+H]+• at 411.1808 (C24H27O6 requires
411.1788). EIMS: m/z (rel. int): 411(M+, 14), 395(12), 368(23), 339(48), 355(74), 355(74), 367 (100).
1
H NMR (500 MHz, CdC13): δ 1.67(6H, s, 1”-Me2 ), 1.72 (3H, d, J= 1.2 Hz, 3’-Me), 1.80 (3H, s, 4′- Me), 3.41 (2H,
brd, J= 6.4 Hz, H-1’), 3.78 ( 3H, s, 6-OMe), 5.06 (1H, dd, J= 10.6 Hz & 1.4 Hz, H-3”), 5.26 (1H, dd, J= 17.7 & 1.4
Hz, H-3”), 5.30 (1H, m, H-2’), 6.01 (1H, brs, 6-OH), 6.15 (1H, s, 5-OH), 6.64, 1H, dd, J= 17.7 Hz & 10.6 Hz,H-2”, 6.96 (1H, d, J= 8.8 Hz, H-7). 7.73 (1H, d, J= 8.8 Hz, H-8), 13.34 (1H, s, H-1). 13C NMR (125 MHz, CdC13):181.3,
(C-9), 164.4 (C-3), 160.0 (C-1), 156.8 (C-2′′), 152.73 (C-4a), 149.2 (C-6), 144.8 (C-5a), 132.2 (C-3′), 130.9 (C-5), 122.5 (C-2′), 118.7 (C-4), 118.4 (C-2), 117.8 (C-8), 113.8 (C-8a), 112.9 (C-7), 105.6 (C-9a), 104.3 (C-3′′), 62.7 (3-OMe), 42.00 (C-1′′), 28.8 ( Me2 -1′′), 25.7 ( 3’-Me ′), 22.9 (C-1′), 18.0 (C-4′).
1
H NMR (500 MHz, d6-Acetone): δ 6.72 (1H, s, H-5), 6.21 (1H, d, J= 2.0 Hz, H-4), 6.18 (1H, d, J= 2.0 Hz, H-2),
5.20 ( 1H, t, J= 7.0 Hz, H-6’), 5.01 (1H, t, J= 7.0 Hz, H-2’), 4.07 (2H, d, J= 7.0 Hz, H-1’), 3.4 (3H, s, 7-OMe), 2.05 (2H, t, J= 7.0 Hz, H-5’), 1.98 (2H, t, J= 7.0 Hz, H-4’), 1.81 (3H, s, H-8’), 1,55 (3H, s, H-10’), 1.52 (3H, s, H-9’).
13C NMR (125 MHz, d
6-Acetone): 182.00 (C-9), 164.8 (C-1), 163.6 (C-3), 157.3 (C-6), 156.9 (C-5a), 155.7 (C-4a),
143.8 (C-7), 137.5 (C-8), 134.3 (C-3’), 130.8 (C-7’), 124.3 (C-2’), 124.0 (C-6’), 111.0 (C-8a), 102.8 (C-9a), 101.7 (C-5), 97.6 (C-2), 92.9 (C-4), 60.2 (7-OMe), 39.6 (C-4’), 26.4 (C-5’), 25.8 (C-1’), 24.6 (C-9’), 16.5 (C-10’), 15.5 (C-8’).
α-Mangostin (5) was isolated as yellowish needles, m.p. 181-183; UV (MeOH) λmax (log ε) nm: 203 ( 4.42), 244
(4.33), 317 (4.15); IR νmax (KBr) cm-1:3401, 2923, 1607, 1280. EIMS m/z (rel. int): 408,4 M.+, (24), 410 (100), 375 (23), 365 (57), 337 (9), 323 (14).
1
H-NMR (500 MHz, d6-acetone): δ 13.81 (1H, s, 1-OH), 6.84 (1H, s, H-5), 6.41 (1H, s, H-4), 5.31 (2H, t, J=7.5 Hz,
H-2’, H-2”), 4.15 (2H, d, J= 7.5, H-1”), 3.82 (3H, s, 7-OMe), 3.38 (2H, d, J=7.5, H-1’), 1.85 (3H, s, H-4”), 1.81 (3H, s, H-4’), 1.68 (3H, s, H-5”) and 1.67 (3H, s, H-5’).
13C-NMR( 125 MHZ, d
6-acetone): δ 182.2 (C-9), 162.3 (C-1), 161.1 (C-3), 156.7 (C-6), 155.6 (C-5a), 155.1 (C-4a),
143.8 (C-7), 137.5 (C-8), 130.8 (C-3’, C-3”), 124.1 (C-2”), 122.8 (C-2’), 111.4 (C-8a), 110.4 (C-9a), 103.0 (C-2), 102.1 (C-5), 92.5 (C-4), 60.7 (7-Me), 26.3 (C-1”), 25.3 (C-5’), 25.2 (C-5”), 21.3 (C-1’), 17.7 (C-4”), 17.3 (C-4’).
1,3,6-trihydoxy-7-methoxy-4-(4-acetoxy-3-methyl-2-butenyl)-8-(3,7-dimethyl-2,6-octadienyl)xanthone (6) was isolated as yellowish powder (5.2 mg); IR Vmax (KBr) cm-1 : 3369, 1711, 1643; EIMS m/z (rel. int): 536(M+,4), 466
(38), 406.7 (100), 388 (27); 1H NMR(500 MHz, d6-Acetone): see Table 2. 13C NMR (125 MHz, d6-Acetone): see
Table 2
Cowanin (7) was isolated as yellowish needles, m.p. 137-139.: UV λmax EtOH (logε) nm: 243 (4.52), 315 (4.37): IR Vmax (KBr) cm-1: 3391, 2921, 1648, 1460, 1429, 1070, 1027; EIMS: m/z (rel. int.): 410 (M+, 18), 409(50), 353
(100), 335(35); 1H NMR (500 MHz, d6-Acetone): see Table 3. 13C NMR (125 MHz, d6-Acetone): see Table 3
RESULTS AND DISCUSSION
Five known and one new xanthones were isolated from the stem bark of G. cowa. Those are 6-hydroxy-calabaxanthone (2), 2-(3-methyl-2-butenyl)-1,5,6-trihydroxy-3-methoxy-4-(1,1-dimethyl-2-propenyl)-9H-xanthen-9-one (3), rubraxanthone (4), α-mangostin (5), a new 1,3,6-trihydoxy-7-methoxy-4-(4-acetoxy-3-methyl-2-butenyl)-8-(3,7-dimethyl-2,6-octadienyl)xanthone (6) and cowanin (7) were isolated from the stems of G. cowa. Their structures were elucidated with extensive by spectroscopic data.
6-Hydroxy-calabaxanthone (2), isolated as yellow amorphous powder, which gave molecular ion on the basis of its EIMS spectra at m/z 408.4 corresponding to molecular formula C24H24O6. The evidence of xanthone chromophore
was found from its UV absorption at λmax 203 nm (4.00), 290 nm (4.12) and 329 (3.84). Its IR spectrum showed
the presence of hydroxyl and carbonyl groups at 3413 cm-1, 1600 cm-1, respectively [11]. The EI-MS spectrum showed significant fragment ion peaks at m/z 392, 374 and 336 arising from the loss of CH3, OCH3 and C5H9 from
the M+ ion, respectively. The 1H NMR spectrum, the signals at δ 5.74 (1H, d, J= 10.0 Hz) and 1.48 (6H, s) together with a dimethyl proton signal at 1.48 (6H, s, H-4’) indicated the present of a 2,2-dimethyl on the pyran ring system [12]. The 1H NMR spectrum also contained signals of the hydrogen bonded hydroxyl group at δ13.98 (1H, s), two aromatic proton signals at δ 6.27 (1H, s) and δ6.88 (1H, s). The present of 3-methyl but-2-enyl group was noted due to the appearance of proton signals at δ 1.68 (3H, s), δ 1.85 (3H, s), an olefinic proton signals at δ 5.29 (1H, t,
J= 6.5 Hz), a doublet of methylene proton at δ4.14 (2H, d, J= 6.5).
The 13C NMR spectrum showed 23 carbon signals containing six oxygen-bearing aromatic carbon signals atδ 160.1 (C-3),δ 158.2 (C-1),δ 157.7 (C-5a),δ 156.5 (C-4a),δ155.7 (C-6) and 144.2 (C-7) in low field region (δ 130 - δ
200). One carbonyl carbon and one allylic carbon signals also present at δ 182.3 (C-9) and δ 124.0 (C-2”), respectively. In the middle field region (δ 90 – δ 130), there are five aromatic carbon signals (non-oxygenated) present at 110.9 (C-8a), 104.4 (C-2), 103.5 (C-9a), 102.2 (C-5) and 94.0 (C-4). Two sp2 carbon signals from chromene ring present at 127.8 (C-2’) and 115.4 (C-1’). In high field region there is one oxygenated quaternary carbon, one dimethyl carbon and two methyl carbon signals present at δ 78.2 (C-3’), δ 27.8 (C-4’), δ 25.3 (C-5”) and δ 17.7 (C-4”), respectively. The HMBC spectrum showed that the chelated OH proton (δ 13.98) correlated to δ
______________________________________________________________________________
The connectivity of the chromene ring at C-2 was supported by the correlation between proton at C-1’ (6.70) with C-1 (158.2), C-2 (104.4) and C-3 (160.1). The HMBC spectrum further exhibited the correlation between the vinylic proton at 5.74 (H-2’) with the carbon at C-3’ (78.2) as well as the aromatic carbon at C-2 (104.4) that revealing the connectivity between the chromene ring to main xanthone skeleton. An aromatic proton at δ 6.88 (H-5) showed long-range correlations with carbon signals at C-5a (157.7), C-6 (155.7) and C-7 (144.2) suggested the position of this proton at C-5. Another singlet proton at 6.27 was also assigned as H-4, based on its correlation with the carbon signals at C-2 (104.4), C-3 (160.1) and C-4a (156.5). The position of the methoxy was observed at C-7, based on its
2J correlation of its proton signal at 1.48 (H-4’) with C-7 (144.2).
O
O
O
HO
MeO
OH
2'
1'
3'
1
9
8
4
1"
3"
4"
5"
7
2
H
H
Fig. 2. The HMBC correlation for H-4, H-5 and H-1’ of (2)
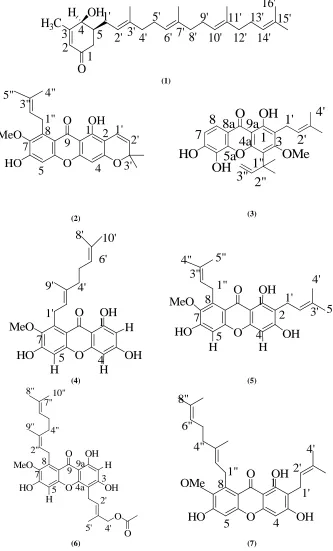
Furthermore, the location of prenyl unit was assigned at C-8 in the HMBC spectrum. This data was supported by long-range correlation between the methylene protons of prenyl unit at δ 4.14 (H-1”,) with carbon signals at C-8 (δ
[image:5.595.187.423.381.609.2]137.4), C-8a (δ 110.9) and C-7 (δ 144.2). Table 4.13 summarized all the spectrum of 1H NMR, 13C NMR, HSQC and HMBC. Based on the argument above, the structure of (2) was identified as 6-hydroxy-calabaxanthone [13].
Table 1. 1H-NMR, 13C-NMR, HSQC and HMBC data of compound (2)
Position δC δH HMBC
1 158.2
2 104.4
3 160.1
4 94 6.27/ 1H/ s C-1, C-2, C-3, C-2’
4a 156.5
5 102.2 6.88/ 1H/ s C-5a, C-6, C-7, C-8, C-8a
5a 157.7
6 155.7
7 144.2
8 137.4
8a 110.9
9 182.3
9a 103.5
2’ 78.15
3’ 127.8 5.74/ 1H/ d/J=10.0 C-4’, C-1, C-2, C-2’ 4’ 115.4 6.70/ 1H/ d/ J=10.0 C-2’, C-3, C-2, C-1 1” 26.2 4.14/ 2H/ d/ J= 6.5 C-8a, C-7, C-3”
2” 124 5.29/ 1H/ t/ J= 6.5 C-4”, C-5”
3” 130.9
4” 17.7 1.85/ 3H/ s C-5”, C-2”
5” 25.3 1.68/ 3H/ s C-4”, C-3”, C-2”
2’-CH3 27.8 1.48/ 6H/ s C-2’, C-3’, C-4’, C-3
7-OMe 60.6 3.85/ 3H/ s C-7
2-(3-methyl-2-butenyl)-1,5,6-trihydroxy-3-methoxy-4-(1,1-dimethyl-2-propenyl)-9H-xanthen-9-one (3) was isolated from EtOAc fraction of stem bark of G. cowa, as a yellowish crystalline compound, m.p. 115-116 °C. The HRMS indicated a molecular formula of C24H26O6. The UV spectrum showed three absorption bands, λmax (log ε) at 201 nm
(4.50), 259 nm (4.46) and 328 (4.02) which is typical for xanthone chromophore [14]. Its IR spectrum showed a characteristic hydroxyl absorption band at 3000 cm-1, CH stretching at 2980 cm-1 and carbonyl stretching peak at 1620 cm-1.
In the 1H NMR spectrum, an ortho coupling was observed between the signal at δ 7.05 and δ 7.67, corresponding to two aromatic protons at H-7 and H-8, respectively. Furthermore, J correlation between the signal at δ 7.67 (H-8) and the carbonyl signal at 180.0 was observed in the HMBC spectrum. The assignment of the ortho coupled protons at C-7 and C-8 were accomplished by 2J and 3J correlation, which showed that H-7 correlated with δ 133.0 (C-5), δ
(C-9a). The position of 3-methylbut-2-enyl group [2 methyl signals at δ 1.70 and δ 1.82; an olefinic proton signals at δ 5.32 (1H, t, J= 6.5 Hz), a doublet of methylene proton at δ 3.42 (2H, d, J= 6.5) at C-2 was confirmed by a HMBC correlation of proton signal at δ3.42 (H-1’) with the carbon signal at 160.0 (C-1) and 164.4 (C-3).
The presence of 1,1-dimethylallyl group [δ 6.64 (1H, dd, J=17.5, 10 Hz, ), δ 4.84 (1H, dd, J= 10.0, 2.0
Hz, ), ( δ 5.06 (1H, dd, J= 17.5, 2.0 Hz, and two overlapping methyl peaks at δ 1.79 ] at position
C-4 was confirmed by HMBC correlation between the methyl signals at δ 1.79 (1”-CH3) and the carbon signal at δ
119.0 (C-4).
The position of 1,1-dimethylallyl group was further supported by the correlation of dimethyl proton 1”-CH3 (δ 1.79)
with the signal of C-4a (δ 151.0). The presence of OH group at C-5 and C-6 were confirmed by a 3J HMBC
correlation of proton signal at δ 7.05 (H-7) with the carbon signal at δ 133.0 (C-5) and proton signal at δ 7.67 (H-8) with the carbon signal δ 152.0 (C-6), respectively. Therefore, based on the argument above, the structure of (3) was concluded to be 2-(3-methyl-2-butenyl)-1,5,6-trihydroxy-3-methoxy-4-(1,1-dimethyl-2-propenyl)-9H-xanthen-9-one [9].
Rubraxanthone (4) was obtained as yellowish needles with melting point 201-203°C. The EI-MS spectrum showed that the molecular ion (M.+) was at m/z 410. The UV spectrum displayed the absorptions at λmax (log ε): 203 (4.54),
241 (4.50) and 312 (4.32) nm the due to xanthone nucleus. The IR spectrum showed carbonyl absorption band at 1641 cm-1 and OH stretching absorption band at 3425 cm-1, which was consistent with xanthone skeleton. The assignment of the methoxy group at C-7, ortho to the geranyl side-chain at C-8, was supported based on this data [15]. Based on HMBC correlation between aromatic proton at δ 6.11 with the carbon signals at δ 164.8 (C-1), 163.6 (C-3) and δ 102.8 (C-9a), the doublet protons at δ 6.11 and δ 6.21 were assigned as meta coupled aromatic proton (J=2.0 Hz) of H-2 and H-4, respectively. The H-4 showed correlations with carbon signals at δ 164.8 (C-1), δ 97.6 (C-2) and δ 155.7 (C-4a). Furthermore, correlations between aromatic proton at δ 6.72 with carbon signals at δ 181.9 (C-9), δ 156.9 (C-5a), δ 157.3 (C-6) and δ 111.0 (C-8a) were supported that this proton was assigned as H-5. Thus, this compound was characterized as rubraxanthone. This compound was previously isolated from stem barks of G.
pyrifera [14].
α-Mangostin (5) was isolated as yellowish needles, which melted at 181-183oC. The EI-MS spectrum showed the molecular ion peak at m/z 410 corresponding to the molecular formula C24H26O6. The UV spectrum showed three
absorption bands, λmax (log ε) at 203 (4.42), 244 (4.33) and 317 (4.15) nm, which were typical for xanthone chromophore. The IR spectrum showed carbonyl absorption band at 1628.27 cm-1 and OH stretching absorption band at 3435.61 cm-1, which was consistent with xanthone skeleton. Based on this observation, the structure was determined as α-mangostin. The 1H NMR and 13C NMR spectrum were also compared with literature value and matched with the structure of α-mangostin [15].
1,3,6-trihydoxy-7-methoxy-4-(4-acetoxy-3-methyl-2-butenyl)-8-(3,7-dimethyl-2,6-octadienyl)xanthone (6) was isolated as yellow amorphous powder. The IR spectrum revealed the presence of hydroxyl group by absorption at 3300 cm-1 and conjugated ketone by absorption at 1652 cm-1. The EI mass spectra of this compound showed a molecular ion peak at m/z 536, consistent with a molecular formula C31H36O8.
The 1H NMR spectrum showed a singlet signal at δ13.47 of a chelated hydroxyl group 1-OH, two singlet signals of two aromatic proton signals at δ 6.32 (1H, 2, H-2) and δ 6.93 (1H, s, H-5) and a singlet resonance of methoxyl protons at δ 3.83 (3H, s). Two side chains were detected: a geranyl side chain and a prenyl unit with an acetoxy group. The signals of the geranyl unit are represented by two olefinic protons at δ 5.28 (H-2”) and δ 5.05 (H-6”), three sets of methylene groups at δ 4.12 (H-1”), δ 2.06 (H-4”), δ 2.03 (H-5”) and three vinylic methyl groups at δ
1.85 (H-9”), δ1.57 (H-8”) and δ1.62 (H-10”). Other signals were assigned to a 4-acetoxy-3-methyl-2-butenyl group, based on the signals appeared as a triplet at δ 5.46 (H-2’), a doublet at δ 3.64 (H-1’), a singlet of two proton at δ
4.86 (H-4’), two sets a singlet of three proton at δ 2.17 (4’-OCOCH3) and δ 1.78 (H-5’). The 13C NMR spectrum of
(6) showed 31 signals, including two carbonyl signals at δ 182.4 and 172.2.
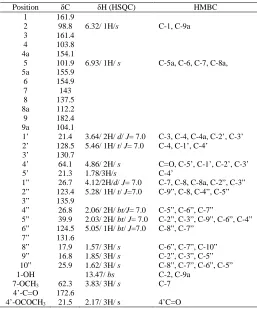
The HMBC correlation of acetyl methyl protons and oxymethylene protons H-4’ to the acetyl carbonyl group confirmed the position of the acetoxyl group. The correlation of benzylic methylene protons H-1’ (δ 3.64) to C-3 (δ
161.4), C-4a (δ 154.1) and C-9a (δ 104.1) confirmed the position of the 4-acetoxy-3-methyl-2-butenyl side chain to be C-4 and by comparison with the spectral data of cowagarcinone E [16]. The correlation of benzylic methylene protons H-1” (δ 4.12) to C-7 (δ 143.0), C-8 (δ 137.5) and C-8a (δ 112.2) suggested that the geranyl side chain was
______________________________________________________________________________
located at C-8. The position of aromatic protons at C-2 and C-5 were confirmed based on the correlation of proton signals at δ 6.32 with the carbon signals at δ 161.9 (C-1) and δ 104.1 (C-9a) whereas proton signal at δ 6.93 with the carbon signals at δ 155.9 (C-5a), δ 154.9 (C-6), (C-7) and 112.2 (C8a). The assignment of the protons and carbons of (6) are summarized in Table 2.
O
O OH
HO OH
MeO H
H
O
O 3 4a 5
8 9 9a
2'
4' 5' 2"
4" 7" 8"
[image:7.595.252.366.130.261.2]9" 10"
Fig.3. Selected HMBC of compound (6)
The 1H NMR and 13C NMR data were similar to cowagarcinone E except in the position of 4-acetoxy-3-methyl-2-butenyl. Hence, compound (6) was established as a new xanthone 1,3,6-trihydroxy-7-methoxy-4-(4-acetoxy-3-methyl-2-butenyl)-8-(3,7-dimethyl-2,6-octadienyl)xanthone.
Table 2. The 1H-NMR , 13C-NMR, HSQC and HMBC data of
1,3,6-trihydroxy-7-methoxy-4-(4-acetoxy-3-methyl-2-butenyl)-8-(3,7-dimethyl-2,6-octadienyl)xanthone (6)
Position δC δH (HSQC) HMBC
1 161.9
2 98.8 6.32/ 1H/s C-1, C-9a
3 161.4
4 103.8
4a 154.1
5 101.9 6.93/ 1H/ s C-5a, C-6, C-7, C-8a,
5a 155.9
6 154.9
7 143
8 137.5
8a 112.2
9 182.4
9a 104.1
1’ 21.4 3.64/ 2H/ d/ J= 7.0 C-3, C-4, C-4a, C-2’, C-3’ 2’ 128.5 5.46/ 1H/ t/ J= 7.0 C-4, C-1’, C-4’
3’ 130.7
4’ 64.1 4.86/ 2H/ s C=O, C-5’, C-1’, C-2’, C-3’
5’ 21.3 1.78/3H/s C-4’
1” 26.7 4.12/2H/d/ J= 7.0 C-7, C-8, C-8a, C-2”, C-3” 2” 123.4 5.28/ 1H/ t/ J=7.0 C-9”, C-8, C-4”, C-5”
3” 135.9
4” 26.8 2.06/ 2H/ bt/J= 7.0 C-5”, C-6”, C-7”
5” 39.9 2.03/ 2H/ bt/ J= 7.0 C-2”, C-3”, C-9”, C-6”, C-4” 6” 124.5 5.05/ 1H/ bt/ J=7.0 C-8”, C-7”
7” 131.6
8” 17.9 1.57/ 3H/ s C-6”, C-7”, C-10”
9” 16.8 1.85/ 3H/ s C-2”, C-3”, C-5”
10” 25.9 1.62/ 3H/ s C-8”, C-7”, C-6”, C-5”
1-OH 13.47/ bs C-2, C-9a
7-OCH3 62.3 3.83/ 3H/ s C-7
4’-C=O 172.6
4’-OCOCH3 21.5 2.17/ 3H/ s 4’C=O
[image:7.595.177.434.345.654.2]O
HO OH HO
HO
oxydation
OH O
O OH
HO OH
maklurin
O
O OH
HO OH
MeO methylation
prenylation HO
O
O OH
HO OH
MeO
O
O OH
HO OH
MeO
OH
O
O OH
HO OH
MeO
O
Acetilation
O
O OH
HO OH
MeO geranylation
oxydation
Fig.4. Proposed of Biosynthetic Pathway of 1,3,6-trihydroxy-7-methoxy-4-(4-acetoxy-3-methyl-2-butenyl)-8-(3,7-dimethyl-2,6-octadienyl)xanthone (6)
Cowanin (7) was isolated as a yellowish needless, m.p. 121-124 oC. It exhibited UV absorption bands at 243.60 nm (4.52) 315.80 nm (4.37), while hydroxyl and conjugated carbonyl absorption bands were observed at 3391 cm-1 and 1648 cm-1, respectively, in the IR spectrum. The EI mass spectra of this compound showed a molecular ion peak at
m/z 478, consistent with a molecular formula C29H34O6.
The 1H NMR spectrum displayed signals of one chelated hydroxyl group at δ 13.81 (s, 1-OH), two aromatic protons at δ 6.86 (1H, s) and δ 6.43 (1H, s) and one methoxy group at δ 3.83 (3H, s), The presence of the signals at
δ 3.38 (2H, d, J=7.0), δ 5.31 (1H, m), δ 1.68 (3H, s) and 1.81 (3H, s) were suggestive of a prenyl moiety. The remaining signals appeared as the typical signals of a geranyl unit. These signals were a doublet of methylene protons H-1’’ at δ 4.17, two broad triplets of the olefinic protons H-2’’ and H-6’’ at δ 5.27 , two multiplets of the methylene protons H-4’’ and H-5’’ at δ 2.02 and δ 2.05, respectively, and three singlets of methyl groups 8’’, H-9’’ and H-10’’ at 1.56, 1.83 and 1.61, respectively. The 13C NMR spectrum of (7) showed 29 signals, including, one carbonyl signal at δ 182.2.
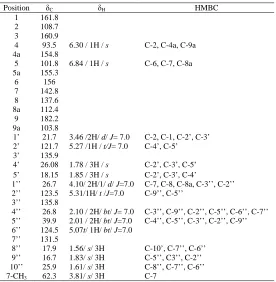
The assignments of the substituents were deduced from the HSQC and HMBC spectra (Table 3). The geranyl unit was located at C-8 according to the correlations of benzylic methylene proton H-1’’ to C-7, C-8 and C-8a and the deshielding effect of carbonyl group on H-1’’. The methylene protons H-1’ correlated to C-1 and C-2 whereas the methylene protons H-1’’ correlated to C-7, C-8 and C-8a, consequently, a prenyl unit was located at C-2. Aromatic proton at δ 6.84 showed two bond coupling correlation with 6 and 5a, and three bond coupling with 7 and C-8a. It’s confirmed the position of this proton at C-5. Another aromatic proton at δ 6.30 was attached in C-4 based on the two bond coupling correlation with C-4a and three bond coupling to C-2 and C-9a. The position of methoxyl group a C-7 was confirmed based on correlation between proton signals at δ 3.83 with carbon at δ 144.2 (C-7).
O O
OH MeO
OH
4 5
1'
2' 5'
1'' 8'' 10''
9''
HO
7 9
H H
Fig.5. Selected HMBC of (7)
[M-69-______________________________________________________________________________
[image:9.595.170.446.120.402.2]56]+. A weak ion at m/z = 367 [M-111]+ could correspond to fragmentation involving the geranyl group and the o-methoxy group [16]. Thus, (7) was characterized as cowanin [17].
Table 3. The 1H-NMR, 13C-NMR, HSQC and HMBC data of cowanin (7)
Position δC δH HMBC
1 161.8
2 108.7
3 160.9
4 93.5 6.30 / 1H / s C-2, C-4a, C-9a
4a 154.8
5 101.8 6.84 / 1H / s C-6, C-7, C-8a
5a 155.3
6 156
7 142.8
8 137.6
8a 112.4
9 182.2
9a 103.8
1’ 21.7 3.46 /2H/ d/ J= 7.0 C-2, C-1, C-2’, C-3’ 2’ 121.7 5.27 /1H / t/J= 7.0 C-4’, C-5’
3’ 135.9
4’ 26.08 1.78 / 3H / s C-2’, C-3’, C-5’ 5’ 18.15 1.85 / 3H / s C-2’, C-3’, C-4’
1’’ 26.7 4.10/ 2H/1/ d/ J=7.0 C-7, C-8, C-8a, C-3’’, C-2’’ 2’’ 123.5 5.31/1H/ t /J=7.0 C-9’’, C-5’’
3’’ 135.8
4’’ 26.8 2.10 / 2H/ bt/ J= 7.0 C-3’’, C-9’’, C-2’’, C-5’’, C-6’’, C-7’’ 5’’ 39.9 2.01 / 2H/ bt/ J=7.0 C-4’’, C-5’’, C-3’’, C-2’’, C-9’’ 6’’ 124.5 5.07t/ 1H/ bt/ J=7.0
7’’ 131.5
8’’ 17.9 1.56/ s/ 3H C-10’, C-7’’, C-6’’ 9’’ 16.7 1.83/ s/ 3H C-5’’, C3’’, C-2’’ 10’’ 25.9 1.61/ s/ 3H C-8’’, C-7’’, C-6’’
7-CH3 62.3 3.81/ s/ 3H C-7
Cytotoxic activity of isolated compounds
The IC50 values of less 10 µM, is considered as potent, while the IC50 values of between 10 to 30 µM is considered
as having good activity and IC50 values of between 30 µM-100 µM is considered weak activity. All isolated
compounds, had been evaluated for their cytotoxic activity against MCF-7, H-460 and DU-145 cell lines. The compounds (5) and (7) showed potentactivities towards MF-7. Compound (5) also had potent activity against H-460, while compound (2) potent against DU-145 (Table 4).
Table 4.Cytotoxic activity of isolated compounds towards cancer cell lines
compounds IC50 (µM)
MCF-7 H-460 DU-145
(2) 21.2 ± 8.4 11.4 ± 4.0 6.4 ± 2.5
(3) 11.5 ± 3.7 11.3 ± 2.9 10.9 ± 6.3
(4) 37.4 ± 36.3 17.5 ± 2.4 42.3 ± 13.7
(5) 4.1 ±1.0 5.4 ± 3.3 11.3 ± 10.0
(6) 57.3 ± 36.3 28.8 ±26.2 nd
(7) 5.3 ± 2.1 12.3 ± 3.4 nd
MCF-7 = Breast cancer cells
H-460 = Lung cancer cell cells
DU-145 = Prostate cancer cells
nd = not determined since limited amount of compound
CONCLUSION
[image:9.595.209.414.508.626.2]Acknowledgments
All authors thank the Malaysian Ministry of Science, Technology and the Environment for financial support under the Intensified Research in Priority Areas Research Grant (IRPA, EAR No. 09-02-04-0313), International Foundation for Science (IFS no F/3967-1), National L’Oreal Fellowship Grant, and Directorate of Higher Education, Indonesian Ministry of Education (HB XIV no: 297/SP3/PP/DP2M/II/2006).
REFERENCES
[1]RR Rao, Econ. Bot., 1981, 35, 4-9.
[2]Na Pattalung; T Pornpipat; W Pichaet ; WC Taylor, Planta Med.,1994, 60, 365-368. [3]I Jantan; FA Jumuddin; FC Saputri; K Rahman, J. Med. Plants Res., 2011, 5, 2699-2709. [4]A Mukarami; S Jiwajimda; K Koshimizu; H Ohigashi, Cancer Lett., 1995, 95, 137-146. [5]J Shen; JS Yang, Chem. Pharm. Bull., 2006, 54, 126-128.
[6]BS Jena; GK Jayaprakasha; KK Sakariah, J. Agr. Food Chem., 2002, 50, 3431-3434.
[7] K Panthong; W Pongcharoen; S Phongpaichit; WC Taylor, Phytochem., 2006, 67, 999–1004. [8]W Mahabusarakam; P Chairerk; WC Taylor, Phytochem., 2005, 66, 1148-1153.
[9]FS Wahyuni; TB Lindsay; Dachriyanus; R Dianita; J Jubahar; NH Lajis; MV Sargent, Aust. J. Chem., 2004, 57, 223-226.
[10] T Mossman, J. Immunol Methods, 1983, 16, 55-63.
[11] RM Silverstein, FX Webster, D Kiemle, DL Bryce, Spectrometric Identification of Organic Compounds, 8thed, Wiley, Singapore, 2014, 92-94
[12] J Kosin; N Ruangrungsi; C Ito; H Furukawa, Phytochem., 1988, 47(6), 1167- 1168.
[13] AK Sen; KK Sarkar; PC Mazumder; N Banerji; R Uusvuori; TA Hase, Phytochem., 1990, 19, 2223-2225. [14] SA Ampofo; PG Waterman, Phytochem., 1986, 25, 2351-2355.
[15] LG Chen; LL Yang; CC Wang, Food Chem. Toxicol., 2008, 46, 688-693. [16] HH Lee; HK Chan, Phytochem., 1977, 16: 2038-2040.