www.impactjournals.com/oncotarget/ Oncotarget, Vol. 6, No. 15
Deregulation of focal adhesion pathway mediated by miR-659-3p
is implicated in bone marrow infiltration of stage M neuroblastoma
patients
Sara Stigliani1,*, Paola Scaruffi1,*, Corrado Lagazio2, Luca Persico2, Barbara Carlini3, Luigi Varesio4, Fabio Morandi3, Martina Morini4, Anna Rita Gigliotti5, Maria Rosaria Esposito6, Elisabetta Viscardi7, Valerio Cecinati8, Massimo Conte9, Maria Valeria Corrias3 1U.O.S. Physiopathology of Human Reproduction, IRCCS A.O.U. San Martino-IST, Genova, Italy
2Department of Economy, University of Genoa, Genova, Italy
3Laboratory of Oncology, IRCCS Istituto Giannina Gaslini, Genova, Italy
4Laboratory of Molecular Biology, IRCCS Istituto Giannina Gaslini, Genova, Italy
5Epidemiology, Biostatistics and Committees Unit, IRCCS Istituto Giannina Gaslini, Genova, Italy
6Neuroblastoma Laboratory, Pediatric Research Institute, Fondazione Città della Speranza, Padova, Italy 7Pediatric Hematology and Oncology Division, Padova University Hospital, Padova, Italy
8UOS Divisione Oncoematologia Pediatrica, Ospedale Civile di Pescara, Pescara, Italy
9Oncology Unit, IRCCS Istituto Giannina Gaslini, Genova, Italy *These authors have contributed equally to this work
Correspondence to:
Maria Valeria Corrias, e-mail: [email protected]
Keywords: neuroblastoma, focal adhesion, metastases, bone marrow, miRNA
Received: February 09, 2015 Accepted: April 08, 2015 Published: April 20, 2015
ABSTRACT
To get insights on the metastatic process of human neuroblastoma (NB), the miRNA expression profile of bone marrow (BM)-infiltrating cells has been determined and compared to that of primary tumors.
Twenty-two BM-infiltrating cells, 22 primary tumors, and 4 paired samples from patients with metastatic NB aged > 12 months were analyzed for the expression of 670 miRNAs by stem-loop RT-qPCR. The miRNAs whose expression was significantly different were subjected to selection criteria, and 20 selected miRNAs were tested in 10 additional BM-infiltrating cells and primary tumors. Among the miRNAs confirmed to be differentially expressed, 659-3p was further analyzed. Transfection of miR-659-3p mimic and inhibitor demonstrated the specific suppression and over-expression, respectively, of the miR-659-3p target gene CNOT1, a regulator of transcription of genes containing AU-rich element (ARE) sequence. Among the ARE-containing genes, miR-659-3p mimic and inhibitor specifically modified the expression of AKT3, BCL2, CYR61 and THSB2, belonging to the focal adhesion pathway. Most importantly, in BM-infiltrating cells CNOT1 expression was significantly higher, and that of AKT3, BCL2, THSB2 and CYR61 was significantly lower than in primary tumors. Thus, our study suggests a role of the focal adhesion pathway, regulated by miR-659-3p through CNOT1, in the human NB metastatic process.
INTRODUCTION
The adequate treatment of metastatic cells is becoming one of the most important issues in cancer clinical practice. Differently from all other types of
5 years is 25–30%, despite multimodal aggressive therapy [2]. Therefore, the search for new therapeutic approaches is warrant. However, little is known regarding the metastatic process in NB patients.
Several in vitro studies on NB cell lines suggested a pivotal role of the CXCL12-CXCR4 axis in BM
infiltration [3–6], but the demonstrations that CXCR4 is not functional in BM-infiltrating NB cells [7], and that BM resident cells in NB patients have significantly lower
expression of CXCL12 than in healthy children [8], do not support a role for this axis in stage M NB patients.
BM-infiltrating NB cells show the same genetic
characteristics of primary tumor cells [9], but we previously demonstrated that they differentially express several genes [10]. In particular, metastatic cells over-express HLA-G and calprotectin that are responsible for an immune
suppressive status and for the sustained inflammation of the
BM microenvironment, respectively [8]. Moreover,
BM-infiltrating NB cells under-express several genes, such as CX3CL1 (also called fractalkine), that is involved in in vitro
transmigration through BM endothelial cells [11].
To further characterize the differential features of
BM-infiltrating and primary tumor NB cells, we focused on their miRNA expression profiles. MiRNAs are
18-22 base long RNAs whose role in mediating important physiological and pathological processes, including cancer progression and metastasis, has been widely documented.
In vitro studies in NB cell lines identified several miRNAs
as regulators of different pathways [12–22], but information regarding miRNA expression in patients’ tissues are limited. Four miRNA signatures of human NB primary tumors were
demonstrated to predict prognosis [23–26]. However, only
a 25 miRNA signature is prognostic within the subset of stage M patients [25]. No miRNA signature of human
BM-infiltrating NB cells has been determined so far. A signature
of differentially expressed miRNAs was determined by Guo and coworkers by comparing subcutaneous tumors and their metastases grown in nude mice following injection of a
human NB cell line [27].
We thus analyzed the miRNA profiles of human BM-infiltrating cells and primary tumors to identify the
miRNAs differentially expressed and potentially involved
in the metastatic process. After screening the significant
miRNAs for level and distribution of expression values in the two groups of samples, we focused on
3p. Studies in NB cell lines treated with miR-659-3p mimic and inhibitor indicated that miR-659-miR-659-3p specifically modifies the expression of the transcription
factor CNOT1, and the expression of the AU-rich element (ARE)-containing target genes AKT3, BCL2, CYR61 and
THSB2, that belong to the focal adhesion pathway. Indeed,
BM-infiltrating cells express lower level of miR-659-3p,
higher level of CNOT1 and lower levels of AKT3, BCL2, THSB2 and CYR61 than NB primary tumors. Our finding
may pave the way to the development of new therapeutic strategies focused on targeting the metastatic process.
RESULTS
MiRNA profiling of NB BM-infiltrating cells and primary tumors
First, twelve BM-infiltrating cells and twelve
primary tumors were randomly selected from our bio-bank. Patients’ characteristics are reported in Table 1.
Each sample was tested for the expression of 670 different miRNAs by stem-loop RT-qPCR amplification of human miRNA cards. After data normalization using the small U6 RNA as endogenous reference, 160 miRNAs were found
to be differentially expressed between metastases and primary tumors with an adjusted p value < 0.05 (Figure 1
and Supplementary Table 1). The expression of 42 (26%)
miRNAs was lower and that of 118 was higher in
BM-infiltrating cells than in primary tumors. No significant
differences were observed when the samples were
stratified according to MYCN status.
To reduce the number of miRNAs to be validated and further investigated, additional selection criteria were
applied. First, we excluded significant miRNAs which
were not expressed in some samples of both groups, unless the number of samples with no expression in one group was at least twice the number of samples with no
expression in the other group. Fifty-three out of the 160
differentially expressed miRNAs (14 less and 39 more
expressed in BM-infiltrating cells than in primary tumors) passed this first selection (Supplementary Table 2). Then,
direct inspection of the expression levels’ distribution
was performed to identify the significant miRNAs with the highest differences between BM-infiltrating cells
and primary tumors. Precisely, only miRNAs for which
the first quartile of expression levels in one of the two
groups was higher than the third quartile in the other group
were considered. Twenty miRNAs, 4 less and 16 more expressed in BM-infiltrating cells than in primary tumors,
passed this second selection criterion (Table 2).
The expression of these 20 miRNAs was then tested
by RT-qPCR in additional 10 BM-infiltrating cells and 10 primary tumors, using the specific miRNA assays in 96 well
plates in triplicate. Six miRNAs, 3 less expressed
324-3p, miR-516a-324-3p, miR-659-3p) and 3 more expressed (miR-137, miR-301a-3p, miR-873-5p) in BM-infiltrating cells than in primary tumors, were significantly differentially
expressed also in this new set of samples (Table 2).
Next, we analyzed the expression of all 670 miRNAs in 4 paired BM-infiltrating cells and primary tumors
from 4 additional patients (Table 1). Although the power (sensitivity) of paired sample t test was low, the analysis
revealed that the BM-infiltrating cells and the corresponding
primary tumors differentially expressed 51 miRNAs, with 18 (35%) less expressed in the metastases.
Of these 51 miRNAs, eight were in common with
the 53 miRNAs that passed the first selection criterion
miRNAs that passed also the second selection (Table 2, in
bold). Of these three miRNAs, miR-516a-3p and miR-659-3p were significantly less expressed in BM-infiltrating cells
than in primary tumors in all sets of samples (Table 2).
MiRNA profiling of NB cell lines and adrenal tissue
To understand whether miR-516a-3p or miR-659-3p deserved further studies, the miRNA profiles of two NB
cell lines, the MYCN amplified HTLA-230 and the MYCN non amplified SH-SY5Y, were evaluated together with the miRNA profile of the normal adrenal gland. Comparison of the three profiles showed no differences for 482
miRNAs (Supplementary Table 3). Ninety miRNAs were
differentially expressed by HTLA-230 and SH-SY5Y, likely
because of the different MYCN status (Supplementary Table 4). Ninety-eight miRNAs were differentially expressed by normal adrenal gland and NB cell lines (Supplementary Table 5), supporting their putative implication in the neoplastic process.
Since miR-516a-3p was expressed at the same level
in the normal adrenal gland and NB cell lines, whereas
miR-659-3p was not expressed by the adrenal gland and
highly expressed in NB cell lines, we selected this latter miRNA for further studies.
Effects of miR-659-3p over-expression and suppression on gene expression
To evaluate the role of miR-659-3p and its target
[image:3.612.60.555.65.518.2]genes in the metastatic process, the HTLA-230 and
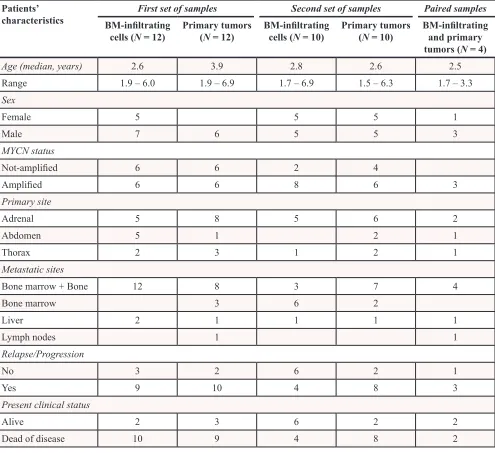
Table 1: Demographic, biological and clinical characteristics of the study patients
Patients’
characteristics BM-infiltrating First set of samples Second set of samples Paired samples cells (N = 12) Primary tumors (N = 12) BM-infiltrating cells (N = 10) Primary tumors (N = 10) BM-infiltrating and primary
tumors (N = 4)
Age (median, years) 2.6 3.9 2.8 2.6 2.5 Range 1.9 – 6.0 1.9 – 6.9 1.7 – 6.9 1.5 – 6.3 1.7 – 3.3 Sex
Female 5 5 5 1
Male 7 6 5 5 3
MYCN status
Not-amplified 6 6 2 4
Amplified 6 6 8 6 3
Primary site
Adrenal 5 8 5 6 2
Abdomen 5 1 2 1
Thorax 2 3 1 2 1
Metastatic sites
Bone marrow + Bone 12 8 3 7 4
Bone marrow 3 6 2
Liver 2 1 1 1 1
Lymph nodes 1 1
Relapse/Progression
No 3 2 6 2 1
Yes 9 10 4 8 3
Present clinical status
Alive 2 3 6 2 2
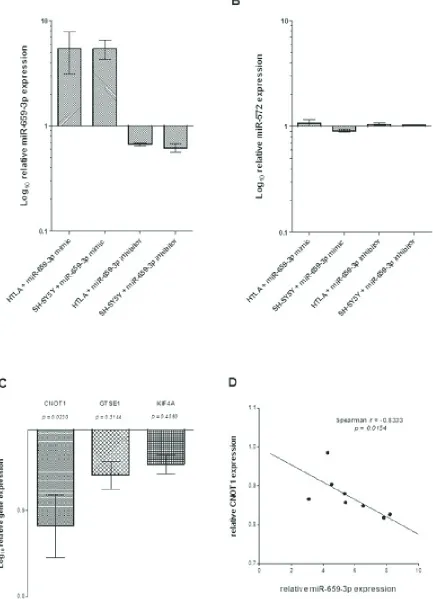
SH-SY5Y NB cell lines were transfected with specific miR-659-3p or irrelevant miRNA mimic and inhibitor. As shown in Figure 2A, treatment with miR-659-3p mimic
and inhibitor respectively increased and decreased
miR-659-3p expression as compared to cells treated with the
irrelevant mimic and inhibitor, whereas the expression of
the unrelated miR-572 was unaffected (Figure 2B). To identify miR-659-3p target genes, the whole genome expression profiles of HTLA-230 and SH-SY5Y cells transfected with miR-659-3p mimic and
inhibitor were compared to those of cells transfected with irrelevant miRNA mimic and inhibitor, respectively.
Statistical analysis of the eight profiles demonstrated that the expression of 2073 probes was specifically and inversely modified by miR-659-3p mimic and inhibitor (Supplementary Data). These 2073 probes were merged with the probes differentially expressed by BM-infiltrating
cells and primary tumors ([10], GEO accession number
GSE 25623a). Thirty-four genes more expressed in BM-infiltrating cells than primary tumors were also more expressed in the NB cell lines treated with the
miR-659-3p inhibitor (Table 3). These genes were checked for the
presence of 3’-UTR sequence recognized by
miR-659-3p by TargetScan (www.targetscan.org), and 3 genes (CNOT1, GTSE1 and KIF4A) were identified.
As shown in Figure 2C, RT-qPCR analysis
confirmed that CNOT1 expression was specifically and
significantly modified by miR-659-3p mimic and inhibitor
treatment, whereas GTSE1 and KIF4A expression was not affected by the treatment. Moreover, in NB cell lines
treated with miR-659-3p mimic and inhibitor, CNOT1 expression levels inversely correlated to miR-659-3p
expression levels (Figure 2D). Taken together, these
findings demonstrated that CNOT1 expression in NB cells
was specifically modified by miR-659-3p.
Since CNOT1 encodes a transcription factor that degrades mRNAs containing ARE sequences [28], over-expression of CNOT1, subsequent to decreased
expression of miR-659-3p, should reduce the expression
of ARE-containing genes. We thus checked the 51 genes
differentially expressed by BM-infiltrating cells and
primary tumors, and over-expressed in NB cell lines
treated with miR-659-3p mimic (Table 3), for the presence
of ARE sequence by consulting the http://brp.kfshrc.edu. sa/ARED website.
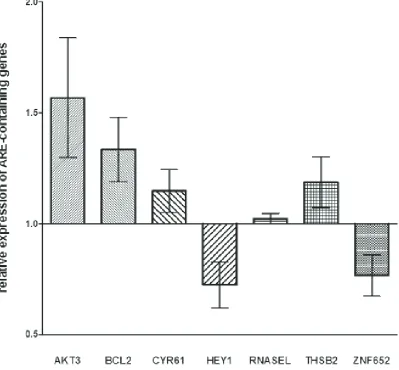
Twelve genes (AHCYL2, AKT3, BCL2, CYR61,
DST, GFOD1, HEY1, IKZF4, LPHN3, RNASEL, THBS2, and ZNF652) were identified. In the
miR-659-3p-transfected NB cell lines, the expression of AKT3, BCL2, CYR61 and THSB2 was confirmed to be specifically modified by miR-659-3p mimic and inhibitor, whereas
that of RNASEL was not affected by the treatment and that of HEY1 and ZNF652 occurred in the wrong direction (Figure 3).
Figure 1: Heat-map of miRNAs differentially expressed by BM-infiltrating cells and primary tumors. The miRNA
expression profiles of 12 BM-infiltrating cells and 12 primary tumors were analyzed by R of Bioconductor and the miRNAs differentially
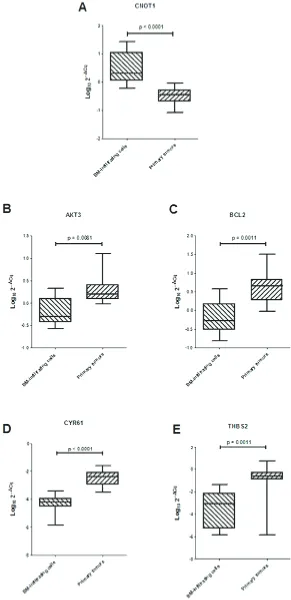
[image:4.612.155.405.45.348.2]Validation of differential expression of CNOT1, AKT3, BCL2, CYR61 and THBS2 genes in BM-infiltrating cells and primary tumors
Gene ontology search for AKT3, BCL2, CYR61 and
THBS2 genes in the http://david.abcc.ncifcrf.gov/ website indicated that they belong to the focal adhesion pathway.
Thus, ten BM-infiltrating cells and ten primary tumors were analyzed by RT-qPCR to confirm that miR-659-3p reduced expression in BM-infiltrating cells associated to
over-expression of CNOT1 and reduced expression of AKT3, BCL2, CYR61 and THBS2 genes, as compared to primary
tumors. Indeed, in BM-infiltrating cells, CNOT1 expression
was significantly higher, and AKT3, BCL2, CYR61 and THSB2 expressions were all significantly lower than in primary tumors (Figure 4). This finding supports the hypothesis that
the metastatic process in human NB involves alteration of the focal adhesion pathway by regulation of CNOT1 levels
determined in turn by miR-659-3p expression level.
DISCUSSION
In all sets of samples from stage M NB patients,
miR-659-3p expression resulted significantly lower in BM-infiltrating cells than in primary tumors. Several miRNAs other than miR-659-3p differentially expressed
by NB tumors and metastases may deserve further attention as potential drivers of the metastatic process.
In particular, the miRNAs previously shown to influence
migration and invasion in vitro and in murine models
[12,16,18,22].
Nonetheless, in this first report on miRNA profile of human metastatic BM-infiltrating NB cells and on its
comparison to that of human NB primary tumors, we decided to focus on the miRNA that was unequivocally differentially expressed by the two groups. Comparison
[image:5.612.61.559.65.466.2]of 670 miRNA expression levels in a first set of BM-infiltrating and primary tumors indicated that 160 miRNAs were significantly differently expressed in the
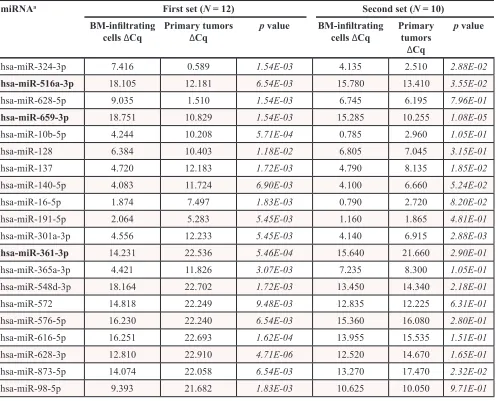
Table 2: Expression values of the selected 20 miRNAs
miRNAa First set (N = 12) Second set (N = 10)
BM-infiltrating
cells ∆Cq Primary tumors ∆Cq p value BM-infiltrating cells ∆Cq Primary tumors ∆Cq
p value
hsa-miR-324-3p 7.416 0.589 1.54E-03 4.135 2.510 2.88E-02
hsa-miR-516a-3p 18.105 12.181 6.54E-03 15.780 13.410 3.55E-02
hsa-miR-628-5p 9.035 1.510 1.54E-03 6.745 6.195 7.96E-01
hsa-miR-659-3p 18.751 10.829 1.54E-03 15.285 10.255 1.08E-05
hsa-miR-10b-5p 4.244 10.208 5.71E-04 0.785 2.960 1.05E-01
hsa-miR-128 6.384 10.403 1.18E-02 6.805 7.045 3.15E-01
hsa-miR-137 4.720 12.183 1.72E-03 4.790 8.135 1.85E-02
hsa-miR-140-5p 4.083 11.724 6.90E-03 4.100 6.660 5.24E-02 hsa-miR-16-5p 1.874 7.497 1.83E-03 0.790 2.720 8.20E-02
hsa-miR-191-5p 2.064 5.283 5.45E-03 1.160 1.865 4.81E-01
hsa-miR-301a-3p 4.556 12.233 5.45E-03 4.140 6.915 2.88E-03
hsa-miR-361-3p 14.231 22.536 5.46E-04 15.640 21.660 2.90E-01
hsa-miR-365a-3p 4.421 11.826 3.07E-03 7.235 8.300 1.05E-01
hsa-miR-548d-3p 18.164 22.702 1.72E-03 13.450 14.340 2.18E-01 hsa-miR-572 14.818 22.249 9.48E-03 12.835 12.225 6.31E-01 hsa-miR-576-5p 16.230 22.240 6.54E-03 15.360 16.080 2.80E-01 hsa-miR-616-5p 16.251 22.693 1.62E-04 13.955 15.535 1.51E-01 hsa-miR-628-3p 12.810 22.910 4.71E-06 12.520 14.670 1.65E-01 hsa-miR-873-5p 14.074 22.058 6.54E-03 13.270 17.470 2.32E-02
hsa-miR-98-5p 9.393 21.682 1.83E-03 10.625 10.050 9.71E-01
Figure 2: (A) Expression of miR-659-3p, (B) miR-572, (C) CNOT1, GSTE1 and KIF4A and (D) inverse correlation between miR-659-3p and CNOT1 expression in HTLA-230 and SH-SY5Y cells treated with miR-659-3p mimic and inhibitor. Results of RT-qPCR analysis from two independent experiments are reported as Log10 of relative expression respect to that occurring in cells treated with irrelevant miRNA mimic and inhibitor. Standard errors are indicated. The RT-qPCR data
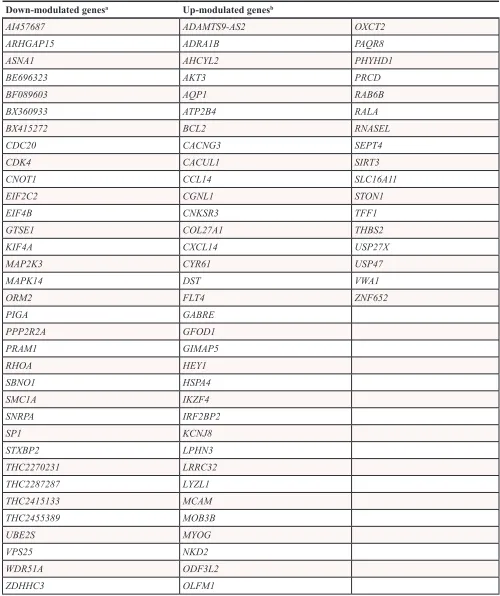
[image:6.612.95.528.55.654.2]Table 3: Genes specifically modulated by treatment with miR-659-3p mimic, known to be
differentially expressed by BM-infiltrating cells and primary tumors
Down-modulated genesa Up-modulated genesb
AI457687 ADAMTS9-AS2 OXCT2
ARHGAP15 ADRA1B PAQR8
ASNA1 AHCYL2 PHYHD1
BE696323 AKT3 PRCD
BF089603 AQP1 RAB6B
BX360933 ATP2B4 RALA
BX415272 BCL2 RNASEL
CDC20 CACNG3 SEPT4
CDK4 CACUL1 SIRT3
CNOT1 CCL14 SLC16A11
EIF2C2 CGNL1 STON1
EIF4B CNKSR3 TFF1
GTSE1 COL27A1 THBS2
KIF4A CXCL14 USP27X
MAP2K3 CYR61 USP47
MAPK14 DST VWA1
ORM2 FLT4 ZNF652
PIGA GABRE
PPP2R2A GFOD1
PRAM1 GIMAP5
RHOA HEY1
SBNO1 HSPA4
SMC1A IKZF4
SNRPA IRF2BP2
SP1 KCNJ8
STXBP2 LPHN3
THC2270231 LRRC32
THC2287287 LYZL1
THC2415133 MCAM
THC2455389 MOB3B
UBE2S MYOG
VPS25 NKD2
WDR51A ODF3L2
ZDHHC3 OLFM1
a:Genes down-modulated following miR-659-3p over-expression, up-regulated following miR-659-3p suppression,
up-modulated in BM-infiltrating cells.
b:Genes up-modulated following miR-659-3p over-expression, down-modulated following miR-659-3p suppression,
[image:7.612.56.556.79.675.2]two groups of samples. Interestingly, 14 miRNAs
over-expressed in BM-infiltrating cells were in common with
those differentially expressed in a metastatic murine xenograft model, obtained by injection of a human NB
cell line in nude mice [27]. However, 6 of these miRNAs
were more expressed in the subcutaneous tumors and 8 over-expressed in the murine metastases. Among these latter miRNAs, miR-23a and miR-15 promoted in vitro
migration of NB cell lines by targeting CDH1 [20] and
RECK [22], respectively. Conversely, miR-335 suppressed
invasion through the TGF-β pathway [16], and miR-9 and
miR-542-5p over-expression in human NB primary tumors associated to a better survival [12,18,23], making unlikely a positive role in the human metastatic process.
Variability in the results obtained in different settings can be due to methodological reasons, such as the type of samples (human cells versus xenografts), miRNA analysis (array versus RT-qPCR) and normalization procedures (multiple versus single miRNA), just to name a
few. An additional cause can be the wide range of miRNA
expression levels observed in both BM-infiltrating cells
and primary tumors. Heterogeneity of miRNA expression in human primary tumors has been previously reported [23–25], and phenotypic and genetic NB heterogeneity is a well-known feature of this pediatric cancer [29]. Since the heterogeneity occurs also within the high-risk
stage M subset, generalization of findings in human NB is difficult [30]. Therefore, it is plausible that differences
[image:8.612.109.508.52.422.2]in miRNA expression levels between MYCN-amplified and -no amplified tumors previously observed by others [13,15,19] and not confirmed here were hidden by the
wide variability.
Here, the analysis of ten additional BM-infiltrating and primary tumors and four paired BM-infiltrating cells
and corresponding primary tumors demonstrated that
miR-659-3p was always less expressed in human NB
metastases as compared to primary tumors. In addition,
miR-659-3p was not expressed in normal adrenal gland,
Figure 3: Expression levels of genes containing ARE-sequence in HTLA-230 and SH-SY5Y cells treated with miR-659-3p mimic and inhibitor. Results of RT-qPCR analysis from two independent experiments are reported as Log10 of relative expression respect to
that occurring in cells treated with irrelevant miRNA mimic and inhibitor. Standard errors are indicated. All p values were not significant. The
Figure 4: (A) Expression levels of CNOT1 and (B–E) ARE-sequence containing genes involved in focal adhesion pathway in 10 BM-infiltrating and 10 primary tumors. Data are expressed as Log10 2−ΔCq values, were ΔCq is the difference between the
[image:9.612.160.451.49.649.2]supporting its role in the neoplastic process. In vitro experiments with miR-659-3p mimic and inhibitor
allowed to identify CNOT1 as its target gene in human NB. CNOT1 (CCR4-NOT transcription complex, subunit 1), fundamental for maintenance of embryonic stem cell identity [28], is a negative regulator of transcription because it degrades mRNAs containing ARE sequences [31]. The higher expression of CNOT1 driven by the lower
expression of miR-659-3p leaded to reduced expression of
four ARE-containing mRNAs, AKT3, BCL2, CYR61 and
THBS2, belonging to the focal adhesion pathway. Indeed,
in BM-infiltrating cells, the lower expression of miR-659-3p associated to higher levels of CNOT1 and lower expression of AKT3, BCL2, CYR61 and THBS2 mRNAs, as compared to primary tumors.
The differential expression of these genes was already reported by us [10], but their relationships were
unknown, as well as with miR-659-3p. AKT3 codes for a member of the AKT serine/threonine protein kinase family. AKT kinases are regulators of cell signaling in response to platelet-derived growth factor (PDGF), insulin, and insulin-like growth factor 1 (IGF1). AKT3 exerts negative effects on tumor endothelial cell growth and migration by inhibiting the activation of translation regulatory kinase
S6K [32]. BCL2 codes for an integral outer mitochondrial membrane protein that blocks apoptotic death [33],
CYR61 codes for a protein that interact with several integrins and heparin-sulfate proteoglycans [34], and
THSB2 codes for thrombospondin 2, a disulfide-linked
homo-trimeric glycoprotein that mediates cell-to-cell and cell-to-matrix interactions and strongly inhibits invasion and metastases [35]. Thus, the products of these genes suppress angiogenesis and proliferation and inhibit tumor cell invasion and metastases.
CONCLUSIONS
Taken together the results of our study support the hypothesis that the metastatic process in human NB involves alteration of the focal adhesion pathway, through the increased expression of CNOT1, driven by
decreased expression of miR-659-3p. Thus, avoiding the
disruption of the structural architecture by increasing
miR-659-3p expression may dampen the metastatic process.
Adjuvant therapy with AKT activators or metallo-protease
inhibitors, together with targeted delivery of miR-659-3p
mimic, could be considered in relapsed or refractory stage M NB patients.
METHODS
BM-infiltrating NB cells and NB primary tumor cells
Twenty-two BM-infiltrating GD2+ cell samples
were immune-selected at diagnosis, as previously
described [8]. Simultaneously, 22 frozen primary tumor specimens, containing more than 80% NB cells, were selected from our bio-bank to possibly match the demographic, biological and clinical characteristics of the
BM-infiltrating samples. All samples belonged to stage M
[2] NB patients aged more than 12 months at diagnosis. Each group of samples was then randomly divided. Twelve
BM-infiltrating NB cells and twelve primary tumors were used to determine the complete miRNA profiling and identify the miRNAs whose expression was significantly
different between primary tumors and metastases.
After reducing the number of miRNAs to be validated by applying two selection criteria (see statistical
analysis for details), 20 significant differentially expressed
miRNAs were evaluated in the remaining ten
BM-infiltrating cells and ten primary tumors. In addition, paired BM-infiltrating NB cells and corresponding primary
tumors from 4 stage M patients were subjected to complete
miRNA profiling to confirm the differential expression of
the validated miRNAs. The demographic, biological and clinical characteristics of the patients included in the study,
retrieved from the Italian Neuroblastoma Registry [36],
are reported in Table 1.
NB cell lines and transfection experiments
HTLA-230 (kindly donated by Dr E. Bogenman,
Los Angeles, USA) and SH-SY5Y (purchased from Banca
Biologica and Cell Factory, Genoa, Italy) NB cell lines
were cultured in RPMI 1640 medium supplemented with
10% heat inactivated FCS, 50 mg/ml streptomycin, 50 mg/ ml penicillin and 2 mM glutamine (Sigma-Aldrich, Milan, Italy). The HTLA-230 cells present MYCN amplification and the SH-SY5Y cells have normal MYCN status. Both cell lines were checked for morphology, proliferation rate, mycoplasma contamination and MYCN amplification after
thawing and within four passages in culture.
To evaluate the effect of miR-659-3p over-expression
and suppression on gene expression, 1x10⁶ HTLA-230 and
SH-SY5Y cells were transfected with specific
miR-659-3p mirVana™ mimic and inhibitor, respectively (Ambion, Life Technologies, Carlsbad, CA, USA, catalog# MC and MH 11582). Samples transfected with mirVana™ miRNA Mimic Negative Control #1 and mirVana™ miRNA Inhibitor Negative Control #1 were used as reference conditions. Transfection was performed at 20 nM miRNA concentration in OptiMEM© medium (Sigma-Aldrich), using
Lipofectamin RNAiMAX© (Life Technologies), according
to manufacturer’s protocol. Cells were then cultured for 48 hours, checked for viability and processed for miRNA and total mRNA extraction, as described below. Transfection experiments were performed twice.
RNA extraction
Total RNA and miRNA fractions were extracted
transfected NB cell lines using the miRNeasy Mini kit (Qiagen, Hilden, Germany), according to manufacturer’s protocols. Total RNA and miRNA fractions from whole adrenal gland (cortex + medulla) were purchased from Ambion© (Life Technologies). Quality of the RNA
fractions was evaluated by RNA 6000 Nano kit in the
BioAnalyzer 2100 system (Agilent Technologies, Santa Clara, CA, USA).
MiRNA profiling
The miRNA fraction of each sample was subjected
to stem-loop RT-qPCR amplification, as described [37].
Precisely, 30 ng of the miRNA fraction were reverse transcribed using the Megaplex RT Primers Human Pool A and B. At the end of the reaction, each RT product was
amplified with the Megaplex PreAmp Primers A and B for 25 cycles. Then, the amplification products were loaded
onto MicroRNA TaqMan Card A and B, respectively.
Card amplifications were performed on ViiA7 equipment
for 40 cycles. All reagents and equipment were from Life Technologies. Results were expressed as delta Cq by
subtracting the Cq value obtained for U6 small RNA from
the Cq value of each miRNA. For unexpressed miRNAs the Cq value was set at 40.
To validate the differential expression of the selected
20 miRNAs, reverse-transcribed and pre-amplified miRNA fractions from 10 additional BM-infiltrating and 10 primary tumors were amplified in a 96 well plate in triplicate using the specific TaqMan© human microRNA
assays (hsa-miR-324-3p, catalog #002161; hsa-miR-516-3p, catalog #001149; hsa-miR-628-5p, catalog #002433; hsa-miR-659-3p, catalog #001514; hsa-miR-10b, catalog #002218; hsa-miR-128, catalog #002216; mmu-miR-137, catalog #01129; mmu-miR-140, catalog #001187; hsa-miR-16, catalog #000391, hsa-miR-191, catalog #002299; hsa-miR-301, catalog #000528; hsa-miR-361-3p, catalog #002116; hsa-miR-365, catalog #001020; hsa-miR-548d-3p, catalog #001605; hsa-miR-572, catalog #001614; hsa-miR-576-5p, catalog #002350, hsa-miR-616, catalog #001589; hsa-miR-628-3p, catalog #002434; hsa-miR-873, catalog #002356; hsa-miR-98, catalog #000577; U6 snRNA, catalog #001973, Life Technologies). Amplification with U6 assay was used as
endogenous reference and results were expressed as delta Cq, as described above.
To confirm increase and decrease of
miR-659-3p expression following transfection with miR- mimic and inhibitor, respectively, the miRNA fraction isolated from each transfected cells was reverse transcribed using the Megaplex RT Primers Human Pool A and B
and then amplified with the TaqMan© human
miR-659-3p assay in triplicates in a 96 well plate. As control of specificity, each sample was tested in triplicates for miR-572 expression using the specific TaqMan© assay.
Amplification data were normalized to U6 snRNA
expression (Life Technologies, see above for catalog number). Results are shown as Log10 relative expression
with respect to that of cells transfected with the irrelevant mimic and inhibitor set to 1.
Microarray analysis
Total RNA extracted from HTLA-230 and
SH-SY5Y cells transfected with miR-659-3p and irrelevant
mimic and inhibitor from the two experiments were pooled. Two-hundred ng of each of the eight samples were hybridized to Human GE 4x44K v2 Microarray Kit (Agilent Technologies) containing probes for 41,000 human transcripts. One-color microarray-based gene expression analysis using the Low Input Quick
Amp Labeling v6.5 protocol (www.agilent.com) was
performed. Slides were scanned by Agilent G2505C scanner and images were processed by Feature Extraction software (Agilent Technologies). Microarray data are MIAME compliant and the raw data have been deposited in National Center for Biotechnology Information Gene Expression Omnibus (GEO, www.ncbi.nlm.nih.gov/
geo/, accession number GSE65153). Microarray data
were analyzed as described in the statistical analysis
section, and the probes whose expression was specifically modified by the miR-659-3p mimic and inhibitor were
merged to the probes differentially expressed by
BM-infiltrating cells and primary tumors ([10], GEO accession number GSE 25623a).
Gene expression analysis
To evaluate gene expression levels in miR-659-3p
transfected cells, 150 ng of total RNA was reverse transcribed
as described [8,38], and then amplified in triplicate with the specific TaqMan© human gene expression assay
(CNOT1: Hs00406740_m1, GTSE1: Hs00212681_m1, KIF4A: Hs00602211_g1, AKT3: Hs00987350_m1, BCL2:
Hs00608023_m1, CYR61: Hs00998500_g1, HEY1:
Hs01114113_m1, RNASEL: Hs00221692_m1, THBS2:
Hs01568063_m1, ZNF652: Hs00977533_m1), and for HPRT1 (Hs99999909_m1) as endogenous reference gene
(Life Technologies). Results are shown as Log10 relative
expression with respect to that of cells treated with the irrelevant mimic and inhibitor, set to 1.
To evaluate gene expression levels in
BM-infiltrating and primary tumors, total RNA was extracted
and reverse transcribed from ten samples per group, as
described [8]. Amplification was performed in triplicate using the specific TaqMan© human gene expression assay
(see above), and HPRT1 as endogenous reference gene. Relative expression was calculated as Log10 of 2−ΔCq,
where ΔCq is the difference between the Cq of the target
Statistical analysis
Analysis of miRNA expression Cq values from high-throughput qPCR assays was conducted using the HTqPCR package [39] of Bioconductor [40], which runs on R statistical computing environment
(http://www.R-project.org/). To reduce the number of significant miRNAs differentially expressed between BM-infiltrating cells and
primary tumors that deserved further studies, two selection criteria were sequentially applied. First, we excluded
significant miRNAs unexpressed in some samples of both
groups, unless the number of samples in one group was at least twice the number of samples with no expression in the other group. Then, direct inspection of the distribution
of expression values among the 12 BM-infiltrating cells
and the 12 primary tumors was performed. Only miRNAs
whose first quartile of expression levels in one of the two
groups was higher than the third quartile in the other group were accepted.
Difference in miRNA expression levels in
BM-infiltrating cells and primary tumors evaluated by RT-qPCR in 96 well plates were tested by performing
Mann-Whitney rank test, adjusting p values to face multiple comparison problems, according to the Benjamini-Hochberg procedure [41].
Differential whole gene expression analysis of cell
lines transfected with miR-659-3p and irrelevant mimic
and inhibitor was performed using the limma package of Bioconductor [42,43]. Data were preliminarly corrected for background [44] and normalized in order to have similar distributions across the set of arrays. Ranking of genes by their evidence for differential expression was made using the paired moderated t-statistics based on empirical Bayes moderation of the standard errors [42].
Differences in gene expression levels evaluated
by RT-qPCR in BM-infiltrating cells and primary tumors
were tested by the Mann-Whitney rank test using the Prism software (GraphPad Software Inc., La Jolla, CA, USA).
ACkNOwLEDGMENTS
This study was supported by Fondazione Italiana Neuroblastoma, by Ministero della Salute (Cinque per mille e Ricerca Corrente), AIRC and ENCCA.
The excellent data management of Giovanni Erminio at the Italian Neuroblastoma Registry is deeply acknowledged. SS is recipient of an AIRC fellowship, BC and MM are recipients of Fondazione Italiana Neuroblastoma fellowships.
CONFLICTS OF INTEREST
The authors declare that there is no conflicts of
interests regarding the publication of this paper.
Author contributions
SS, PS, CL, LP, LV and MVC: conception and design of the study, analysis and interpretation of the results, writing of the manuscript
BC, FM, MM, ARG, MRE, EV, VC, MC, collection and analysis of samples, acquisition of data
SS, PS, CL, LP, BC, LV, FM, MM, ARG, MRE, EV,
VC, MC and MVC: final approval of the manuscript.
REFERENCES
1. Brodeur GM, Pritchard J, Berthold F, Carlsen NL, Castel V, Castelberry RP, De Bernardi B, Evans AE, Favrot M, Hedborg F, et al. Revisions of the international criteria for neuroblastoma diagnosis, staging, and response to
treat-ment. J Clin Oncol. 1993; 11:1466–1477.
2. Cohn SL, Pearson AD, London WB, Monclair T, Ambros PF, Brodeur GM, Faldum A, Hero B, Iehara T, Machin D, Mosseri V, Simon T, Garaventa A, Castel V, Matthay KK. The International Neuroblastoma Risk Group
(INRG) classification system: an INRG Task Force report. J Clin Oncol. 2009; 27:289–297.
3. Carlisle AJ, Lyttle CA, Carlisle RY, Maris JM. CXCR4
expression heterogeneity in neuroblastoma cells due to
ligand-independent regulation. Mol Cancer. 2009; 8:126.
4. Geminder H, Sagi-Assif O, Goldberg L, Meshel T, Rechavi G, Witz IP, Ben-Baruch A. A possible role for CXCR4 and its ligand, the CXC chemokine stromal cell-derived factor-1, in the development of bone marrow
metas-tases in neuroblastoma. J Immunol. 2001; 167:4747–4757.
5. Livak KJ, Schmittgen TD. Analysis of relative gene expres-sion data using real-time quantitative PCR and the 2(-Delta
Delta C(T)) Method. Methods. 2001; 25:402–408. 6. Nevo I, Sagi-Assif O, Meshel T, Geminder H,
Goldberg-Bittman L, Ben-Menachem S, Shalmon B, Goldberg I, Ben-Baruch A, Witz IP. The tumor microenvironment: CXCR4 is associated with distinct protein expression
patterns in neuroblastoma cells. Immunol Lett. 2004; 92:163–169.
7. Airoldi I, Raffaghello L, Piovan E, Cocco C, Carlini B, Amadori A, Corrias MV, Pistoia V. CXCL12 does not attract CXCR4+ human metastatic neuroblastoma cells:
clinical implications. Clin Cancer Res. 2006; 12:77–82.
8. Scaruffi P, Morandi F, Gallo F, Stigliani S, Parodi S, Moretti S, Bonassi S, Fardin P, Garaventa A, Zanazzo G,
Pistoia V, Tonini GP, Corrias MV. Bone marrow of neu-roblastoma patients shows downregulation of CXCL12 expression and presence of IFN signature. Pediatr Blood
Cancer. 2012; 59:44–51.
neuroblastoma cells from bone marrow aspirates for pre-treatment risk assessment by array comparative genomic
hybridization. Int J Cancer. 2012; 130:1098–1108.
10. Morandi F, Scaruffi P, Gallo F, Stigliani S, Moretti S,
Bonassi S, Gambini C, Mazzocco K, Fardin P, Haupt R, Arcamone G, Pistoia V, Tonini GP, Corrias MV. Bone
marrow-infiltrating human neuroblastoma cells express
high levels of calprotectin and HLA-G proteins. PLoS One.
2012; 7:e29922.
11. Nevo I, Sagi-Assif O, Meshel T, Ben-Baruch A, Johrer K,
Greil R, Trejo LE, Kharenko O, Feinmesser M, Yron I,
Witz IP. The involvement of the fractalkine receptor in the transmigration of neuroblastoma cells through bone-marrow
endothelial cells. Cancer Lett. 2009; 273:127–139.
12. Bray I, Tivnan A, Bryan K, Foley NH, Watters KM, Tracey L, Davidoff AM, Stallings RL. MicroRNA-542-5p as a novel tumor suppressor in neuroblastoma. Cancer Lett.
2011; 303:56–64.
13. Foley NH, Bray IM, Tivnan A, Bryan K, Murphy DM, Buckley PG, Ryan J, O’Meara A, O’Sullivan M, Stallings RL. MicroRNA-184 inhibits neuroblastoma cell survival through targeting the serine/threonine kinase
AKT2. Mol Cancer. 2010; 9:83.
14. Mestdagh P, Bostrom AK, Impens F, Fredlund E, Van Peer G, De Antonellis P, von Stedingk K, Ghesquiere B, Schulte S, Dews M, Thomas-Tikhonenko A, Schulte JH,
Zollo M, Schramm A, Gevaert K, Axelson H, Speleman F, Vandesompele J. The miR-17-92 microRNA cluster regu -lates multiple components of the TGF-beta pathway in
neu-roblastoma. Mol Cell. 2010; 40:762–773.
15. Tivnan A, Tracey L, Buckley PG, Alcock LC, Davidoff AM, Stallings RL. MicroRNA-34a is a potent tumor suppressor molecule in vivo in neuroblastoma. BMC
Cancer. 2011; 11:33.
16. Lynch J, Fay J, Meehan M, Bryan K, Watters KM, Murphy DM, Stallings RL. MiRNA-335 suppresses neu-roblastoma cell invasiveness by direct targeting of multiple genes from the non-canonical TGF-beta signalling pathway.
Carcinogenesis. 2012; 33:976–985.
17. Zhang H, Pu J, Qi T, Qi M, Yang C, Li S, Huang K, Zheng L, Tong Q. MicroRNA-145 inhibits the growth,
invasion, metastasis and angiogenesis of neuroblastoma cells through targeting hypoxia-inducible factor 2 alpha.
Oncogene. 2014; 33:387–397.
18. Zhang H, Qi M, Li S, Qi T, Mei H, Huang K, Zheng L,
Tong Q. microRNA-9 targets matrix metalloproteinase 14 to inhibit invasion, metastasis, and angiogenesis of
neuro-blastoma cells. Mol Cancer Ther. 2012; 11:1454–1466.
19. Creevey L, Ryan J, Harvey H, Bray IM, Meehan M,
Khan AR, Stallings RL. MicroRNA-497 increases apopto
-sis in MYCN amplified neuroblastoma cells by targeting the key cell cycle regulator WEE1. Mol Cancer. 2013; 12:23.
20. Cheng L, Yang T, Kuang Y, Kong B, Yu S, Shu H, Zhou H,
Gu J. MicroRNA-23a promotes neuroblastoma cell
metasta-sis by targeting CDH1. Oncol Lett. 2014; 7:839–845.
21. Ma L, Young J, Prabhala H, Pan E, Mestdagh P, Muth D,
Teruya-Feldstein J, Reinhardt F, Onder TT, Valastyan S, Westermann F, Speleman F, Vandesompele J, Weinberg RA.
miR-9, a MYC/MYCN-activated microRNA, regulates E-cadherin and cancer metastasis. Nat Cell Biol. 2010; 12:247–256.
22. Xin C, Buhe B, Hongting L, Chuanmin Y, Xiwei H, Hong Z, Lulu H, Qian D, Renjie W. MicroRNA-15a pro -motes neuroblastoma migration by targeting reversion-inducing cysteine-rich protein with Kazal motifs (RECK) and regulating matrix metalloproteinase-9 expression. The
FEBS Journal. 2013; 280:855–866.
23. Schulte JH, Schowe B, Mestdagh P, Kaderali L, Kalaghatgi P, Schlierf S, Vermeulen J, Brockmeyer B, Pajtler K, Thor T, de Preter K, Speleman F, Morik K, Eggert A, Vandesompele J, Schramm A. Accurate predic-tion of neuroblastoma outcome based on miRNA
expres-sion profiles. Int J Cancer. 2010; 127:2374–2385.
24. Lin RJ, Lin YC, Chen J, Kuo HH, Chen YY, Diccianni MB, London WB, Chang CH, Yu AL. microRNA signature and
expression of Dicer and Drosha can predict prognosis and
delineate risk groups in neuroblastoma. Cancer Res. 2010; 70:7841–7850.
25. De Preter K, Mestdagh P, Vermeulen J, Zeka F, Naranjo A,
Bray I, Castel V, Chen C, Drozynska E, Eggert A, Hogarty MD, Izycka-Swieszewska E, London WB, et al.
miRNA expression profiling enables risk stratification in
archived and fresh neuroblastoma tumor samples. Clin
Cancer Res. 2011; 17:7684–7692.
26. Scaruffi P, Stigliani S, Moretti S, Coco S, De Vecchi C,
Valdora F, Garaventa A, Bonassi S, Tonini GP. Transcribed-Ultra Conserved Region expression is asso-ciated with outcome in high-risk neuroblastoma. BMC
Cancer. 2009; 9:441.
27. Guo J, Dong Q, Fang Z, Chen X, Lu H, Wang K, Yin Y, Cai X, Zhao N, Chen J, Zen K, Zhang J, Zhang CY. Identification
of miRNAs that are associated with tumor metastasis in
neu-roblastoma. Cancer Biol Ther. 2010; 9:446–452.
28. Kamon M, Katano M, Hiraki-Kamon K, Hishida T,
Nakachi Y, Mizuno Y, Okazaki Y, Suzuki A, Hirasaki M, Ueda A, Nishimoto M, Kato H, Okuda A. Identification of
Ccr4-Not Complex Components as Regulators of Transition from Partial to Genuine Induced Pluripotent Stem Cells.
Stem Cells Dev. 2014; 23:2170–2179.
29. Maris JM. Recent advances in neuroblastoma. N Engl J
Med. 2010; 362:2202–2211.
30. Speleman F, De Preter K, Vandesompele J. Neuroblastoma genetics and phenotype: a tale of heterogeneity. Semin
Cancer Biol. 2011; 21:238–244.
31. Xu K, Bai Y, Zhang A, Zhang Q, Bartlam MG. Insights into
the structure and architecture of the CCR4-NOT complex.
Front Genet. 2014; 5:137.
32. Phung TL, Du W, Xue Q, Ayyaswamy S, Gerald D,
Antonello Z, Nhek S, Perruzzi C, Acevedo I,
Lev D, Geeganage S, Benjamin LE. Akt1 and Akt3 exert opposing roles in the regulation of vascular tumor growth.
Cancer Res. 2015; 75:40–50.
33. Green DR, Galluzzi L, Kroemer G. Cell biology. Metabolic
control of cell death. Science. 2014; 345:1250256.
34. Lau LF. CCN1/CYR61: the very model of a modern matri
-cellular protein. Cell Mol Life Sci. 2011; 68:3149–3163.
35. Sun R, Wu J, Chen Y, Lu M, Zhang S, Lu D, Li Y. Down
regulation of Thrombospondin2 predicts poor prognosis in
patients with gastric cancer. Mol Cancer. 2014; 13:225. 36. Haupt R, Garaventa A, Gambini C, Parodi S, Cangemi G,
Casale F, Viscardi E, Bianchi M, Prete A, Jenkner A, Luksch R, Di Cataldo A, Favre C, et al. Improved survival
of children with neuroblastoma between 1979 and 2005. a
report of the Italian Neuroblastoma Registry. J Clin Oncol.
2010; 28:2331–2338.
37. Mestdagh P, Feys T, Bernard N, Guenther S, Chen C, Speleman F, Vandesompele J. High-throughput
stem-loop RT-qPCR miRNA expression profiling using minute amounts of input RNA. Nucleic Acids Res. 2008; 36:e143.
38. Corrias MV, Haupt R, Carlini B, Cappelli E, Giardino S, Tripodi G, Tonini GP, Garaventa A, Pistoia V, Pistorio A. Multiple target molecular monitoring of bone marrow and peripheral blood samples from patients with localized
neuroblastoma and healthy donors. Pediatr Blood Cancer.
2012; 58:43–49.
39. Dvinge H, Bertone P. HTqPCR: high-throughput analysis and visualization of quantitative real-time PCR data in R.
Bioinformatics. 2009; 25:3325–3326.
40. Gentleman RC, Carey VJ, Bates DM, Bolstad B,
Dettling M, Dudoit S, Ellis B, Gautier L, Ge YC, Gentry J,
Hornik K, Hothorn T, Huber W, et al. Bioconductor: open software development for computational biology and
bioin-formatics. Genome Biol. 2004; 5.
41. Benjamini Y, Hochberg Y. Controlling the False Discovery
Rate - a Practical and Powerful Approach to Multiple
Testing. J Roy Stat Soc B Met. 1995; 57:289–300.
42. Smyth GK. Linear models and empirical bayes methods for assessing differential expression in microarray experiments.
Stat Appl Genet Mol Biol. 2004; 3:3.
43. Smyth GK, Michaud J, Scott HS. Use of within-array replicate spots for assessing differential expression
in microarray experiments. Bioinformatics. 2005; 2: 2067–2075.
44. Silver JD, Ritchie ME, Smyth GK. Microarray back-ground correction: maximum likelihood estimation for