1
The London School of Economics and Political Science
Migration and Ethnic Diversity in the Soviet
and Post-Soviet Space
Youngook Jang
A thesis submitted to the Department of Economic History of the London School of
Economics and Political Science for the degree of Doctor of Philosophy
2
Declaration
I, Youngook Jang, certify that the thesis I have presented for examination for the MPhil/PhD degree of the London School of Economics and Political Science is solely my own work other than where I have clearly indicated that it is the work of others (in which case the extent of any work carried out jointly by me and any other person is clearly identified in it).
The copyright of this thesis rests with the author. Quotation from it is permitted, provided that full acknowledgement is made. This thesis may not be reproduced without my prior written consent. I warrant that this authorisation does not, to the best of my belief, infringe the rights of any third party.
3
Acknowledgement
I have been lucky to have many people helping me finish one of the hardest challenges in my life
– having Dr in front of my name.
My main supervisor, Professor Chris Minns, has always been there when I sought his wise advice, which guided me in the right direction during the whole process of writing a PhD thesis. The second supervisor, Professor Oliver Volckart, has also given me useful and eye-opening comments, many of which I would not have thought up for myself. I am indeed blessed that I have two supervisors who approached my thesis from different perspectives, which made me pursue not only quantitative rigour but also deeper implications hidden beyond numbers. I should add that this was exactly what I had expected when I began a PhD in the economic history department of the LSE. Also, I would like to thank all the wonderful faculty members and fellow PhD students in the department. Dr Eric Schneider, especially, has given me a chance to work as his research assistant for over two years, which helped me finance expensive life in London, not to mention that the tasks themselves were interesting and rewarding. Enrique and Greta have accompanied me from the very beginning of this journey and been good friends throughout. I also had many other good colleagues at the LSE, the list of whose names is too long to state here, and I have been benefitted from not only their comments and advice on my work, but also their attitude and achievements which motivated me in all five years I spent in the department.
4 I would like to express how grateful I am for my family who has been financially and mentally supporting me during the PhD years. It would not have been possible for me to complete the PhD thesis hadn’t it been for the prayers and support of my parents, sister, grandmother and parents-in-law. If I must choose only one person whose help was most important, however, I would choose my wife, Yeji. I am confident to say that this achievement is not mine but belongs to both of us, as Yeji did more than anyone can possibly do to support me. I am deeply grateful for everything she has done for me, especially after our son was born last year.
5
Abstract
This thesis examines the migration patterns shown in the Soviet Union and its successor countries during the late- and post-Soviet periods. I begin by constructing a comprehensive dataset regarding the net migration of major ethnic groups before and after the collapse of the Soviet Union, and then investigate how migration, ethnic diversity, and conflict at the end of the Soviet period affected one another.
The Soviet Union was a multi-ethnic state where members of its diverse ethnic groups showed distinctive migration patterns. However, the quantitative research from the ethnic viewpoint had been limited, mainly because there was no systemic data of the migration patterns of different ethnic groups. The first main chapter of my thesis (Chapter 2), therefore, attempts to construct a dataset of the regional net migration of major ethnic groups. It shows that many members of ethnic groups were dispersed outside of their national territories during the late-Soviet period (ethnic mixing), but the “return” of these groups to their national territories became evident after the dissolution (ethnic unmixing). Then, in the next chapter (Chapter 3), I proceed to quantitative analyses of the determinants of migration emphasising the role of ethnic factors. The results from OLS and Heckman selection estimations support the idea that ethnicity had a large influence on shaping the migration patterns in both the late- and post-Soviet periods, though the direction of influence was the opposite. Lastly, in Chapter 4, I examine whether this migration patterns contributed to changing ethnic diversity in the sending and receiving regions and then to ethnic conflict and violence in these regions, concluding that both were the case.
6
Table of Contents
ABSTRACT ... 5
TABLE OF CONTENTS ... 6
LIST OF TABLES ... 8
LIST OF FIGURES ... 10
CHAPTER 1. INTRODUCTION ... 11
HISTORICAL CONTEXT ... 18
PREVIOUS LITERATURE ... 28
SUMMARY OF THE MAIN FINDINGS ... 39
CHAPTER 2. MIGRATIONS OF ETHNIC MIXING AND UNMIXING – EVIDENCE FROM A NEW DATABASE ... 44
I. INTRODUCTION ... 44
II. SOURCES AND MEASUREMENT ISSUES ... 47
III. ESTIMATION STRATEGY ... 53
IV. RESULTS ... 61
V. CONCLUSION ... 80
CHAPTER 3. ETHNICITY AS A DETERMINANT OF MIGRATION: SOVIET AND POST-SOVIET CASE ... 82
I. INTRODUCTION ... 82
II. HYPOTHESIS... 86
III. DATA AND METHOD ... 90
IV. MAIN RESULTS FOR POST-SOVIET SAMPLE ... 95
A. FULL SAMPLE:OLS AND HECKMAN 2-STEP ESTIMATIONS ... 95
B. ROBUSTNESS CHECK ... 97
7
V. PRE-COLLAPSE MIGRATION PATTERNS ... 101
VI. DURATION OF STAY AND RETURN MIGRATION ... 106
VII. CONCLUSION ... 112
CHAPTER 4. DIVERSITY BACKLASH? MIGRATION, ETHNIC FRACTIONALIZATION AND VIOLENCE IN THE SOVIET UNION ... 114
I. INTRODUCTION ... 114
II. EFFECT OF REGIONAL NET MIGRATION ON ETHNIC DIVERSITY ... 118
A. THE TREND OF REGIONAL ETHNIC DIVERSITY ... 118
B. DIVERSITY CHANGE DUE TO NET MIGRATION ... 129
III. ETHNIC DIVERSITY AND VIOLENCE ... 137
A. PREVIOUS LITERATURE ... 137
B. DATA AND METHOD ... 138
C. RESULTS ... 141
D. ALTERNATIVE MODELS:SIZE OF VIOLENT INCIDENTS AND CIVIL WARS ... 147
IV. CONCLUSION ... 150
CHAPTER 5. LIMITATIONS AND AREAS FOR FURTHER RESEARCH ... 152
BIBLIOGRAPHY ... 156
APPENDIX 2.1 THE LIST OF SOVIET OBLASTS/KRAIS/ASSRS ... 165
8
List of Tables
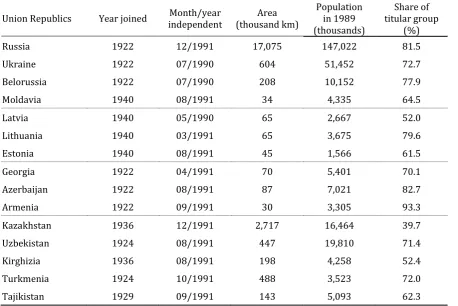
Table 1-1. List of union republics in the USSR ... 13
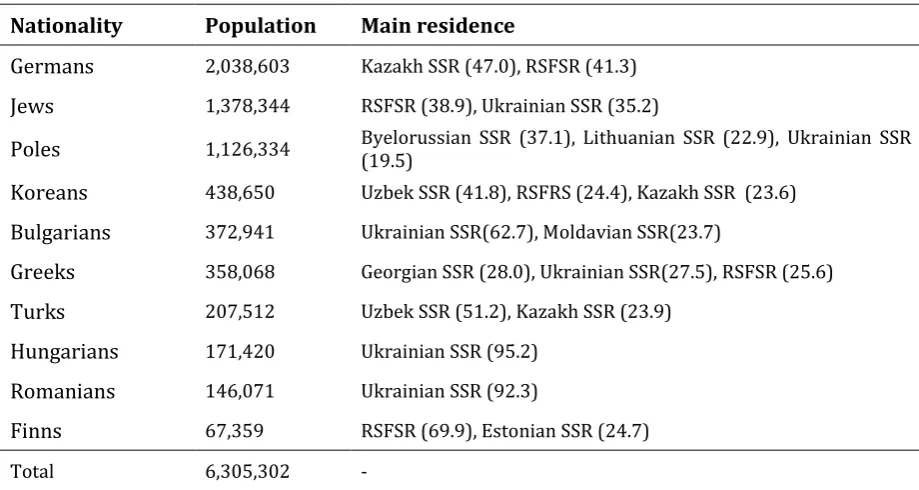
Table 1-2. The population of ethnic minorities with external homelands, 1989 ... 27
Table 2-1. The list of 2000 Round Censuses taken in the FSU states ... 48
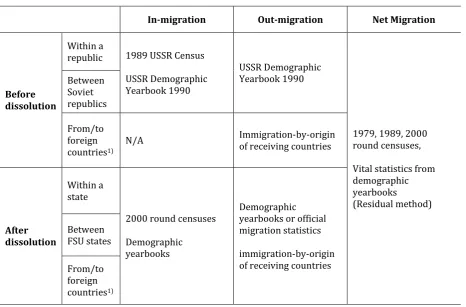
Table 2-2. Type of migration data and source ... 52
Table 2-3. Total fertility rates by ethnicity (Selected) ... 57
Table 2-4. Regression results for an average number of births per woman ... 59
Table 2-5. An example of estimates, Tatars in Volga raion ... 60
Table 2-6. Population change by ethnicity, 1979-89, major ethnic groups ... 62
Table 2-7. Net migration of the ethnic groups, Annual average and per 1000, 1979-89 ... 64
Table 2-8. Net migration of the ethnic groups, Annual average and per 1000, 1989-2000.. 71
Table 2-9. Net migration in the Soviet republic and FSU countries, 1981-2005 ... 78
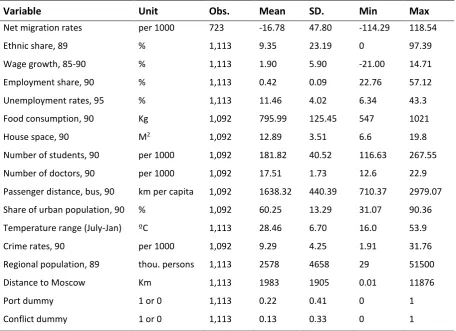
Table 3-1. Descriptive statistics, after collapse ... 94
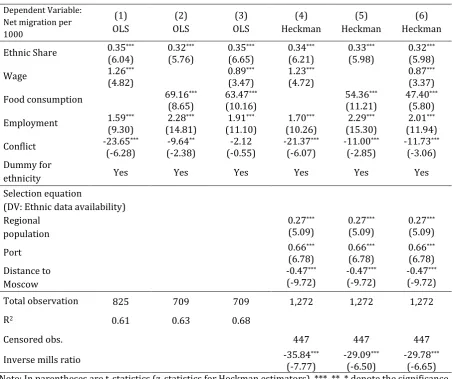
Table 3-2. OLS & Heckman 2-step estimation, after the collapse... 96
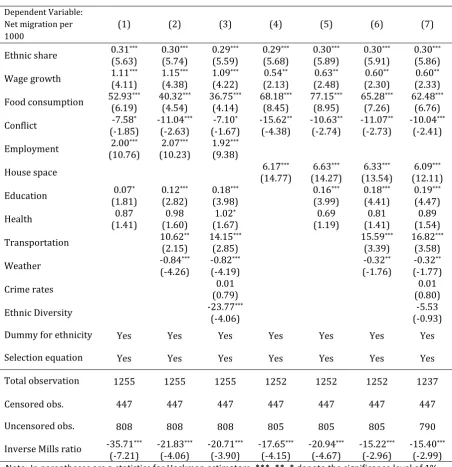
Table 3-3. Robustness check, Heckman 2-step estimation, after collapse ... 98
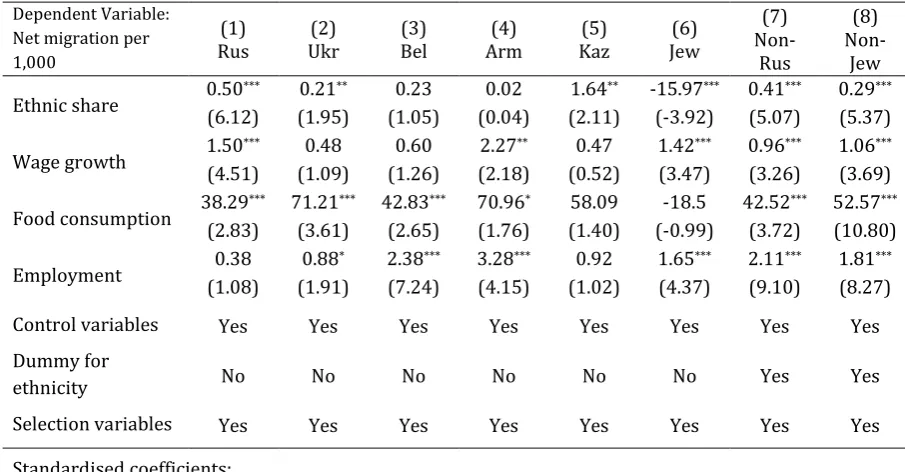
Table 3-4. Sensitivity variation by nationality, Heckman 2-step estimation ... 100
Table 3-5. OLS & Heckman 2-step estimation, before collapse ... 102
Table 3-6. Robustness check, Heckman 2-step estimation, before collapse ... 104
9
Table 3-8. Effect of the share of new immigrants, Heckman 2-step estimation ... 110
Table 4-1. Ethnic Fractionalisation Index from 1959 to 2000 ... 120
Table 4-2. Ethnic Fractionalisation Index from 1959 to 2000, excluding Russians ... 125
Table 4-3. Ethnic Polarisation Indices (POLAR) from 1959 to 2000 ... 126
Table 4-4. Ethnic Polarisation Index from 1959 to 2000, excluding Russians ... 128
Table 4-5. The sources of change in ethnic diversity, 1979-89 ... 130
Table 4-6. The sources of change in ethnic diversity, 1989-2000 ... 131
Table 4-7. The relationship between migration and diversity, 1979-89 ... 134
Table 4-8. Top 5% high violence oblast / ASSR, 1988-1992 ... 139
Table 4-9. Summary statistics ... 141
Table 4-10. The effect of ethnic diversity on violence, baseline model ... 142
Table 4-11. The effect of ethnic diversity on violence, controls added ... 145
Table 4-12. The effect of ethnic diversity on protest participants ... 148
10
List of Figures
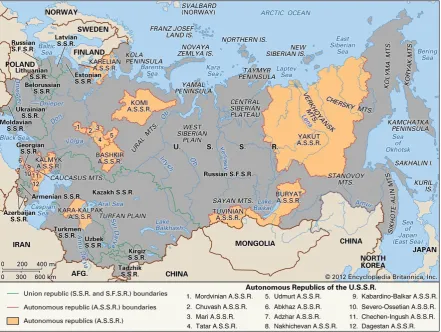
Figure 1-1. The map of the USSR, union republics and ASSRs... 12
Figure 2-1. Economic regions of USSR, 1962 ... 53
Figure 2-2. The Administrative divisions of USSR, 1974 ... 55
Figure 2-3. Fertility and urbanisation rates / sex ratios ... 58
Figure 2-4. Regional net migration rates of major ethnic groups, 1979-89 ... 65
Figure 2-5. Regional net migration rates of major ethnic groups, 1989-2000 ... 72
Figure 3-1. Duration of stay, Titular nationality ... 107
Figure 3-2. Duration of Stay, Selected Ethnic groups in Russian SFSR ... 108
Figure 4-1. Ethnic Fractionalisation Index at oblast level, 1989 ... 124
Figure 4-2. Correlation between ethnic fractionalisation and polarisation ... 127
Figure 4-3. FRAC change due to migration, before and after the collapse ... 132
11
Chapter 1. Introduction
In this thesis, I focus on the usefulness of the Soviet and post-Soviet history in exploring the relationship between migration and ethnicity. Quantitative analyses have been rare in the literature when it comes to the ethnic aspect of the Soviet and post-Soviet migration, mainly due to the limited data availability. The biggest contribution of this thesis is to construct a dataset as to the regional net migration of major ethnic groups (Chapter 2), enabling to investigate the effect of ethnic factors on the migration patterns in the late- and post-Soviet periods (Chapter 3). This dataset is also used to uncover the mechanism through which regional ethnic diversity was shaped, and to show that the increase in the diversity due to migration was important in explaining the ethnic conflicts which had occurred at the end of the Soviet era (Chapter 4). Before moving on to the main chapters of this thesis, it seems essential to present why the Soviet Union is relevant to the study of migration and ethnic diversity.
The USSR was home to over 100 ethnic groups, or nationalities1, who had been given complex status between autonomy and subjection. Notwithstanding the Marxist ideology of internationalism, Lenin and Stalin committed to national self-determination. Soviet authorities regarded the term “nationality (Natsional'nost', in Russian)” equivalent to ethnicity on which they based the establishment of territorial units2. The 15 largest ethnic groups were given autonomy over their own union republics and 20 groups over their ASSRs (See Figure 1-1 and Table 1-1). Many ethnic minorities (Poles, Germans, Jews, Koreans, etc.), as well as the above-mentioned “titular nationalities”, were provided with a certain extent of autonomy including mother-tongue education, national units in political parties, national quotas in colleges, and so on3. In addition to this ethno-territorialism, individual level nationhood was institutionalised by
1 I used the basic category of ethnic group as recorded by the Soviet official statistical agencies, regardless of
the status and size of each ethno-cultural entities. For more discussions on terminology, Tishkov, V. Ethnicity, nationalism and conflict in and after the Soviet Union: The mind aflame (Oslo, 1997). pp. viii - x
2Suny. G., ‘Nationalist and ethnic unrest in the Soviet Union’,World Policy Journal, vol. 6, no. 3 (1989), p. 506 3 Slezkine, Y., ‘The USSR as a communal apartment, or how a socialist state promoted ethnic
12 ethnic nationality’s being a fundamental unit of social accounting and a key element of one’s
legal status. In effect, nationality was not only identified in censuses and other social surveys but also recorded in almost all bureaucratic documents such as propiska4. Regarding the nationhood formation in the Soviet Union, Brubaker argues as follows:
It was thus through an irony of history … that nationality became and remained a basic institutional
building block of the avowedly internationalist, supranationalist, and anti-nationalist Soviet state,
with the land partitioned into a set of bounded national territories, the polity composed in part of a
set of formally sovereign national republics, and the citizenry divided into a set of legally codified
nationalities5.
4Propiska is a residency permit designed to control migration. Brubaker, R., ‘Nationhood and the national
question in the Soviet Union and post-Soviet Eurasia: An institutionalist account’,Theory and Society, vol. 23 no. 1 (1994), p.53
[image:12.595.75.517.353.685.2]5 Ibid., p.54
Figure 1-1. The map of the USSR, union republics and ASSRs
13 Table 1-1. List of union republics in the USSR
Union Republics Year joined independent Month/year (thousand km) Area Population in 1989 (thousands)
Share of titular group
(%)
Russia 1922 12/1991 17,075 147,022 81.5
Ukraine 1922 07/1990 604 51,452 72.7
Belorussia 1922 07/1990 208 10,152 77.9
Moldavia 1940 08/1991 34 4,335 64.5
Latvia 1940 05/1990 65 2,667 52.0
Lithuania 1940 03/1991 65 3,675 79.6
Estonia 1940 08/1991 45 1,566 61.5
Georgia 1922 04/1991 70 5,401 70.1
Azerbaijan 1922 08/1991 87 7,021 82.7
Armenia 1922 09/1991 30 3,305 93.3
Kazakhstan 1936 12/1991 2,717 16,464 39.7
Uzbekistan 1924 08/1991 447 19,810 71.4
Kirghizia 1936 08/1991 198 4,258 52.4
Turkmenia 1924 10/1991 488 3,523 72.0
Tajikistan 1929 09/1991 143 5,093 62.3
Source: Encyclopæ dia Britannica (retrieved from www.britannica.com/place/Soviet-Union), 1989 USSR
census
On the other hand, the Soviet Union had never deviated from the goal of ultimate merger (sliyanie) of all nationalities into one Soviet people6. While patriotic rituals and internationalist education were promoted to build a Soviet identity7, population redistribution policy was also implemented to neutralise national consciousness based on land8. The titular nationalities had not been confined to their own autonomous territories but kept being sent, or encouraged to move, towards less developed and less densely-populated regions under the slogan of balanced
regional development and “ethnic equalisation9”. The authorities first used coercion, especially
6 Huttenbach, H., ‘Introduction: Towards a Unitary Soviet State: Managing a multinational society, 1917-1985’,
in Huttenbach, H. (ed.) Soviet Nationality Policies: Ruling Ethnic Groups in the USSR (London ,1990), p.5
7 Collias, K., ‘Making Soviet citizens: Patriotic and internationalist education in the formation of a Soviet state
identity’, in Huttenbach, Soviet Nationality Policies, pp.75-77.
8 Schwartz, L. ‘Regional population redistribution and national homelands in the USSR’, in Huttenbach, Soviet Nationality Policies, p.149
9 Ethnic equalisation refers to the set of nationality policies which aim to promote the socioeconomic levels of
ethnic minorities. Jones, E. and F. Grupp, ‘Modernisation and Ethnic Equalisation in the USSR’,Soviet Studies
14 in the Stalinist era, but later tried to induce migration which they thought was desirable through incentivising mechanisms, such as offering higher wages and longer vacation to the workers settled in the northern and eastern part of Russia10.
At the verge of the historic regime shift in 1991, the seemingly contradictory nationality and migration policies of the Soviet Union had created a unique setting where many members of ethnic groups who preserved their national identities found themselves in the places which did not use to be their “home11”. The number of Soviet people living outside their titular national territory in 1989 was 73 million, among which 25 million were ethnic Russians, and 12 million were non-Russians in Russian SFSR12. Also, ethnic mixing did seem to occur as the average of union republic level ethnic fractionalisation indices (FRAC) went up from 0.37 in 1939 to 0.40 in 198913.
Then there occurred a sudden breakup. The dissolution of the Soviet Union brought dramatic changes to the status and thus the migration patterns of the members of its diverse ethnic groups. While the restrictions on migration were mostly lifted, non-indigenous people suddenly became diaspora in the lands where they had used to have no legal barrier to reside. They faced up to the nationalist policies of independent former Soviet Union (FSU) republics, as the demand for independence was translated into discriminative policies against non-titular ethnic groups during the state-building process in the 1990s14. These formed both a push factor driving the non-indigenous groups away from their living places and a pull factor attracting titular groups to their own national region. Naturally, those who were spread across the Soviet
10 Gibson, J., ‘Interregional migration in the USSR, 1981–1985 and 1971–1975’, The Canadian Geographer/Le Géographe canadien, vol. 35 no. 2 (1991), p. 147-8
11I will use the term “home” to refer to the national territory of a member of an ethnic group, even though he
or she had never lived there. Therefore, the term “return” (to their home) will be often used rather symbolic.
12Brubaker, ‘Nationhood (1994)’, p.57
13 Calculated by author using census data. FRAC indicates the probability that two randomly chosen persons
are in the different ethnic groups. The average of regional FRACs and the FRAC of the whole USSR should be different. See Section II, Chapter 4 for detail.
14 For example, most Central Asian FSU states explicitly discriminated Russian-speaking population in
15 territory began to return to their national homeland, resulting in ethnic unmixing15. The ethnic unmixing not only involved the return migration of titular ethnic groups to the independent union republics but also was prompted by the emigration of ethnic minorities to where their ancestors had come from, even if this was outside the Soviet Union (e.g. Jews to Israel, ethnic Germans to Germany)16.
Having mentioned the uniqueness of the late- and post-Soviet space, it was not the only place where different ethnic groups move and live together. According to the recent report of the United Nations, there are 258 million international migrant stock in 2017, accounting for 3.4 per cent of the total world population17. If one considers high-income countries only, the share of immigrants goes up to 13.2 per cent18. The case of high diversity caused by mass migration can also be found at the turn of the twentieth century, when around 55 million Europeans moved to the New World in less than 65 years19. The Soviet case is just one example of the people mixing with those from different ethnic and cultural background, though it was the result of internal rather than international migration, and was often initiated involuntarily.
The ethnic unmixing after the dissolution also resembles the backlash which has been observed cyclically at the end of the major waves of globalisation. The recent rise of the worldwide blood-and-soil type nationalism can be interpreted as an organisational resistance to the all-time high immigration and ethnic diversity levels20. Again, globalisation in the early twentieth century faced a similar policy backlash, represented in the US by Immigration Act in 1917 or Emergency Quota Act in 1921, both of which aimed to restrict the influx of
15 Ethnic unmixing is the process where migration decreases ethnic or national heterogeneity in the receiving
regions. Brubaker, R., ‘Migrations of ethnic unmixing in the "New Europe"’,International migration review vol. 32 no.4 (1998), p.1059
16 Heitman, S., ‘Soviet emigration since 1985’, Nationalities Papers vol. 22 no.1 (1994), pp. 247-261 17 UNDESA, Population Division, International Migration Report 2017 (ST/ESA/SER.A/404) (New York, 2017) 18 World Bank Data (retrieved from data.worldbank.org/indicator/SM.POP.TOTL.ZS?view=chart)
19 Hatton, Timothy J., and Jeffrey G. Williamson. The Age of Mass Migration: Causes and Economic Impact
(Oxford, 1998)
20 The Economist, 19 November 2016 (retrieved from
16 immigrants21. Nationalist policies are by nature discriminative against non-indigenous people and likely to prevent further immigration or drive out the present immigrants. This may result in ethnic unmixing, which was observed during the post-Soviet period.
Therefore, exploring the Soviet and post-Soviet migration and ethnic diversity not only enhances the understanding of the changes in demographics during the transition period but also has meaningful implications on the current discourse regarding the globalisation backlash. As I mentioned above, however, they had not been paid systemic attention yet despite its relevance. The biggest challenge is the absence of acceptable statistics or estimates of the size of migration at an ethnic level during the post-Soviet transition period. Granted, there have been some attempts to look into the migration of Soviet citizens during the transition period, which I will briefly summarise later in this introductory chapter. Many of them provide the migration trend, sometimes down to regional level statistics, using government publications or collecting partial and anecdotal evidence, but there are at least three important aspects that have been neglected in the previous works.
Firstly, there has been no consistent dataset constructed that spans both pre- and post-collapse periods. The available data is concentrated on the post-Soviet period, and existing late-Soviet studies have not extended their datasets to the post-late-Soviet period. As a result, it was hard to directly compare the different characteristics between pre- and post-collapse migration patterns and their determinants, which might shed light on how institutional changes shape migration movements. Secondly, the Soviet and post-Soviet migration literature tends to focus on Russia22. There has been less concern about non-Russian Republics or FSU states, especially when it comes to regional level study. Inter-republic migration, however, accounts for over 95% during the Soviet period and around 80% even after the independence of the republics23.
21 Williamson, J., ‘Globalization, labor markets and policy backlash in the past’,Journal of Economic Perspectives vol. 12 no. 4 (1998), p.63
22 More prominent publications tend to deal with Russia only. See Previous Literature section for details. 23 Rosstat, Demograficheskiy yezhegodnik Rossii: Statisticheskiy sbornik (Demographic Yearbook of Russia:
17 Therefore it is crucial to look at the migration of non-Russian states to have an accurate understanding of the whole picture. Lastly but perhaps most importantly, little attention has been paid to ethnic aspects of the migration movements. As mentioned above, many different ethnic groups had their residence in the USSR and each of these ethnic groups has shown distinctive migration patterns during the period of study. Therefore, it is also essential to see how the migration patterns are affected by ethnicity, and this thesis will be contributing particularly to this point.
The interesting migration phenomenon in the Soviet transition period, combined with the room for improvement in the previous literature, leads me to the questions about its causes and consequences. To answer these questions, I first construct a new dataset of the net migration of different ethnic groups in the Soviet regions24, then conduct a series of quantitative analyses as to the determinants of net migration and the effect of migration on ethnic diversity and violence in the regions. The results from the main analyses will be summarised at the end of this introductory chapter, after discussing the history of nationality and migration policies of the Soviet Union in more detail and reviewing the previous literature which quantitatively looks into the post-Soviet migration.
24 The regional level data provide net migration in the administrative divisions of oblasts/krays/ASSRs. For
18
Historical Context
Soviet Period
According to the 1989 USSR Census, the number of ethnic groups settling in the USSR was 128, among which 55 had populations of more than 100,000 and 22 had more than 1 million. The ethnic fractionalisation index of the USSR in 1989 was 0.71125, which is far higher than the US (0.491) and the world average (0.480)26. Presence of many ethnic groups and high ethnic diversity seem somewhat inconsistent with the characteristics of a socialist country which had pursued the supranational unitary Soviet state27. This is due to the Soviet authorities’ contradictory nationality policies as discussed in the very beginning of this chapter, which will be elaborated in the following paragraphs.
Right after the Bolshevik Revolution, there was political contestation between nationalists and internationalists over the right of nations to self-determination, while the support of the Congress leaned towards Lenin, one of the nation-builders28. Leninists believed that allowing for self-determination and cultural/linguistic freedom was an essential step to overcome the oppression under the old tsarist regime and move toward a true egalitarian socialist state29. In 1917, Lenin renounced the use of any form of force to keep the empire as a whole and was committed to supporting for the right of separation from Russia of all nations and nationalities who had been suppressed by tsarism30. This was also viewed as a compromise between Marxist ideal and the reality of weak state facing the nationalist and separatist movements. For example, Bolshevik leaders felt threatened by the big victory of Ukrainian
25 This figure goes down when regional concentration is considered. See Section II, Chapter 4, for details. 26 Fearon, J., ‘Ethnic and cultural diversity by country’,Journal of economic growth vol. 8 no. 2 (2003), pp. 212,
215
27Huttenbach, ‘A Unitary Soviet State’, p.4; There was no ethnic group classified as Soviets, unlike other
socialist states. For example, Yugoslavian census includes “Yugoslav” as an ethnic group besides Croatian,
Serbian and Slovenian. Wachtel, A., Making a nation, breaking a nation: Literature and cultural politics in Yugoslavia, (Stanford, 1998), pp.10-14
28 Martin, T., The affirmative action empire: nations and nationalism in the Soviet Union, 1923-1939. (New
York, 2001), pp.2-3; Slezkine, ‘Ethnic Particularism’, pp.421
29 Suny, R., The revenge of the past: Nationalism, revolution, and the collapse of the Soviet Union (Stanford,
1993), P.86
19 Socialist Revolutionaries over the Russian party in 1919 Constituent Assembly election of Ukraine31. Though Lenin had still hoped to reach the eventual merging of nations under Socialist ideology and preserve unitary Soviet state, the concessions to national principle eventually led to the consolidation of ethnicity, not its disappearance. Unlike the US, Ronald Suny argued, the Soviet Union was not a melting pot but an incubator of new nations32.
In the course of promoting self-determination of all nationalities, the policy of nativisation (Korenizatisiya in Russian) was adopted, which had four aspects, namely national territories, national language, national elites and national cultures33. The most conspicuous result derived from nativisation was the territorial delimitation based on ethnicity. As shown in Figure 1-1, 15 of over 100 different ethnic groups had their own union republics (e.g. Russian SFSR, Armenian SSR, Kazakh SSR, etc.) and 20 had their autonomous republics (Tatars ASSR, Yakut ASSR, etc.). There were also lower division autonomous territories such as autonomous oblasts and
autonomous okrugs. The union republics even had the right to secede which is backed by the Article 17 in the 1936 Constitution or Article 72 of the 1977 Constitution, though this right was just perfunctory as there was no detailed procedure of secession.
The titular groups were given a high degree of autonomy in their territory in terms of language education, appointment of high public officials, and preservation of national culture. For example, Latvian and Ukrainian governments adopted the law promoting equality of languages in courts and administration, and Belorussia used four different languages in its signs, local governments and schools34. The share of natives in political party membership was very high, even when their share in the population is low. For example, when Georgians accounted for 25% of the population of Tiflis, the capital of Georgia, 43% of the city soviet, 75% of the city executive committee, 91% of the praesidium of the executive committee were Georgians35. Also,
31Ibid., pp. 90 32 ibid., p. 87
20 native operas, film studios, academies of science, etc. were also preserved and fostered by those national elites36. Regarding this, Tishkov argued as follows:
…it is precisely the Bolsheviks who constructed, institutionalized and sponsored ethnic nations in
the country. It is also because of them that all major non-Russian ethnic groups used to have and
possess today a growing level of ethno-territorial autonomy with their own constitutions, state
symbols, languages, legitimate governments and strong representation in federal power
structures37.
However, it would be incorrect to say that the Soviet leaders wanted to preserve all the national identities to the point that the “Soviet” identity is entirely abandoned. After all, the nativisation was only regarded as the key stage on the way to the ultimate Marxist and internationalist utopia. The ‘oppressed nations’, who were given the right to autonomy, were also bound to struggle for the international integration of all workers38. A central theme in the early-Soviet nationality question was dialectic: thesis - flowering of nation (rastsvet), antithesis -drawing together (sblizheniye), synthesis - ultimate merger (sliyanie) into one Soviet people39. In order to achieve the final goal of Sovietisation, the authorities have adopted nationality policies at various stages, namely ethnocide/expulsion, assimilation, and resettlement40.
The actions of ethnocide and expulsion41 had been widely taken in the 1930s and 40s under the Stalinist regime. Victimised nationalities include Ukrainians, Kazakhs, Crimean Tatars, Kalmyks, Karachays, Circassians, Chinese, Koreans and Japanese42. This mass killing of ethnic minorities often occurred as a part of the forced removal of undesired nations under the
36 Ibid., p.105
37 Tishkov, V., ‘Forget the nation: post-nationalist understanding of nationalism’,Ethnic and Racial Studies vol.
23 no. 4 (2000), p.634
38 Kaiser, Geography of Nationalism, p.147 39 Ibid., p.147
40 Allworth, Edward. "A Theory of Soviet Nationality Policies." In Huttenbach, Soviet Nationality Policies
(London, 1990), pp.36-7.
41 Expulsion, or deportation, originally means forced emigration or obligatory repatriation. However, in the
Soviet period, it often describes forced migration from one’s settlement to other part of the Soviet Union,
e.g. to Central Asia or Siberia. Therefore, the definitions of expulsion and resettlement overlap to some extent.
21
programme called ‘Operation Deportation’43. Taking the example of Crimean Tatars, over 190,000 were targeted to be deported from the Crimean ASSR to Central Asia and Siberia in 1944. NKVD (the progenitor of the KGB) troops came to operate the deportation and summarily shot, on the spot, thousands Crimean Tatars, who were deemed guilty of collaboration with the Germans when the Nazis occupied Crimea during the Second World War44. 7,900 Crimean Tatars, around 4% of their population, were killed during this deportation process45. The similar tragedy had hit other distrusted nations in the closing days of the Second World War.
A less extreme, yet still destructive, form of nationality policy was assimilation. The first aspect of assimilation is linguistic Russification. Despite native languages being promoted under the slogan of nativisation, instruction in Russian was also compulsory, and essential as a means of upward mobility46. In March 1938, Central Committee of the Communist party passed a resolution, “On the obligatory study of Russian language in the schools of the national republics and oblasts”, which required secondary students to be fluent in Russian grammar and syntax47. Linguistic integration was promoted effectively, as it is observed in the Soviet censuses that the number of people who claim that their first language is Russian kept rising in non-Russian union republics and ASSRs48.
In addition to linguistic Russification, patriotic and internationalist education (patrioticheskoe i internatsional’noe vospitanie) was presented to build a supranational Soviet identity49. Mandatory patriotic education was provided to young citizens in a variety of forms, such as in-school learning, union-wide excursion to historic places, interethnic sports competitions, or ceremonial rituals, through various institutional structures, including the
43 Williams, B., ‘Hidden ethnocide in the Soviet Muslim borderlands: the ethnic cleansing of the Crimean
Tatars’,Journal of Genocide Research vol. 4 no. 3 (2002) p. 358
44 Ibid., p.370 45 Ibid., p.360
46 Kaiser, Geography of Nationalism, p.139 47 Ibid., p.139
48 Ibid., 266-7
22 Soviet Armed Forces, Communist Youth League (Komsomol), or Soviet schools50. This education includes the regular participation in the rites and rituals commemorating heroes who fought in the Second World War. These heroes are not necessarily Russian, and multi-ethnic heroes often symbolise the interethnic cooperation in the course of reaching the framework of the Soviet socialist ideal51. These rituals are thought to serve the integration policy of the state and to overcome interethnic conflicts52.
Finally, the Soviet authorities implemented population redistribution policies, which are classified as resettlement earlier, to achieve the ultimate merger of its various ethnic groups. Expulsion, not accompanying genocide, has an aspect of resettlement to mix nationalities who were accused of threatening Soviet power. Internal deportation counts up to 5.9 million between 1919 and 195353. This includes around 1.8 million rich kulaks but also targeted ten ethnic groups such as Koreans, Volga Germans, Chechens, and Meskhetian Turks54.
Internal migration, even after the Stalin’s death, remained as a tool to ration people to the
places following the authority’s policy objectives55. The Soviet leaders had attempted to transplant its population in less favourable regions under slogans of ethnic mixture and balanced regional development56. Throughout the Soviet era since 1932, the regime required citizens to register at the local branch of Ministry of Interior’s Registration Office and have the
proof of permanent residence on their passport (propiska in Russian)57. The authorities limited the number of residence permits each area or city, and distributed university graduates to other regions and industries. The workers could choose to stay there or leave after some fixed-term
50 Ibid., p.75 51 Ibid., p.80
52Sadomskaya, N., ‘New Soviet Rituals and National Integration’, In Huttenbach, Soviet Nationalities Policies
(London, 1990), p.97
53 Polian, P., Against Their Wil : The History and Geography of Forced Migrations in the USSR (Budapest, 2004),
p.312-3
54 Light, M., ‘What Does It Mean to Control Migration? Soviet Mobility Policies in Comparative Perspective’, Law & Social Inquiry vol. 37 no. 2 (2012), p.407
55 Buckley, C., ‘The Myth of Managed Migration: Migration Control and Market in the Soviet Period’,Slavic Review vol.54 no. 4 (1995), pp.896-916
56 Dmitrieva, O., Regional development: The USSR and after (London, 1996), p.22
23 contract. The evidence suggests that Soviet leaders perceived the role of economic factors in incentivising labour movement and attempted to redistribute its population into less developed regions using wages and other forms of monetary and non-monetary compensation58.
There were special northern and eastern benefits such as higher pension and longer vacations. Oil refining and natural gas processing industries in Western Siberia, for example, attracted people from the European part of the USSR59. Large railway projects, development of iron ore and coal mines, construction of ports in the Far East also attracted migrants. Those who are from ethnic peripheries in Transcaucasia and Central Asia were most responsive to the economic benefits of moving to Siberia and the Far East. As the goal of Soviet leadership in
implementing nationality policy includes “ethnic equalisation”, which aims to reduce the gap in living standards among different ethnic groups60, it was natural that the less affluent members of titular groups in Southern republics and non-titular ethnic minorities were encouraged to migrate to the regions described above. This resulted in ethnic unmixing in the 1970s and 80s, when the new industries in Siberian and Far Eastern regions were being established.
To sum up, the contradictory nationality and migration policies of the Soviet Union, aiming both the preservation of nationalities and promotion of unitary state, result in a large number of people who kept their national identity being dispersed from their perceived national homeland. The status of these people changed dramatically when the Soviet Union collapsed.
Post-Soviet Transition Period
The dissolution of the USSR created 15 newly independent states at the end of 1991. While the break-up of this 74-year-old socialist empire was relatively peaceful61, the late 80s
58 Buckley, C. et al., Migration, Homeland, and Belonging in Eurasia (Chicago, 2008), p.7 59 Gibson, ‘Interregional migration’, pp.147-8
60Jones and Grupp, ‘Modernisation’, p.159
61 There was no major war between Russia and other FSU union republics, though some ethnic groups, e.g.
24 and early 90s saw massive nationalist and secessionist demonstrations demanding the independence of their national republics62. Since these nationalist movements were essentially enabling national elites to gain political and economic power after the independence, the closed system of privileges favouring titular ethnic groups was created63. The exclusive rights of titular nations were given priority while the rights of individuals or other population groups were disregarded64.
The extent to which each of FSU states strengthened the power of its own titular group differed. Korobkov (2003) classified the non-Russian FSU states into three groups, according to their attitudes toward nationalist elites and non-titular ethnic groups65. The first group is Russia, Ukraine and Belarus, which provided full citizenship to all the persons who had resided within their borders for a certain period and did not distinguish their residents by ethnicity in formal policies. Second group is Lithuania, Moldova, Kazakhstan and Kyrgyzstan, where ethnic orientation was emphasised, and titular national groups were favoured. Although citizenship rights were also given to all permanent residents in these states, some policies favouring the titular groups were adopted. For example, Kazakhstan passed a law requiring all who pursed
government employment to be proficient in Kazakh, and Lithuania treated “traditional
Lithuanian churches and religious organisations” specially66. Third group is Estonia, Lativia and other states in Transcaucasia and Central Asia, which implemented discriminatory policy toward minorities explicitly. Non-titular groups were not granted citizenship rights automatically, and restrictions were imposed on political and economic activities of non-titular
groups. For example, in Estonia, the constitution claims that certain “categories property in
Estonia… are reserved for ownership by Estonian citizens”, when only 80.1 percent of the whole
62 Beissinger, M., Nationalist Mobilization and the Collapse of the Soviet State, (Cambridge, 2002)
63 Korobkov, A., and Zaionchkovskaia. Z., ‘The Changes in the Migration Patterns in the Post-Soviet States: The
First Decade’,Communist and Post-Communist Studies vol. 37 no. 4 (2004), p.490
64 Ibid., p.492
25 population of Estonia held citizenship67.
The changing status of non-indigenous groups, who spread across the independent FSU states, brought about changes in migration patterns as well. The post-Soviet migration of the members of FSU ethnic groups is usually divided into two broad categories in the literature: first, the (return) migration of the titular nationalities to their national territories, including return of ethnic Russians to Russia, and second, the emigration of ethnic minorities who had their national states outside the USSR/FSU, notably Jews and Germans.
Most notable is the return migration of ethnic Russians to Russian Federation amongst the post-Soviet inter-republic movements. The number of ethnic Russians in non-Russian states reached 25.3 million in 1989 census68. The extent of the return migration of ethnic Russians who had suddenly become diaspora was large, even though it was not as extensive as some contemporary commentators had anticipated69. According to Timothy Heleniak, Russia added 3.3 million to its population through migration from other Soviet successor states in the decade after 1989, with 2.9 million (88.4%) among them being ethnic Russians70. Furthermore, it is shown that net migration of ethnic Russians in the non-Russian FSU states was negative, i.e. out-migration exceeds in-out-migration, without a single exception71.
Ethnic Russians were not the only titular nationality that migrated to its national republic. All countries except Estonia and Georgia showed the positive net migration of their titular nationalities. Return migration was most active in the Slavic states, e.g. Ukraine and Belarus, and some Central Asian countries, e.g. Kazakhstan and Uzbekistan, until 199972.
67 Less than 40% of non-Estonians had citizenship while almost all Estonians are citizens. Ibid., ‘State and
nation building policies’, p.24
68 Korobkov and Zaionchkovskaia, ‘Changes in the migration patterns’, p.490
69 For example, US Congress during its special hearing in 1996 estimated that the number of potential return
migrants was 25 million, and Russian governmental source gave similar forecast; 20-24 million. Ibid., p.482
70 Heleniak, T., ‘The end of an empire: Migration and the changing nationality composition of the Soviet
successor states’, in Munz, R. and Ohliger, R. (ed.), Diasporas and ethnic migrants. Germany, Israel and Post-Soviet successor states in comparative perspective (Portland, 2003), p.138
26 The emigration of Soviet ethnic minorities out of the FSU states consists of an important stream of late- and post-Soviet migration patterns. It began a little before the dissolution of the USSR, with the partly liberalised emigration policy under the auspice of Gorbachev administration. The main recipients of these Soviet emigrants were the countries where their ancestors come from, namely Israel and Germany, which often provided them with citizenship rights. The US had also been the main receiving country before it imposed immigration quotas against the Soviet Union in 199073. In total, there was a potential emigrant pool of over 6 million, as big as the size of ethnic minorities who had external homelands, as shown in Table 1-2.
The emigration of these ethnic groups was greatly influenced by the policy of the authority in the Soviet era. Exit visas were granted to the applicants only when the Soviet
leadership’s interest in demonstrating its respect for human rights and international laws was
strong, as was in the 1970s74. For example, the number of annual visas granted to Jews averaged 24,669 in the 70s, before dropping to 3,507 in 1981-8775. After emigration was liberalised, the efforts of destination governments to attract or deter an influx of immigrants played a significant role in shaping migration trends.
73 Tolts, M., ‘Post-Soviet Aliyah and Jewish Demographic Transformation’. the 15th World Congress of Jewish Studies (2009), p.4
74 Siegel, D., The great immigration: Russian Jews in Israel. (Providence, 1998), p.4
27 Table 1-2. The population of ethnic minorities with external homelands, 1989
Nationality Population Main residence
Germans 2,038,603 Kazakh SSR (47.0), RSFSR (41.3)
Jews 1,378,344 RSFSR (38.9), Ukrainian SSR (35.2)
Poles 1,126,334 Byelorussian SSR (37.1), Lithuanian SSR (22.9), Ukrainian SSR (19.5)
Koreans 438,650 Uzbek SSR (41.8), RSFRS (24.4), Kazakh SSR (23.6)
Bulgarians 372,941 Ukrainian SSR(62.7), Moldavian SSR(23.7)
Greeks 358,068 Georgian SSR (28.0), Ukrainian SSR(27.5), RSFSR (25.6)
Turks 207,512 Uzbek SSR (51.2), Kazakh SSR (23.9)
Hungarians 171,420 Ukrainian SSR (95.2)
Romanians 146,071 Ukrainian SSR (92.3)
Finns 67,359 RSFSR (69.9), Estonian SSR (24.7)
Total 6,305,302 -
Note: In parenthesis is the distribution of the ethnic group in Soviet republics. (i.e. 𝑃𝑜𝑝𝑢𝑙𝑎𝑡𝑖𝑜𝑛 𝑖𝑛 𝑎 𝑟𝑒𝑝𝑢𝑏𝑙𝑖𝑐
𝑇𝑜𝑡𝑎𝑙 𝑝𝑜𝑝𝑢𝑙𝑎𝑡𝑖𝑜𝑛 𝑖𝑛 𝑈𝑆𝑆𝑅).
Source: 1989 Soviet Census
In sum, the members of ethnic groups who were residing outside of their national republics tended to go back to their internal or external home states after the dissolution. The focus of this thesis will be on the determinants of this “return” migration, examining whether
28
Previous literature
In this section, I will review the previous literature to which this thesis contributes. There are three different streams of such literature, seeking to find 1) overall trend of post-Soviet migration, 2) determinants of migration, and 3) the relationship between ethnic diversity and conflict.
Overall Trend of Post-Soviet Migration
Many scholars have attempted to analyse the overall trend of post-Soviet migration patterns. Research in the early 1990s provided preliminary data on the size of ethnic migrations and their causes, as well as expectations of future trends.
The main source of data on ethnic composition of the Soviet population is all-nation census which was conducted roughly once a decade since the foundation of the USSR. Due to the presence of the all-nation census in 1979 and 1989, the years around the intercensal period became the focal point of the demography and migration literature. Anderson and Silver (1989) give an overview of the change in ethnic composition and the effect of migration on that phenomenon76. They calculated net migration as the difference between total population growth and natural increase77 and pointed out that the inter-republic migration had a large influence on the change in ethnic composition78. One of the major drivers of the internal relocation of the Soviet population was the returning migrants fleeing from ethnic conflicts79.
Brubaker (1992) is another author who has focused on inter-republic movements, with an interest in the relationship between titular and non-titular nationalities80. After overviewing the out-migration patterns in the transition period, he pays particular attention to the
76 Anderson, B., and B. Silver, ‘Demographic sources of the changing ethnic composition of the Soviet Union’, Population and Development Review vol. 15 no. 4 (1989), pp. 609-656
77 They made various assumptions to estimate vital statistics of ethnic groups, since there is little information
on them. Ibid., pp.636-637
78 Ibid., p.614
79 For example, Nagorno-Karabakh war (1988-94) triggered the migration of Armenians to Armenia and
Azerbaijanis to Azerbaijan.
80 Brubaker, R., ’Citizenship struggles in Soviet successor states’,International Migration Review vol. 26 no. 2
29 citizenship issue among immigrants from one FSU state to another. Taking Russian immigrants in Baltic countries as an example, he concludes that the citizenship would not be granted automatically to the FSU migrants81. His conclusion regarding Russian diaspora in non-Russian states and their citizenship struggles would turn out to be one facet of “ethnic unmixing” in his
later work in 1998. Contrary to the common belief that migration is often connected to
“heterogenization” of society, the case in post-Soviet migrations was an example of movement towards ethnic affinity, involving many ethnic migrants going back to their internal or external home states82. The politics around the citizenship grants formed a push factor of Russian emigration from other successor countries.
Robertson (1996) reviews qualitative evidence but also provides specific figures proving the hypothesis of ethnic migration to the home states in the early 1990s83. All 14 non-Russian titular nationalities are recorded to have positive net migration from Russia to their respective newly independent home states in 1991, and ethnic Russians who had lived there left for Russia84. In 1992, the same trend continued in most FSU states except the war-torn regions of Transcaucasia (Georgia, Armenia and Azerbaijan) and Estonia85. He reached the similar conclusion to previous works, that the preferential policies toward the majority, i.e. titular nationalities, not only drove out minorities but also attracted co-ethnics from other states86.
Some of these earlier works have a specific concern about the Post-soviet emigration of peoples to foreign countries other than ex-republics. Heitman (1991)87 and Shevtsova (1992)88 are among the most frequently cited articles providing emigration statistics in the transition period and, more interestingly, predictions of the future trend. Germans, Jews and Armenians
81 Ibid., p.286
82Brubaker, ‘Migrations of ethnic unmixing (1998)’, p.1047
83 Robertson, L., ‘The ethnic composition of migration in the former Soviet Union’. Post-Soviet Geography and
Economy vol. 37 no. 2 (1996), pp.113-128
84 Ibid., p.119 85 Ibid., p.119 86 Ibid., p.126
87 Heitman, S., ’Soviet emigration in 1990: A new “fourth wave"?’Innovation: The European Journal of Social Science Research, vol. 4 no. 3-4 (1991), pp.373-389
88 Shevtsova, L., ’Post Soviet emigration today and tomorrow’,International Migration Review vol. 26 no. 2
30 were the three most active nationalities moving out of the FSU to the West, whose number of emigrants drastically increased after 1987 when the government began to expand the number of exit visa grants. Heitman further points out that potential ethnic migrants among Poles, Bulgarians, Koreans and Turks, who would in the future consist of a fourth wave of emigration89. Shevtosova, who was more careful in reviewing evidence both for and against the prediction of massive emigration, seems to agree with the possible increase in the number of emigrants for several years90. She, however, also predicted the decline of the trend in the near future quoting Russians’ willingness to return to the country once the political situation had stabilised91.
The actual scope of emigration was much smaller than many contemporaries expected. While Shevtsova predicted 1 - 1.5 million annual emigrants from Russian Federation in the mid-1990s, which she thought very conservative by herself, the actual annual outflows to foreign countries was always below 500,000 after 1993, even including the number of emigrants to FSU states – outflows to other foreign countries were only 100,000 on average during the entire 1990s92. Amongst the many possible deterrents to the occurrence of the mass migration out of the FSU states, limits on visa for the former Soviet citizens in receiving countries (US or Germany) and less rosy prospects of host economies (e.g. Israel) might have been most significant93.
Recent studies look at the phenomenon with a more complete set of statistics. The most intensive and detailed research was done by Timothy Heleniak (1997a, b, 2003, 2008, 2012). His studies are noteworthy in that they tried to estimate the magnitude of ethnic movements, though these were limited to the country level. There is also a group of research which attempts to review the overall trend of post-Soviet migration, including Azrael and Payin (1996), Korobkov and Zaionchkovskaia (2004), Tishkov et al. (2005), Mansoor and Quillin (2006), and
89 Ibid., p.387
90Shevtsoba, ‘Post Soviet emigration’, p. 241 91 Ibid.,p.244
92 Rosstat, Demographic Yearbooks (various years). It is noteworthy that the administrative figures can be
subject to underestimation of actual flows of migrant. See Section II, Chapter 2 for detail.
31 two edited books, Munz and Ohliger (2003) and Buckley and Rubles (2008)94.
The above-mentioned authors used various sources to measure the migration flows in the transition period, but there are three major drawbacks. Firstly, the dataset constructed did not span both pre- and post-collapse periods. The data is mostly concentrated on the post-Soviet period, and late-Soviet studies did not extend their dataset to the post-Soviet period. As a result, it was hard to compare the different characteristics between pre- and post-collapse migration patterns and their determinants. Secondly, the Soviet and post-Soviet migration literature tends to focus on Russia. There has been less concern about non-Russian Republics or FSU states, especially when it comes to regional level study. Inter-republic migration accounts for over 95% during the Soviet period and around 80% even after the independence of the republics95. Therefore it is crucial to look at the migration of non-Russian states to have an accurate understanding of the whole picture. Lastly, little attention has been paid to ethnic aspects of the migration movements. As mentioned above, many different ethnic groups had their residence in the USSR and each of these ethnic groups has shown distinctive migration patterns during the period of concern. Therefore, it is also essential to see how ethnicity and migration are interrelated, and this thesis will be contributing particularly to this point.
The Determinants of Migration
The determinants of migration decisions and destination choice are an important subject in the migration literature. Economic differentials between sending and receiving regions are often seen as the most important factor driving people to move. Potential migrants will decide to move when the destinations can offer better economic opportunities, notably higher wages, higher chance of employment, and cheaper living costs etc., than where they currently live. The importance of economic factor in determining migration patterns does not seem to need further
94 Their findings are summarised in the previous section.
95 Rosstat, Demograficheskiy yezhegodnik Rossii: Statisticheskiy sbornik (Demographic Yearbook of Russia:
32 explanation. The expected lifetime income in the potential destination has been emphasised from the studies as early as Ravenstein (1885)96 to the most recent migration literature, as surveyed in Constant and Zimmerman (2013)97. The effect of income differential on migration has been intensively tested for many regions and periods (UK: Hatton 1995, Hatton and Williamson 2005; US: Borjas 1987, Clark et al. 2007; OECD; Mayda 2010, Belot and Hatton 2012, Ortega and Peri 2013 and many others).
Apparently, however, money is not the only matter of concern for the migrants. Previous migrant stock also plays a significant role in determining migration decision. The migrant network not only provides information about the destination and reduces the opportunity cost of migration, but also contributes to the improvement of immigrant outcomes in the host country. In addition, some authors have started to pay attention to the impact of ethnic affinity on migrants’ motivation and assimilation as a specific case of the network effects. In terms of explaining migration, it is argued that individuals have an incentive to live in the region or country where their co-ethnics are present, and governments can also benefit from ethnic homogeneity.
The view that identity is one of the main determinants of labour market performance and earnings has become increasingly popular among economists since the 2000s98. The seminal works of Akerlof and Kranton (2000, 2005) define identity as a person’s sense of self,
which is affected by gender, race, ethnicity, culture, religion, or any group/organisation one belongs to, etc.99 They argue that a rational individual would seek to achieve their ideal self and may sacrifice monetary compensation for the sake of enhancing the sense of identity. The impact of ethnicity, which is an aspect of one’s identity, should be better observed among
96 Ravenstein, E., ‘The laws of migration’,Journal of the Statistical Society of London vol. 48 no. 2 (1885),
pp.167-235.
97 Constant, A., and Zimmermann, K., International handbook on the economics of migration (Cheltenham,
2013)
98 Ibid., p.17
99Akerlof, G., and Kranton, R., ‘Economics and identity’, Quarterly Journal of Economics vol.115 no.3 (2000),
33 immigrants, as ethnic identity usually comes up to the surface when a person migrates to a society dominated by other ethnic groups. Therefore, migration decisions and destination choice can be dependent on ethnicity regardless of its impact on earnings.
Furthermore, earnings themselves can be affected by identity. Many scholars have concluded that the ethnicity of immigrants and labour market outcomes in the destination are closely related (Constant and Zimmermann 2008, 2013, Bisin et al. 2011, Hatton and Leigh 2011, Patacchini and Zenou 2012). For instance, Bisin et al. (2011), studying the impact of ethnic identity on labour market outcomes of non-EU migrants in Europe, argue that there is clear evidence of the disadvantage of being an ethnic minority in terms of wage assimilation100. Hatton and Leigh (2011) also emphasise the role of ethnic communities in improving the new co-ethnic immigrants’ earnings101. Patacchini and Zenou (2012) find the evidence in the UK labour market that the residential proximity to the same ethnic group enhances the probability of successful job-seeking of an individual102. All these studies support the idea that the ethnic identity is one of the most important factors affecting migrants’ economic performance and therefore will affect the decision making and destination selection process of potential migrants in the first place.
There is a handful of research which supports the direct role of ethnicity in the migration decision. Most of them have reached this conclusion analysing the internal migration of US ethnic minorities (Kritz and Nogle 1994, Gurak and Kritz 2000, Frey and Liaw 2005, etc.). Kritz and Nogle maintain that the larger the number of compatriots residing in a region, the less likely is out-migration to occur due to social capital in the immigrant community103. Similarly, Frey and Liaw (2005) suggest the reasons for ethnic sorting, such as kinship ties, social support
100 Bisin, A et al., ‘Ethnic identity and labour market outcomes of immigrants in Europe’,Economic Policy vol.
26 no. 65 (2011), pp.57-92.
101 Hatton, T., and Leigh, A., ‘Immigrants assimilate as communities, not just as individuals’,Journal of Population Economics vol. 24 no. 2 (2011), pp.389-419
102 Patacchini, E., and Zenou, Y. ‘Ethnic networks and employment outcomes’,Regional Science and Urban Economics vol. 42 no. 6 (2012), pp.938-949.
34 network, and access to informal employment opportunities104. They also find that the internal migration of Hispanics, Asians, and African Americans is affected by the concentration of each ethnic group in a state, retaining potential out-migrants and attracting new migrants105.
As to the post-Soviet context, the literature gives some qualitative evaluation on the motivations of interstate migration in the post-Soviet space. Korobkov and Zaionchkovskaia (2004) attribute ethnic relocation in the earlier period to political and ethnic factors, such as the attempts of FSU state leaders to form nation-states on the basis of ethnic definitions of nationality, policies favouring titular nationalities over ethnic minorities, the loss of status and privileges by the Russian-speaking elites and increasing cultural and linguistic differentiation among ethnic groups106. Pilkington (1998) also agrees that interethnic relationship and discrimination against Russian were the main reasons for migration of ethnic Russians from other FSU states, after interviewing 83 such migrants107. However, the migration since the late 1990s is argued to have become more and more affected by socioeconomic drivers, with the continuing role of Russia as a magnet for migration due to the increasing gap between Russian and other FSU economies108. Heleniak gave a similar explanation on the causes of post-Soviet migration, mainly attributing it to economic disparities among the FSU states and the role of government109.
There also has been some quantitative research about the reasons of inter-regional migration in Russian Federation, namely Brown (1997), Andrienko and Guriev (2004), Gerber (2006), and Guriev and Vakulenko (2015). These, however, did not deal with the ethnic aspect except that some of them have ethnic fractionalisation as one of the control variables. Brown
104 Frey, W., and Liaw, K., ‘Migration within the United States: Role of Race-Ethnicity’,Brookings-Wharton papers on urban affairs (2005), p.208
105 While their main specification reports positive and significant coefficients of concentration of ethnicity
variables, they also argue that its explanatory power may decrease depending on the immigrants’ education and skill level, i.e. the more the immigrants are educated, the more they want to assimilate into the native society. Ibid., p.245
106 Korobkov and Zaionchkovskaia, ‘Changes in Migration’, p.482
107 Pilkington, H., Migration, displacement, and identity in post-Soviet Russia (London, 1998), p.128 108 Korobkov and Zaionchkovskaia, ‘Changes in Migration’, p.488
35 (1997) and other authors examining the earlier period of transition did not find the decisive effects of labour market conditions on migration movements between regions110. Andrienko and Guriev (2004) find the results expected by neo-classical migration theory, by using enhanced region-to-region flow data from 1992 to 1999 and direct measures of economic opportunity for the first time in the literature. Gerber (2006)111 and Guriev and Vakulenko (2015)112 drew a similar conclusion with different method and datasets, and the latter reveals interesting findings on the non-monotonic relationship between income and migration. That is, the higher income in sending country positively influences emigration flows only when they are poor, because of the existence of liquidity constraint. They include in their specification a structural break to find the non-monotonic relationship around an income threshold.
These articles do not deal with the ethnic aspect of post-Soviet migration and tend to focus on Russia only. The quantitative research which attempts to deal with the ethnic factor in the inter-FSU state migration is rare, and to my knowledge, there is just one paper as such: Locher (2002)113. She used Heleniak’s dataset on net migration of ethnic groups between 1989 and 1999 to filter out their main determinants. She tried to examine the relative contributions of economic factors and ethnic sorting to 80 migration movements between 1989 and 99. Locher found the evidence of the significant influence of both ethnic sorting and economic factors on emigration and immigration of ethnic groups, resulting from Heckman full-information maximum likelihood estimation with explanatory variables of the size of ethnic groups, GDP per capita, EBRD transition indicators114, institutional quality, and so on.
110 Brown, A., ‘The economic determinants of internal migration flows in Russia during transition’, William Davidson Institute Working Papers Series, no. 89 (1997)
111 Gerber, T., ‘Regional Economic Performance and Net Migration Rates in Russia, 1993–2002’. International Migration Review vol. 40 no. 3 (2006), pp.661-697
112 Guriev, S., and Vakulenko,