A RANDOMISED CONTROLLED TRIAL OF AN ENERGY EFFICIENCY INTERVENTION FOR FAMILIES LIVING IN FUEL POVERTY
Heyman B., Harrington B., Heyman A. and The National Energy Action Research Group (2011) A randomised controlled trial of an energy efficiency intervention for families living in fuel poverty. Housing Studies, 26, 117-132.
ABSTRACT
2
KEY WORDS
Fuel poverty
Randomised controlled trial
Fuel efficiency intervention
Health impact
SAP
3
INTRODUCTION
This paper discusses the outcomes of a four year pragmatic randomised controlled trial (RCT) with partial crossover. The study was designed to measure the impact of fuel efficiency interventions on room temperature, fuel expenditure, satisfaction with home warmth and a range of health indicators for households living in full or marginal fuel poverty. The design of the study allowed the impact of energy efficiency measures to be assessed in relation to a wide range of potential benefits, including fuel expenditure, room
temperature, satisfaction with heating, mental and physical health and use of health services. It is one of only five RCTs identified in a recent review
(Thomson et al., 2009). The findings will be considered in relation to this wider body of work.
Families living in fuel poverty need to spend a relatively high proportion of disposable income in order to achieve winter room temperatures officially defined as adequate. In the UK, households in which at least 10% of disposable income must be spent in this way are considered to be living in fuel poverty (DETR, 2000). The proportion of households in England meeting this criterion has increased from 8% to 12% between 2001 and 2006, with NE England, the location of the present study, experiencing both the highest rates and the greatest increase over this period, from 10% to 17% (DEFRA, 2009). UK government policy has sought to totally eliminate fuel poverty in
vulnerable households, containing people with disabilities, older people and children, by 2010. This target, supported by programmes such as Warm Front which funds energy efficiency measures, and winter fuel payments, has ‘slipped’ (DEFRA, 2008), mainly due to fuel price increases.
4
Explanatory models for the hypothesised health-damaging impact of fuel poverty are discussed below. However, the research design involved a pragmatic trial in which interventions were tailored to the characteristics of individual homes. This design does not provide a good way of disentangling the many specific factors which might mediate any relationship between fuel poverty and poorer health. Pragmatic trials are designed to guide practice rather than to test explanatory models (MacPherson, 2004). Such trials are well-suited to generating policy-relevant conclusions because they assess the net benefits arising from complex social programmes which must be tailored to individual cases. They allow multiple gains to be assessed, including, in this case, not just health improvements, but also increased home warmth, greater comfort and extra disposable income. All of these possible gains can be measured most rigorously through RCTs which hold constant factors other than the intervention itself.
Fuel poverty and health
Modelling causal processes affecting the relationship between fuel efficiency and properties of the home environment such as room temperature and comfort is comparatively straightforward, but still involves complex socio-behavioural issues. For example, the present study provides information about the decisions of families living in fuel poverty on taking fuel efficiency gains as different mixes of higher temperatures and financial savings. Any relationship between fuel poverty and health would involve more complex processes. A concise theoretical model of this relationship is presented in Figure One, below.
INSERT FIGURE ONE HERE.
The starting point for this analysis is the well-established correlation between relative socioeconomic deprivation and health. Although this relationship has been recognised for well over a century, its explanation remains contested (Link and Phelan, 2004). A large number of non-exclusive mediating
5
processes which may influence the relationship between socioeconomic status and health.
As illustrated in relation to the findings of the trial discussed in the present paper, fuel poverty does not translate directly into cold conditions because families may choose to sacrifice other needs in order to stay warm. However, lower home temperatures and fuel poverty are strongly correlated (Healy and Clinch, 2002). Many explanations of any causal link from fuel poverty/low ambient temperatures to poorer health can be hypothesised. Greater
exposure to damp and mould may increase the risk of asthma (e.g. Fisk, Lei-Gomez and Mendell, 2007). Harm to mental health may result from the discomfort of living in a cold environment (e.g. Gilbertson et al., 2006). Spending a relatively high proportion of disposable income on keeping the home warm may damage health indirectly by increasing financial stress or reducing the money available for other health-related expenditure such as buying fruit and vegetables (e.g. Kearns and Petticrew, 2008). Finally, being unable to heat the home adequately may damage social relationships if household members lose privacy because they cannot use available space, or cannot engage in reciprocal social visits because their home is too cold and damp (e.g. Harrington et al., 2005).
The health impact of fuel poverty interventions
If exposure to fuel poverty increases the risk of health problems, partly driving the relationship between socioeconomic and health status, it follows that interventions which reduce fuel poverty by increasing home heating efficiency will also have the potential to generate health gains. Although government is predicated on the assumption that this effect exists, it has not been robustly demonstrated in relation to the climate and housing conditions found in the UK and comparable countries. Thomson et al. (2009) have recently reviewed studies concerned with the health impact of home improvements. The
reviewers concluded that UK studies have found only small health gains in general self-reported, respiratory and mental health. In contrast, they identified two large New Zealand RCTs (Howden-Chapman et al., 2007; 2008) which demonstrated stronger health benefits from energy efficiency interventions. Thomson et al. (2009) suggest that this difference may have arisen because the New Zealand houses had much poorer energy efficiencies than those typically found in the UK, and because these studies targeted individuals with existing respiratory problems.
6
factor for poorer health. However, the inverse of this argument does not hold true. Health gains may not be detected simply due to the many possible methodological limitations of randomised controlled trials. These limitations include problems with randomisation, e.g. selective dropout from the study, inability to vary home fuel efficiency sufficiently, shortcomings with the health status measures, and, in particular, the shortness of the time-scales imposed by the practicalities of randomised controlled trials. RCTs are confined within the temporal horizons imposed by their length of funding, an easily overlooked limitation (Heyman et al., 2010, pp. 110-114). The processes represented schematically in Figure One may require several decades to take full effect. Nevertheless, some signs of health gains over much shorter time frames such as the two year period following the fuel efficiency intervention built into the design of the trial considered in the present paper may be expected.
Moreover, as briefly discussed in the next section, RCTs provide the most rigorous way of assessing non-health gains such as increases in winter home temperatures, reductions in fuel bills and improvements in comfort.
Wider benefits of heating efficiency interventions
Thomas et al. (2009) note in the review discussed above that little research has assessed the impact of energy efficiency interventions on social and economic gains, although the limited evidence available suggests that they confer a number of benefits, including increased comfort, greater use of available space and better relationships between household members
(Gilbertson et al., 2006). One non-RCT concluded that improved insulation of roofs and wall cavities reduces space heating bills by 17% in non-centrally heated, and 10% in centrally heated, homes (Hong, Oreszczyn and Ridley, 2006). The present study was designed to assess such gains through the more accurate method of comparing randomly selected trial and control groups.
METHODOLOGY
An overview of the trial design will be presented, followed by a summary of the methods, including sampling, data collection, analysis and ethical issues. The data collection methods have been more fully described elsewhere (Harrington et al., 2005; Heyman et al., 2005).
7
The present study was designed to add to the limited evidence base concerning the benefits of generic energy efficiency interventions for
households living in full or marginal fuel poverty, through a pragmatic RCT in which energy efficiency measures were tailored to the needs of each
household. The study was designed to assess the potential health, and also personal, social and economic benefits of energy efficiency measures,
including increased satisfaction with home warmth, reduced heating costs and improved social relationships.
Baseline data were obtained from initial interview and home energy efficiency surveys conducted in years one (2000/2001) and two of the study. Among 535 households recruited through initial screening procedures, 44% (237) were judged to be in full or marginal fuel poverty on the basis of the more detailed information obtained in the survey. Among households included in the trial on account of full or marginal fuel poverty, 46% (94) lived in council-owned, and 43% (89) in owner-occupied, properties. Serious problems with damp and/or mould were reported by 28% (66) of respondents from
households included in the trial on account of full or marginal fuel poverty, but only 13% (39) of those from the comparison group (chi-square=20.2 with 1 d.f., p. <.0001).
Households assessed as living in full or marginal fuel poverty were
randomised during year one into intervention and control groups. Those in the intervention group received an individually tailored package of improved heating and insulation during the summer of year three. Control group households received the heating and insulation package in year four. The packages were worth an average of £727 (range £0-£3,335), and included loft insulation (54%), cavity wall insulation (53%), draught exclusion (29%)
heating controls (20%), central heating (13%) and other measures as required.
Interview and SAP surveys were conducted in the spring at the end of years one to four. None of the trial sample had received the energy efficiency
intervention at the time of the year one and two surveys, whilst all households in the trial and control group had received the intervention before the year four survey was carried out. Thus, the design provided two pre-intervention
baseline surveys, a comparison of randomly selected trial and control groups after the former but not the latter had received the fuel efficiency intervention (year three), and a follow-up after the control group had received the same intervention (year four). This design has the potential to provide strong
8
baseline period (years one and two) or after both groups had been given the energy efficiency improvements (year four). Annual interview and SAP surveys were also undertaken with a respondent from about half of the 298 households who were assessed as not living in fuel poverty, selected randomly.
RCTs of health or social interventions inevitably raise ethical issues because recipients are treated differently for research purposes, albeit with their
consent. Medical researchers justify this practice through claiming ‘equipoise’ (Fries and Krishnan, 2004), e.g. that the risks associated with a new drug more or less balance its possible benefits. This argument cannot be applied to fuel efficiency interventions which do not involve any known risks. In this case, the trial design can be defended on the grounds that families in both the trial and control conditions eventually received an intervention which would not have otherwise been available. Nevertheless, as Fries and Krishnan (2004) argue some tension between the requirements of research and the needs of research participants must be acknowledged.
Sampling
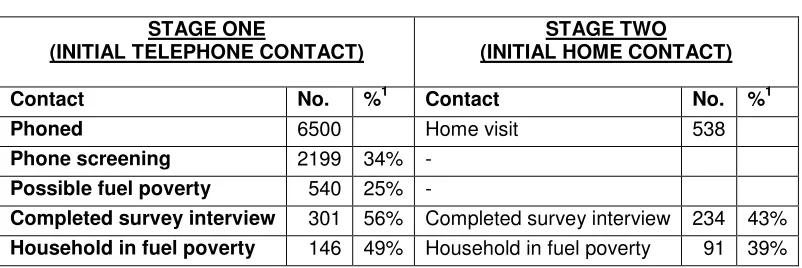
The sample were recruited in a relatively poor area of Tyne and Wear in NE England. Recruitment was undertaken in two stages (see Table One). In the first stage, 6500 households, a 10% sample of those living within the study boundaries, were randomly selected from the local telephone directory and invited to participate in a telephone screening survey. Those who met the initial screening criteria for full or marginal fuel poverty were asked to participate in the full survey. In view of the low yield of households living in fuel poverty, discussed below, a second recruitment stage was undertaken through direct house to house calling in areas where fuel poverty was likely to occur. Contacted individuals were invited to take part in the full survey.
Potential participants were advised that they would be eligible for free home improvements designed to enhance energy efficiency if they met the criteria for full or marginal fuel poverty, and would otherwise be given free low energy light bulbs. The comparability of the trial and control groups in relation to sample attrition over the four years of the trial will be discussed in the data analysis section.
9
Measures relating to household heating covered energy efficiency ratings, fuel expenditure, room temperature and satisfaction with home warmth. Heating consultants undertook home energy efficiency assessments which were used to derive SAP ratings, adopted by the UK government as a standardised approach to measuring the energy performance of dwellings (DEFRA, 2008). They take into account thermal insulation, ventilation, heating systems, solar gains and fuel sources. The maximum rating indicates that a home can be heated at zero cost. The SAP rating system was modified in 2005 to a 100 point system. The present study used the SAP-2001 method, in which energy efficiency is scored out of 120. SAP ratings do not take into account external environmental factors such as wind exposure. However, these differences should have been randomised across the trial and control group, and will have stayed constant over the period of the study. It is therefore unlikely that they could have affected comparisons between the trial and control group or assessment of gains resulting from the fuel efficiency intervention.
An independent market research company carried out interview surveys with a household respondent in their own home. The interviews covered
respondent satisfaction with energy efficiency, fuel costs and the health of household members. Fuel expenditure was calculated directly from meter readings where possible, and otherwise through interview questioning. Respondents were asked to show fuel bills if available. Fuel costs based on meter readings were calculated using prevailing prices. It was not possible to separate out the proportion of energy consumed for purposes other than heating. However, it is unlikely that any average reduction in household fuel consumption resulting from energy efficiency interventions can be explained in terms of lower fuel use for other purposes such as cooking. Satisfaction with home heating was assessed through responses to a nine item scale. Year three winter temperatures were extensively logged for a sub-sample of 100 household selected randomly from the trial and the control group.
The health of the respondent and other household members was assessed in a variety of ways, all of which relied on respondent answers to survey
questions. A measure of overall health for each household member was derived from answers to the question ‘In general, at the moment, how good is your own health and that of other people in the household?’. A similar
question was used to measure perceived changes in health over the last year. Checklists were employed to identify symptoms experienced by members of the household and usage of health services over the last few months.
Respondents were asked to complete two widely used standardised
10
and limitations to physical, social and role activities. The SF36 has been shown to be psychometrically reliable, and valid in that scores predict the presence of known clinical conditions and general practitioner judgements of condition severity (Garratt et al., 1993).
DATA ANALYSIS
Sampling Outcomes
Sampling outcomes at the start of the study are summarised in Table One below.
Insert Table One here.
As documented in Table One, recruitment into the trial of households living in full or marginal fuel poverty was achieved through several steps. Because of substantial attrition, the achieved sample of 237 households living in full or marginal fuel poverty does not necessarily represent the wider population. A small difference between the two sampling stages in the prevalence of full or marginal fuel poverty was found, with 49% (146) of wave one (telephone recruitment) respondents and 39% (91) of wave two (doorstep recruitment) respondents meeting the study criteria (P=.02, Fisher’s exact test, two-tailed). This finding suggests that telephone screening surveys may provide a slightly more efficient way of identifying households in fuel poverty than does
neighbourhood targeting. No other statistically significant differences between the two sub-samples were identified. Over two-thirds of respondents (70%, 166) were female, with a similar gender mix between the two sampling stages.
Initial comparability of the trial and control groups
11
wait longer for the fuel efficiency intervention. Differential attrition occurred entirely in the first sampling wave who had to wait longer for the intervention than the second wave, due to unanticipated difficulty in recruiting the sample. All analyses of pre-trial comparability of the trial and control group and of trial intervention impact were undertaken separately for the two waves and
generated similar trends in each case. It is therefore unlikely that the study conclusions were biased through this differential loss of the initial sample.
Households allocated to the trial and control groups were matched in
aggregate on the following variables: fuel poverty measured by the estimated proportion of disposable household income spent on fuel; housing tenure; respondent age; and presence of longstanding health problems in the household.Comparisons of the trial and control groups prior to the
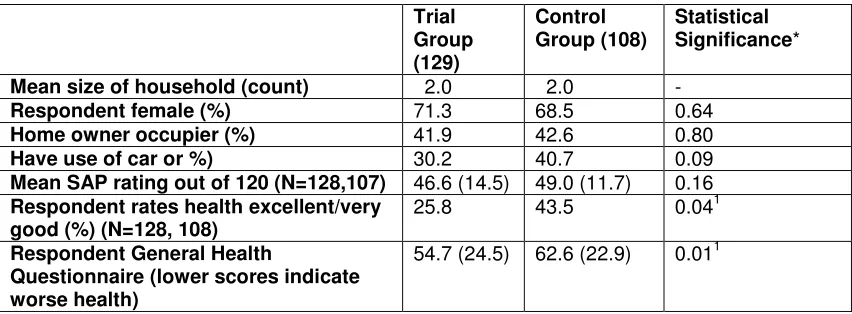
implementation of home improvements, after the year two surveys in 2001, are given below, for a range of variables, in Tables Two and Three.
Insert Table Two here
Insert Table Three here
As can be seen, the trial and control groups were comparable in demographic profile, socioeconomic status and energy efficiency measured by SAP ratings. Differences were found on year one health measures despite successful aggregate matching on the measure of the presence of longstanding health problems, with the control group reporting better health on both measures. Similar, but statistically insignificant, differences were also found in year two. Although probably due to chance, they might have resulted from differential drop-out from the trial and control group. As discussed below, the modest conclusions of the present trial can perhaps withstand this threat to its internal validity.
Sample attrition
12
Insert Table Four Here
The higher attrition rate in the control group in years one and two, captured in the difference between the sizes of the two groups (114 and 92 respectively in the year two survey), was matched by a higher rate in the trial group in year four, when control group households received the fuel efficiency intervention. As already noted, control group sample members may have been more likely to leave the trial before year three because they had to wait longer to receive the fuel efficiency intervention. Conversely, in year four, control group
participants had less time to drop out of the trial after receiving home
improvements than had members of the trial group who received them in year three. Selective attrition might have introduced differences between the trial and control group, undermining the comparability achieved through
randomisation. However, no year three differences were found between the two groups for the demographic variables included in Table Two and Three, namely household size, respondent age and sex, home ownership and use of a car or van.
Study findings
The main RCT findings concerning fuel efficiency, home warmth, fuel expenditure, satisfaction with home warmth and health impact will be discussed below.
The impact of the trial on fuel efficiency
Changes in energy efficiency resulting from the home improvement
programme were assessed by comparing SAP-2001 ratings over time, and between the trial, control and comparison groups. The results are summarised in Table Five, and statistically significant comparisons outlined below.
Insert Table Five here
13
the average trial SAP-2001 rating had increased to 60.6 out of 120, equivalent to a mean SAP-2005 score of about 58 (DEFRA, 2008, p. 157). This statistic compares favourably with the 2005 national average SAP-2005 rating for England of 48 (Department for Communities and Local Government, 2007). (However SAP ratings of >75 (Edwards, 1990) can be achieved in modern dwellings with good cavity wall and loft insulation, double glazing and
condensing boilers.) The trial and control group did not differ in initial year one and two mean SAP ratings, as would be anticipated on account of their
randomised, stratified allocation to one or the other. The SAP ratings for each group were higher in the year following the fuel efficiency intervention, year three for the trial and year four for the control group, than in the preceding year. Finally, SAP ratings for year three were higher in trial group households, which had received the fuel efficiency programme, than in control group households, which had not. Overall, this intervention generated SAP-2001 gains of about 12 points, the impact of which will be discussed in the next section. Similar gains (13 and 11 points respectively) and post-intervention SAP ratings (61 and 63 points) were achieved for both the trial and control group,
Comparison group households who were not experiencing fuel poverty lived in more fuel-efficient households (means around 54 points) than did the combined trial + control group (means around 49 points) before the fuel efficiency interventions. Although they did not receive the intervention, the SAP ratings of comparison group households also improved over the four years of the study. This finding suggests that they had initiated energy
efficiency improvements themselves or received them from elsewhere. At the end of the trial, in year four, mean SAP ratings of the trial, control and
comparison groups were similar (61, 60 and 63 points respectively). This pattern of findings suggests that families will choose to pay for fuel efficiency improvements themselves if their disposable income allows them to do so. The intervention brought families living in full or marginal fuel poverty up to the level of fuel efficiency achieved by those who were better off.
The impact of the trial on room temperatures
14
(Similar findings were obtained if average minimum temperatures were used in the analysis.)
Insert Table Six here
As can be seen, the energy efficiency gains achieved in the trial group were associated with a modest increase in average room temperature difference from external temperatures which were greatest, at 1.4 degrees Celsius, with respect to the living room in the evening, the only statistically significant difference. Although the sample size was small and the comparison
statistically insignificant, a somewhat greater average difference from control group living room evening temperatures, of 1.9 degrees Celsius, was
observed for five trial group households which received both heating and insulation measures.
The temperature data collection method did not allow periods when rooms were and were not being occupied to be differentiated. Nevertheless, the findings suggest that these gains brought room temperatures up towards currently accepted standards. In year three, control group households (N=48), logged living room temperatures below 21 degrees Celsius on 54% of winter evenings, and below 18 degrees on 29% of such evenings, compared with 40% and 19% respectively of experimental group households (N=48) who had received energy efficiency interventions. The <21 degrees comparison is close to, and the <18 degrees comparison is, statistically significant (t=2.1, P=.04, 2-tailed test).
15
The impact of the trial on fuel expenditure
Comparisons of annual fuel expenditure are presented in Table Seven, based on actual bills where available (41%) or estimation where not. Very similar values were obtained if the analysis was confined to cases in which bills had been used. Fuel expenditure was also compared with the estimated cost of heating the home adequately.Correlations between year three SAP ratings, fuel expenditure and room temperatures indicated that fuel expenditure was modestly correlated with room temperatures (e.g. r=0.37, N=94, P<.0001 for fuel expenditure with average night time bedroom temperature). However, the correlations between SAP ratings and room temperatures, although all
positive, did not attain statistical significance even when fuel expenditure was controlled for.
Insert Table Seven here
Contrary to expectation, average fuel expenditure was actually slightly higher in the trial than the control group, but this difference was statistically
insignificant. More detailed comparisons, e.g. of expenditure changes between the winter of years two/three and years three/four generated the same conclusion. The trial produced no evidence that the fuel efficiency intervention had affected fuel expenditure. Because trial group homes were, on average, more fuel-efficient than those of the control group at the end of year three, the former needed to spend less on fuel than the latter in order to achieve a given room temperature. As trial group fuel expenditure did not drop after they received the intervention, the difference between observed and required fuel expenditure varied statistically significantly between the two groups, with the trial group spending modestly more and the control group a little less than was expected. This finding suggests that trial group households took energy efficiency gains entirely as greater warmth rather than reduced bills.
The impact of the trial on satisfaction with home warmth
16
question which perhaps measured this perception most directly, namely: ‘The house is always warm enough, no matter how cold it is outside’.
Comparing years two and three, trial group satisfaction improved more than that of the control group, by an average of 1.18 points versus 0.64 points on a four point scale. The difference was statistically significant (Wilcoxon W=6147, N=172, P=.02). Similarly, comparing years three and four, the trial group’s mean satisfaction score improved by 0.07 points, and that of the control group by 0.41 points (Wilcoxon W=4154, N=134, P=.02). These findings suggest that respondents rated household warmth more favourably after receiving the intervention. However, the differences might have resulted, in whole or in part, from a placebo effect affecting those who believed that their home had been improved. It was not possible to ‘blind’ research participants about whether they had received the fuel efficiency intervention. The impact of energy
efficiency measures was greater among the subgroup who had received both heating and insulation improvements. For example, between years two and three, satisfaction with household warmth increased on average by 1.0 scale points (maximum possible=4) among 12 trial group respondents who had received both heating system and insulation measures, compared with 0.35 points among 81 respondents who had not received both measures.
The trial group were also less likely (11.2%, N=10) to report problems with their heating system than the control group (22.4%, N=17) in year three (chi-square=3.7 with 1 d.f., p.=.05). No such differences were found in years two or four of the study. Overall, the proportion of trial participants dissatisfied with their heating facilities dropped from 34.0% (70) in year two to 14.7% (19) in year four, indicating that the fuel efficiency intervention had produced perceived benefits in this respect at least. However, no impact on concern about mould or damp was detected.
The impact of the trial on health status
17
Because the fuel efficiency intervention affected home temperatures variably, direct relationships between the former and health measures were also assessed within the sub-sample of households from which room temperature measurements were obtained. Only one relationship to a health measure was found. Lower scores on the social functioning subscale of the SF36 were weakly but statistically significantly associated both with average night time bedroom and morning living room temperatures (r=.23, N=83, p.=.03, two-tailed test in each case) were found. The possible implications of this finding are discussed below.
DISCUSSION
Given the complexity of the multiple processes affecting and affected by fuel poverty, the best evidence about the impact of energy efficiency interventions for families living in fuel poverty must come from randomised controlled trials which offer the potential benefits of starting with roughly comparable trial and control groups at the start of a trial. Unfortunately from a methodological perspective, trials requiring complex interventions delivered over a long time period are inevitably affected by participant drop-out, and single or double-blinding cannot be achieved. In consequence, the achieved sample
unavoidably selects itself to some extent, bringing into question the comparability of groups receiving different treatments. The present study incorporated a half crossover design, with the control group receiving the intervention and follow-on surveys a year after the trial group. In addition, repeating surveys in years one and two before any interventions were
delivered in year three gave some indication of the stability of the measures. Searching for differences between the trial and control groups in year three which were reversed in year four and not evident in years two and three greatly increased the robustness of the design (Shedish, Cook and Campbell, 2002) even if the degree of trial control achieved was inevitably attenuated by the choices which study participants made.
The design allowed the physical impact of the intervention on households and its mediation by behavioural choices to be explored in some detail. Investment of an average of about £750 generated mean SAP gains of around 12 points. Similar SAP gains for a comparable investment have been found elsewhere, e.g. a 14 point improvement for an average £839 in 2004-5 (EAGA, 2005). The temperature gains following energy efficiency interventions observed in the present study, 1-2 degrees Celsius depending on the room and type of intervention, were somewhat smaller than those identified in a similar project, the Warm Front study (Oreszczyn et al., 2006). The latter study identified temperature gains of 1-3 degrees, again depending upon location and type of intervention. Both studies concluded that the greatest increases were
18
Methodological factors may account for the differences in the findings of the two studies. The Warm Front project included a much larger sample of
households, but relied on before/after intervention comparisons of households which had received and were waiting to receive energy efficiency measures, with statistical adjustment for outside temperatures. The present study compared households which had been allocated randomly to receive or wait for home improvements. The Warm Front study excluded about 30% of measurements made on warmer winter days and standardised background temperatures at 5 degrees rather than the average winter temperature of 6.3 degrees Celsius. Overall, the two studies suggest that, in the UK, average winter room temperature gains of about 1 to 3 degrees Celsius are generated by energy efficiency measures, depending on how much work is done.
Households, overall, did not take any of the modest gain resulting from the energy efficiency intervention by spending less on fuel, a finding which again replicates that of The Warm Front study (Oreszczyn et al., 2006). The
temperature data obtained for the present study provides only a limited
indication of attained temperatures because it was not possible to differentiate periods when rooms were and were not being used. Nevertheless, the
findings suggest that families were using energy efficiency improvements in order to achieve acceptable levels of warmth, rather than overheating their rooms relative to official standards.
No evidence of health gains resulting from energy efficiency measures was obtained. Dramatic gains would have been surprising in view of the relatively small impact of the achieved energy efficiency improvements, and the two year time frame over which health impact was assessed. Possibly, health gains would have been identified over a longer time period, with larger samples, or with physiologically based health measures. However, the modest magnitude of the energy efficiency gains achieved suggest that
substantial general health improvements are unlikely to be detected, although energy efficiency measures may confer detectable health benefits for
vulnerable groups, and for those whose homes are highly fuel-inefficient, as was found in New Zealand (Howden-Chapman et al., 2007; 2008).
Nevertheless, some hints of health gains might have been expected over the two years in which the trial group lived in homes with improved fuel efficiency. The only intimation of such gains in the present study comes from the finding that room temperatures were associated with better scores on the social functioning subscale of the SF36. Although correlation does not demonstrate causality, this finding fits with present understandings about responses to fuel poverty. Families living in colder homes may feel less able to develop
19
intimation at least of future health gains from sustained improvements in home warmth, and illustrates the complex processes through which they might be generated. Within the range common in the UK at least, colder household temperatures may affect health by constraining social relationships rather than through their direct physiological impact.
The UK government has maintained its effort to eliminate fuel poverty during a current crisis in public funding, allocating an additional £200,000,000 to the Warm Front programme in late 2009. As noted in the Introduction, despite such programmes, fuel poverty is presently becoming more prevalent through increases in energy costs which are now combining with increasing
unemployment. Demonstration of health gains from fuel efficiency
interventions would clearly strengthen the case for expanding fuel efficiency programmes at a time of austerity. The resulting health gains would even pay for themselves through reducing demand for healthcare. Unfortunately, the present study and others have not as yet identified clear health benefits from fuel efficiency interventions for the UK and other countries with comparable housing stocks.
Nevertheless, the emerging body of findings provides good justification for continuing such programmes. They generate modest but long-lasting fuel efficiency gains which translate into increased room temperatures rather than financial savings, a sign of the importance which people with limited resources place on staying warm. Such programmes bring homes up to the standard of energy efficiency achieved by more prosperous families. The similarity
between the SAP ratings of trial/control and comparison homes at the end of the present study suggests that families seek to move towards an optimal level of fuel efficiency relative to costs and prevailing expectations.
Government programmes enable people living in fuel poverty to achieve this standard. Warmer home temperatures show some association with better social functioning, probably because they allow space to be used more fully, and remove a barrier to inviting visitors into the home. Although the weak correlation found in the present study provides no more than a suggestion of a possible relationship, it does illustrate the complexity of the socially mediated relationship between the physical environment and health outcomes.
20
REFERENCES
Department for Communities and Local Government (2007) English House Condition Survey 2005 Annual Report. Available at
http://www.communities.gov.uk/documents/housing/pdf/321566.pdf .
DEFRA (2008) The Government's Standard Assessment Procedure for Energy Rating of Dwellings 2005 edition, Revision 2. Available at http://projects.bre.co.uk/sap2005/pdf/SAP2005_9-82.pdf .
EAGA (2005) The Warm Front Annual Report. (London, DEFRA).
Edwards, J. (1990) Low energy dwellings in the Milton Keynes Energy Park.
Energy Management 26, pp. 32-33.
Fisk, W.J., Lei-Gomez, Q. and Mendell M.J. (2007) Meta-analyses of the associations of respiratory health effects with dampness and mold in homes.
Indoor Air 17 pp. 284-296.
Fransen, G.A.J., van Marrewijk, C.J., Mujakovic, S. et al. (2007) Pragmatic trials in primary care: Methodological challenges and solutions demonstrated by the DIAMOND-study. BMC Medical Research Methodology 7. Available at http://www.biomedcentral.com/1471-2288/7/16 .
Fries J.F. and Krishnan E. (2004) Equipoise, design bias, and randomized controlled trials: The elusive ethics of new drug development . Arthritis Research & Therapy, 6 pp. R250-R255.
Garratt, A.M., Ruta D.A., Abdalla, M.I., Buckingham, J.K., and Russell, I.T. (1993) The SF36 health survey questionnaire: an outcome measure suitable for routine use within the NHS? British Medical Journal 306 pp. 1440-1444. Gilbertson, J., Stevens, M., Stiell, B. and Thorogood, N. and The Warm Front Study Group (2006) Home is where the hearth is: Grant recipient’s views of England’s Home Energy Efficiency Scheme (Warm Front). Social Science and Medicine 63 pp. 946-956.
Harrington, B., Heyman, B., Merleau-Ponty, M., Stockton, H., Ritchie, N. & Heyman, A. (2005) Keeping home and staying well: Findings from the qualitative arm of the warm homes project. Health & Social Care in the Community 13 pp. 259-267.
Healy J.D. andClinch J.P. (2002) Fuel poverty, thermal comfort and
21
Heatwise (1992) Warm, Dry and Affordable to Heat: an interim report on the monitoring of the Easthall project (Glasgow, Heatwise: Jobs and Energy Project).
Heatwise (1994) Going beyond draughtproofing (Glasgow, Heatwise). Heyman, B., Harrington, B., Merleau-Ponty, M., Stockton, H. & Ritchie, N. (2005)Keeping home and staying well: Does home energy efficiency mediate the relationship between socioeconomic status and the risk of poorer health?
Housing Studies 20 pp. 649-664.
Heyman B., Shaw M., Alaszewski A. and Titterton M. (2010) Risk, Safety and Clinical Practice: Health Care Through the Lens of Risk. (Oxford, Oxford University Press).
Hong, S.H., Oreszczyn T. and Ridley I. (2006) The impact of energy efficient refurbishment on the space heating fuel consumption in English dwellings.
Energy and Buildings 38 pp. 1171-1181.
Howden-Chapman, P., Matheson, A., Crane, J. et al. (2007) Effect of insulating existing houses on health inequality: cluster randomised study in the community. British Medical Journal 334 pp. 1-9.
Howden-Chapman, P., Pierse, N., Nicholls, S. et al. (2008) Effects of improved home heating on asthma in community dwelling children: Randomised controlled trial. British Medical Journal 337, a1411.
Kearns, A. and Petticrew M. (2008) SHARP Survey Findings: Physical Health and Health Behaviour. (Glasgow, Department of Urban Studies, University of Glasgow & MRC Social & Public Health Sciences Unit). Available at
http://www.enhr2009.com/enhr/download/956/paper_gibson_15.pdf
Link B.C. and Phelan J. (2004) Social conditions as fundamental causes of disease. In: G. Scambler (Ed.) Medical Sociology Volume 2 (Major Themes in Health and SocialWelfare). (London, Routledge).
MacPherson H. (2004) Pragmatic clinical trials. Complementary Therapies in Medicine 12 pp. 136-140.
Oreskzczyn, T., Hong, S., Ridley, L., Wilkinson, P. and the Warm Front Study Group. (2006) Determinants of winter indoor temperatures in low income households in England. Energy and Buildings 38 pp. 245-252.
Pearlin, L., Lieberman, M., Menaghan, E. & Mullan, J. (1981) The stress process. Journal of Health and Social Behaviour 22 pp. 337-356.
22
The Office of the Deputy Prime Minister (2003) The English House Condition Survey, 2001. Available at
http://www.communities.gov.uk/documents/corporate/pdf/145310.pdf .
Thomson H., Thomas S., Sellstrom E. and Petticrew M. (2009) The health impacts of housing improvement: A systematic review of intervention studies.
American Journal of Public Health 99 pp. S681-S692.
Uchino B.N. (2006) Social Support and Health: A Review of Physiological Processes Potentially Underlying Links to Disease Outcomes. Journal of Behavioral Medicine, 29, pp. 377-387.
23
ACKNOWLEDGEMENTS
25
TABLE ONE
RECRUITMENT OF THE STUDY SAMPLE IN TWO STAGES (Overall N recruited to trial =237)
STAGE ONE
(INITIAL TELEPHONE CONTACT)
STAGE TWO (INITIAL HOME CONTACT)
Contact No. %1 Contact No. %1
Phoned 6500 Home visit 538
Phone screening 2199 34% -
Possible fuel poverty 540 25% -
Completed survey interview 301 56% Completed survey interview 234 43%
Household in fuel poverty 146 49% Household in fuel poverty 91 39%
1
26
TABLE TWO
YEAR ONE: COMPARABILITY OF THE TRIAL AND CONTROL GROUPS BEFORE TRIAL GROUP FUEL EFFICIENCY INTERVENTIONS
(Overall N=237, unless otherwise stated)
Trial Group (129)
Control Group (108)
Statistical Significance*
Mean size of household (count) 2.0 2.0 -
Respondent female (%) 71.3 68.5 0.64
Home owner occupier (%) 41.9 42.6 0.80
Have use of car or %) 30.2 40.7 0.09
Mean SAP rating out of 120 (N=128,107) 46.6 (14.5) 49.0 (11.7) 0.16
Respondent rates health excellent/very good (%) (N=128, 108)
25.8 43.5 0.041
Respondent General Health
Questionnaire (lower scores indicate worse health)
54.7 (24.5) 62.6 (22.9) 0.011
* Chi-square for nominal data; t-test for continuous data with standard deviations in brackets
1
27
TABLE THREE
YEAR TWO: COMPARABILITY OF THE TRIAL AND CONTROL GROUPS BEFORE TRIAL GROUP FUEL EFFICIENCY INTERVENTIONS
(Overall N=206, unless otherwise stated)
Trial Group (114)
Control Group (92)
Stat. Sig.*
Mean size of household (count) 2.0 2.0 -
Respondents female (%) 71.9 68.5 0.70
Home owner occupier (%) 43.0 43.5 1.0
Have use of car or van (%) 33.3 33.7 1.0
Mean SAP rating out of 120 (SD) 46.7 (15.2) 48.9 (11.8) 0.24
Respondent rates health excellent/very good (%) 25.4 35.9 0.10
Respondent General Health Questionnaire score (lower scores indicate worse health)
55.1 (26.9) 60.3 (26.2) 0.16
28
TABLE FOUR
SAMPLE ATTRITION IN YEARS TWO TO FOUR OF THE TRIAL (% of Year One Sample Shown in Parentheses)
Trial group Control group Total Year One 129 108 237
Year Two 114 (88.4) 92 (85.2) 206 (86.9)
Year Three 99 (76.7) 83 (76.9) 182 (76.8)
29
TABLE FIVE
MEAN SAP RATINGS BY STUDY YEAR
(Thick boxes show year of fuel efficiency intervention) Trial Group Control Group Comparison Group Mean SD N Mean SD N Mean SD N Year 1 46.2 14.2 121 49.0 11.5 101 54.7c 10.1 164
Year 2 46.7a 15.2 114 48.9 11.8 92 54.2 10.8 114
Year 3 61.11, a 13.5 96 48.51, b 11.6 82 56.1c, d 11.6 76
Year 4 61.2 14.0 68 60.0b 13.8 68 62.8d 12.5 54
a, b, c, d
Change over time in pair of means with the same symbol statistically significant (P.<.001), paired comparisons.
1
Difference between the means for the two groups marked with this symbol statistically
30
TABLE SIX
COMPARISONS OF DIFFERENCE BETWEEN ROOM AND EXTERNAL TEMPERATURES (DEGREES CELSIUS) IN THE TRIAL AND CONTROL
GROUPS, YEAR THREE (N=96) Trial Group mean
(N=48)
Control Group mean (N=48)
t-test of difference in mean value
Statistical significance
Living room 7am-10:00am
13.8◦c 13.0◦c 1.69 0.10
Living room 6pm-11:00pm
14.5◦c 13.1◦c 2.19 0.031
Bedroom 10pm-9:00am
12.9◦c 12.3◦c 1.13 0.26
1
31
TABLE SEVEN
ANNUAL FUEL EXPENDITURE
IN THE TRIAL AND CONTROL GROUPS, YEAR THREE1 Trial Group
mean (N=99)
Control Group mean(N=83)
Mann-Whitney z value
P
Estimated fuel expenditure
£596 £567 0.827 0.408
Difference from required fuel expenditure3
£58 -£44 2.031 0.0442
1
After the trial but not the control group had received the fuel efficiency intervention
2
Statistically significant at <.05 level
3