2017 2nd International Conference on Computational Modeling, Simulation and Applied Mathematics (CMSAM 2017) ISBN: 978-1-60595-499-8
Research Performance Evaluation of Chinese University Based on DEA
Si-cheng LI
School of Economics and Management, Huazhong Agricultural University, Wuhan, China, 430070
Keywords: Chinese university, Research performance evaluation, Research assessment exercise (RAE), Data envelopment analysis (DEA).
Abstract. The university performance evaluation has been one of the difficult problems for a long time. And the university research performance evaluation is a difficulty of difficulties. Based on the practice experience of research performance evaluation from developed countries, this paper summarized and reflected on the main characteristics and shortcomings of Chinese university research performance evaluation indexes and methods, and built the measuring index system based on data envelopment analysis (DEA). Then it put forward performance evaluation technology with the combination of principal component analysis (PCA) and DEA, trying to explore the evaluation mode of university research performance innovatively.
Introduction
The same as the origin of university, university budget management has quite a long history. However, the university performance evaluation is a kind of political assessment tool derived as the appearance of the theory of government public expenditure management in western countries in the 1970s. For decades, countries all over the world have been making hard exploration on the university performance assessment and performance budget management. Especially output budget performance mode of university in Australia and the mode of performance-oriented budget performance financial allocation of university in Germany, these two modes were initiated by OECD, and of great theoretical and practical significance [1, 2].
The university performance evaluation has been one of the “difficulty” and “bottleneck” problems for a long time. And the university research performance evaluation is a difficulty of difficulties.
Literature Review
Experience of Research Assessment System of UK
University undertakes important mission of research and academic discussion, and research performance occupies considerable proportion of university performance assessment. In the late 1970s, the university development drew more and more attention of the public, and it became the priority of university management work to raise the teaching quality and research efficiency of higher education, thus the RAE (Research Assessment Exercise) and teaching assessment exercise were emerged. Since 1986, UGC (University Grants Committee) of UK carried out research assessment activities six times altogether, and has made remarkable achievement. The assessment results not only provided reference news to the financial allocation decision for Higher Education Funding Council, but also had guidance for the funding research of business, charity institution or other organizations. However, the Matthew Effect of bias to elite university in the distribution of resources as the RAE runs. The RAE institution of UK has a certain reference value for the study on research performance evaluation system and financial allocation mode in China [3, 4].
Method Evolution of University Performance Evaluation in China
performance evaluation indexes. On researching the issue of financial allocation of higher education, Huang Li (2009) raised Grey hierarchy performance assessment method, and selected standards from steps including input, process, output and effect to integrated reflect the performance realized by higher education financial allocation. Wang Hongxin (2012) applied the method combined with balanced scoreboard and key performance index and raised 14 indexes in four dimensions including teaching performance, research performance, self-financing capacity and asset performance. Through viewing literature and surveying experts, Wu Jing et al (2012) determined performance assessment indexes in five dimensions including teaching, research, finance, resource deployment and development. Based on the 3E principal of performance assessment, Liu Congbing (2012) designed indexes of hierarchies of target, rule and index. The index hierarchy contains indexes of classes of school conditions, management efficiency, output effectiveness and developing potential.
In the process of researching the relative performance amount of input and output in the university, university budget performance assessment method system with basic idea as “output/input”. Zhang Nanxing (2012) suggested that the method of input and output be applied in the university performance assessment, which contains the productivity opinion in economy, and is also the fundamental of derivation with data envelopment analysis, satisfying the scientific nature of performance assessment. Yang Xue (2012) adopted principal component analysis to assess the input and output performance of university, and designed 16 input indexes like the number of full-time teachers and 15 output indexes like undergraduate students, and eventually assess the input and output effectiveness of university with input and output model. Data envelopment analysis has also been gradually introduced into the research field of research performance evaluation of university. Studying the higher education efficiency assessment method of input and output based on DEA, Wang Jingtao (2010) designed input indexes mainly about human, material and financial resources, and output indexes mainly about personnel training, Research and social service. The introduction of data envelopment analysis solves the issue of the relative amount of university budget performance. The design of these two classes of indexes basically concluded the input of human, material and financial resources, as well as the output of three fundamental functions of modern university including teaching, Research and social service. Such design has fulfilled the contents and methods of university performance assessment, and had great significance for rational allocation of university resources.
In recent years, the study into the relative amount of input and output of performance has mainly solved the issue of overall input and output of university. However, the contribution of the input for the output doesn’t match. Here comes the question, how to construct performance index system and evaluation technology of university research performance?
Evaluation Method Design
Evaluation Index Design of University Research Performance in China
In the RAE institution of UK, universities participating in the assessment are usually asked to provide detailed information about researchers, research output, students participating in research, research scholarship, external research input, research environment and reputation[5,6]. In the research performance assessment system of CAS (Chinese Academy of Sciences), only performance indexes directly relevant to Research including the quantity, quality and funds of researches are involved. In the assessment of university research performance, how to select indexes making primary contribution to the research output?
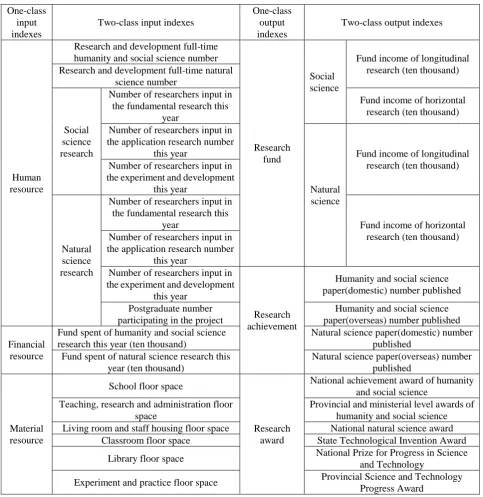
one-class output indexes including fund, achievement and award of research. Detailed indexes are shown in the following table 1.
Table 1. University research performance indexes of input and output.
One-class input indexes
Two-class input indexes
One-class output indexes
Two-class output indexes
Human resource
Research and development full-time humanity and social science number
Research fund
Social science
Fund income of longitudinal research (ten thousand) Research and development full-time natural
science number
Social science research
Number of researchers input in the fundamental research this
year
Fund income of horizontal research (ten thousand)
Number of researchers input in the application research number
this year
Natural science
Fund income of longitudinal research (ten thousand) Number of researchers input in
the experiment and development this year
Natural science research
Number of researchers input in the fundamental research this
year Fund income of horizontal
research (ten thousand) Number of researchers input in
the application research number this year
Number of researchers input in the experiment and development
this year
Research achievement
Humanity and social science paper(domestic) number published
Postgraduate number participating in the project
Humanity and social science paper(overseas) number published
Financial resource
Fund spent of humanity and social science research this year (ten thousand)
Natural science paper(domestic) number published
Fund spent of natural science research this year (ten thousand)
Natural science paper(overseas) number published
Material resource
School floor space
Research award
National achievement award of humanity and social science
Teaching, research and administration floor space
Provincial and ministerial level awards of humanity and social science Living room and staff housing floor space National natural science award
Classroom floor space State Technological Invention Award
Library floor space National Prize for Progress in Science and Technology
Experiment and practice floor space Provincial Science and Technology Progress Award
Selection of Evaluation Method for University Research Performance in China
Combined with the research achievement of performance evaluation method selected by scholars at home and abroad in recent years, the combination of data envelopment analysis and principal component analysis is planned to be adopted to solve the issue of research performance evaluation of university.
The superiority of data envelopment analysis mainly performances in: firstly, various kinds of input and output indexes could be calculated at the same time, and the data of input and output could be indexes with different evaluation unit without previously determining the relationship and weighted value of indexes. Secondly, the DEA method has changed the phenomenon of mixing effectiveness and ineffectiveness of assessment method in the past, and evaluate out the effective production frontier. Thirdly, this method concentrates on optimizing every assessment unit instead of optimizing the statistic regression of the entire unit. Compared to traditional econometric method, the known function form with parameters is unnecessary in the DEA method. Detailed evaluation procedures are as follows:
Step One: Use the principal component analysis to do dimension reduction
Based on the requirement of the relationship between the sample and the index number in DEA evaluation model, the number of evaluation index cannot exceed 2 times number of evaluation sample. It is necessary to use the principal component analysis to do dimension reduction before the performance evaluation with data envelopment analysis method. Then we can reduce a large number of performance indexes to several major factors to evaluate research performance of Chinese university with DEA.
Step Two: Use the DEA model to do three major efficiencies analysis
Put the new factors after dimension reduction into the DEA model to evaluate the research performance synthetically. The evaluating result includes three major efficiencies: technical efficiency, pure technical efficiency and scale efficiency. Technical efficiency is the product of pure technical efficiency and scale efficiency. Pure technical efficiency is the production efficiency influenced by factors such as management and technology. Scale efficiency is due to the influence of scale factor productivity. In general, if technical efficiency value is 1, it means that the unit is the most efficient and the whole operation is in the best state. Technical efficiency reflects the capacity of each decision-making unit in obtaining the maximum output in the case of a given input. In addition, the higher pure technical efficiency is, its resources use situation is the more efficient. And the higher scale efficiency is, the scale is more suitable and productivity is greater.
Application Section
Samples and Data Sources
Select 29 of the first "985" universities directly under the ministry of education in our country as the samples. In other words, they are the decision making units (DMU) in the university research performance evaluation. They are Peking University, Renmin University of China, Tsinghua University, Beijing normal University, Nankai University, Tianjin University, Dalian University of technology, northeastern University, Jilin University, Fudan University, Tongji University, Shanghai Jiao tong University, Nanjing University, southeast University, Zhejiang University, Xiamen University, Shandong University, China ocean University, Wuhan University, Huazhong University of science and technology, Hunan University, central south University, Sun Yat-Sen University, south China University of technology, Chongqing University, Sichuan University, University of electronic science and technology, xi 'an Jiao tong University, Lanzhou University. Data mainly comes from
Statistical Data Collection of the Basic Situation of Universities Directly under the Ministry of Education (2010) and Statistical Data Collection of Higher School Science and Technology (2010).
Dimension Reduction of the Universities Input and Output Indexes Based on PCA
Table 2. Factor Variables.
Index
types Factors Explained indexes Factor naming
input
in1
Number of people in Research and development full-time natural science,Number of Natural science researchers input in the
fundamental research this year, Number of Natural science researchers input in the application research this year, Postgraduate number participating in the Natural science research project, Fund spent of natural science research this year
Input factor of natural science research
in2
Number of Social science researchers input in the experiment and development this year, floor space of university, floor space of Living
room and staff housing, floor space of Library
Other Input factor 1
In3
Number of Natural science researchers input in the experiment and development this year, floor space of Classroom, floor space of
Experiment and practice place
Other Input factor 2
In4
Number of researchers in full-time Research and development of humanity and social science, Number of Social science researchers
input in the fundamental research this year
Input factor of Social science research 1
In5
Number of Social science researchers input in the application research number this year,Fund spent of humanity and social science research
this year
Input factor of Social science research 2
output
out1
Number of published Natural science paper (domestic), number of published Natural science paper(overseas), National natural science award, State Technological Invention Award, National Prize for Progress in Science and Technology, Provincial Science and Technology Progress Award
Output factor of natural science research
out2
Number of published Humanities and social science paper(domestic), number of published Humanities and social science paper(overseas),
Provincial and ministerial level awards of humanities and social science
Output factor of Social science
research
Technical, Pure Technical and Scale Efficiency Analysis
The score of decision unit factors should be proceeded normalization process with the formula
min max min i X -X X -X 10
Y , and put into DEA model (calculation result is automatically generated by DEAP 2.1
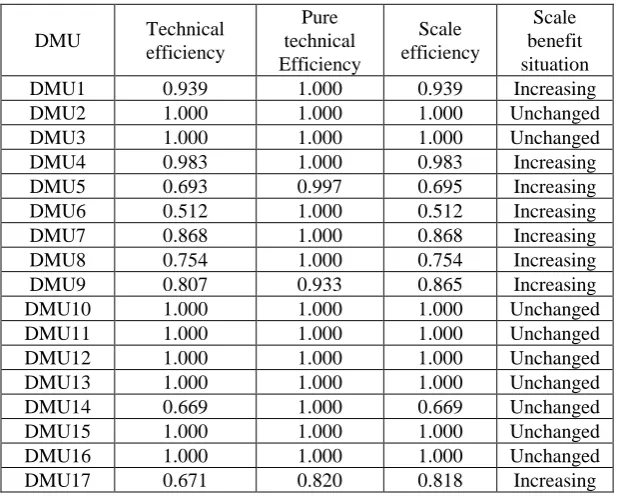
software). The input and output conditions are shown as table 3.
Table 3. Input and Output Conditions of the First Batch “985” Universities.
DMU Technical efficiency Pure technical Efficiency Scale efficiency Scale benefit situation
DMU1 0.939 1.000 0.939 Increasing
DMU2 1.000 1.000 1.000 Unchanged
DMU3 1.000 1.000 1.000 Unchanged
DMU4 0.983 1.000 0.983 Increasing
DMU5 0.693 0.997 0.695 Increasing
DMU6 0.512 1.000 0.512 Increasing
DMU7 0.868 1.000 0.868 Increasing
DMU8 0.754 1.000 0.754 Increasing
DMU9 0.807 0.933 0.865 Increasing
DMU10 1.000 1.000 1.000 Unchanged
DMU11 1.000 1.000 1.000 Unchanged
DMU12 1.000 1.000 1.000 Unchanged
DMU13 1.000 1.000 1.000 Unchanged
DMU14 0.669 1.000 0.669 Unchanged
DMU15 1.000 1.000 1.000 Unchanged
DMU16 1.000 1.000 1.000 Unchanged
[image:5.595.144.454.543.792.2]DMU18 0.739 1.000 0.739 Increasing
DMU19 1.000 1.000 1.000 Unchanged
DMU20 1.000 1.000 1.000 Unchanged
DMU21 0.638 1.000 0.638 Increasing
DMU22 1.000 1.000 1.000 Unchanged
DMU23 0.639 0.641 0.997 Decreasing
DMU24 0.955 1.000 0.955 Increasing
DMU25 0.728 0.806 0.903 Increasing
DMU26 0.802 0.899 0.892 Increasing
DMU27 0.645 1.000 0.645 Increasing
DMU28 0.705 0.865 0.815 Increasing
DMU29 0.809 1.000 0.809 Increasing
According to Table 3, the input scale effectiveness of 11 in 29 universities remain the same, and one shows a reduction, while 17 of 29 universities increase by degree. The percentages of three conditions are 38%, 3% and 59%. This suggests that the input scale effectiveness of most universities are increasing or the same. For universities with decreasing scale effectiveness, the reason of the phenomenon could be as follows. Recent years the enrollment of universities is expanding and the financial input is increasing, while some universities blindly expand the research scale while ignoring the improvement of research management level.
Among the 29 universities, there exist 7 universities in putting too much without enough output. Through the calculation result of DEA, the reason why the budget performance of these universities is low and the direction of future improvement could be determined. Take the university ranked 9 in the decision unit DMU as example, whose budget performance is low, and factors requiring improvement concentrates on the input factors including natural science research input factor (should be reduced at 2.622), other research input factor 1 (should be reduced at 7.936), other research input factor 2 (should be reduced at 0.077) and the output factors including natural science output factor (should be added at 0.167) and social science output factor (should be added at 0.229).
Conclusion
DEA and PCA have been combined for having more thorough assessment into university research performance indicators in China and designing more scientific and practical political assessment tools, so as to objectively and fair measure the management situation of university research performance in China. On one aspect, the article summarized the research achievement of research performance recently and the practical experience of research performance management under RAE institution of UK, and raised humanity input indicators of social and natural science as well as research performance input indicators of yearly fund spent and research usage area. On the other aspect, the article took the assessment result of university research performance for reference, and dug the reason why the budget performances of departments are low. According to these, the article designed the university research performance financial allocation functions for the next year, and guaranteed the consistency and cyclical of performance financial allocation management of research fund of China, which is of practical significance[8]. Of course, the article has been merely aimed at research input and output indicators of universities directly under the Ministry of education, and has not divided universities into arts and science, or highlighted school characteristics of universities. Instead, the paper concentrates on explaining the assessment method of research performance management in China.
Acknowledgement
References
[1] J Johnes, Data Envelopment Analysis and Its Application to the Measurement of Efficiency in Higher Education, Economics of Education Review. 25(2006)273-288.
[2] L.H. Wang, Australia University Scientific Research Performance Earmark Reform and Their Effects, Studies In Foreign Education. 07(2013) 122-128. (In Chinese)
[3] K Barker, The UK Research Assessment Exercise: The Evolution of A National Research Evaluation System, Research Evaluation. 16(2007) 3-12.
[4] J Taylor, Claire Baines, Performance Management in UK Universities: Implementing the Balanced Scorecard, Journal of Higher Education Policy & Management. 34(2012) 111-124.
[5] H.Y. Li, British University Scientific Research Innovation and Its Reason, Journal of Higher Education. 05(2013)103-109. (In Chinese)
[6] D Hicks, Performance-Based University Research Funding Systems, Research Policy. 41(2012)251-261.
[7] C Zhou, Government Needs to Further Increase Investment in Scientific Research in Universities, Studies in Science of Science. 10(2013)1450-1452. (In Chinese)