THE USE OF TIME BASE LAG SEQUENTIAL ANALYSIS TO
LOOK AT THE RELATIONSHIP BETWEEN
ENVIRONMENTAL EVENTS AND CHALLENGING
BEHAVIOUR IN PEOPLE WITH LEARNING DISABILITIES
Simon Whitaker, Tammi Walker and Carolyn McNally
University of Huddersfield, UK
Abstract.Although low frequency challenging behaviour (that which occurs less than once a day) is common, very little research has been done into its analysis or treatment. It is suggested that the methods of analysing high frequency challenging behaviour, such as experimental functional analysis, will not be applicable with low frequency challenging behaviour. The use of correctional analysis of case records is considered as a method for generating hypotheses as to why a client is showing low frequency challenging behaviour. It is noted that using simple correlations is a method that can provide only limited information as to the relationship between a challenging behaviour and other events. A method that can reveal more about the temporal relationship between environmental events and challenging behaviour is time base lag sequential analysis. Three case studies are presented in which time base lag sequential analysis was used to analyse the relationship between challenging behaviour and possible causal factors.
Keywords:Challenging behaviour, correlational analysis, functional analysis, time based lag sequential analysis.
Introduction
Although epidemiological studies (Harris, 1993; Kessler, Binzley, Arendt, Polomsky, & Shah, 1984) have found that the majority of people who show challenging behaviour do so at a relatively low rate (less than once a day), research into challenging behaviour has mainly focused on high frequency behaviour that occurs more than once an hour (Whitaker 1993, 1996, 2000). There is therefore a need for more research into the analysis and treatment of low frequency challenging behaviours.
With high frequency challenging behaviour experimental functional analysis has produced convincing evidence that these behaviours can be functional, that is, result in something rewarding for the client or allow him/her to avoid something unpleasant (e.g. Iwata et al., 1994). It has become apparent, however, that the factors controlling challenging behaviour can be complex. Smith, Iwata, Vollmer and Zarcone (1993) have shown that some challenging behaviours may be reinforced by more than one reinforcer, that reinforcers can change, either
Reprint requests to Simon Whitaker, The Learning Disability Research Unit, Department of Social Work, Mental Health and Learning Disabilities Studies, Harold Wilson Building, University of Huddersfield, Queensgate, Huddersfield HD1 3DU, UK. E-mail: [email protected]
over time (Lerman, Iwata, Smith, Zarcone, & Vollmer, 1994) or across situations (Emerson, Thompson, Reeves, Henderson, & Robertson, 1995), and not all functional analysis is able to identify what is reinforcing the challenging behaviour (Lerman, Iwata, Shore, & DeLeon, 1997). It is also becoming increasingly clear that events other than the availability of the identified reinforcer or aversive situation are important in determining whether challenging behaviour will occur. Kennedy and Itkonen (1993), for example, reported on two cases where it was found that what happened before school had a strong influence on challenging behaviour shown in school by two young women. In the first case, it was staying in bed too long, and in the second it was the bus stopping too many times on the way to school. Similarly, Touchette, MacDonald and Langer (1985) report a case of a young man for whom the presence of a particular member of staff was correlated with self-injurious behaviour. Theoretically, these findings have been explained in terms of setting events, which affect behaviour by influencing future stimulus response interactions (Wahler & Fox, 1981) and/or establishing operations (Michael, 1982, 1993), which affect behaviour by altering the client’s motivation.
These studies show that challenging behaviours can be determined by several variables, some of which may not be present when the behaviour occurs. If this is the case, particularly if the behaviour is of low frequency, then it may not be possible to use an experimental functional analysis to identify the controlling stimuli. This problem was anticipated by Wahler and Fox (1981), who suggested correlational analysis could also be used in addition to experimental demonstrations of the influence of a particular stimulus on behaviour. This involves looking for significant correlations between environmental events and behaviours. This type of analysis, although not a demonstration of the control of a variable over behaviour, could be used when it was not possible to do an experimental functional analysis.
An additional consideration when assessing low frequency challenging behaviours is that of getting reliable data, as it is not practical to have an independent observer studying the client for several days. One possible solution is to make use of the information recorded in the client’s case records or incident sheets. Although these data may not be reliable in the scientific sense, it has been argued (Whitaker & Lamb, 2001; Whitaker & Hirst, 2002), that uncertain reliability need not prevent data from being used to obtain clinically useful information. They justify this for the following reasons: first, records of low frequency and highly intense challenging behaviour are more likely to be accurate than those of high frequency low intensity behaviours, as it will involve less recording and be less ambiguous to carers that the behaviour has occurred. Second, although data may not be accurate in absolute terms, they may be accurate in ordinal terms, which means they could be analysed using nonparametric statistics. Third, if tests of statistical significance were used, then errors in the data would decrease the chances of getting a statistically significant result, so if a statistically significant result is found, in spite of these errors, one could have confidence in it. Whitaker and Lamb (2001) and Whitaker and Hirst (2002) both provide examples of such analysis being used clinically.
being put down. This analysis may show an increasing probability of crying in each of the minutes leading up to being picked up, followed by low probability of crying while being held, followed by a constant probability about equal to the unconditional probability rate when she is put down. These findings would suggest that the mother picked up the child as a response to the crying, and that being picked up stopped the crying.
Allison and Liker (1982) have shown that a statistical significant difference between the conditional and unconditional probabilities of an event can be calculated using the conventional zstatistic. The procedure can, therefore, be used to analyse the relationship between challenging behaviours and other events that occur at the same or different times, in order to generate hypotheses as to what may be causing the challenging behaviour.
Emerson et al. (1995, 1996) and Forman et al. (2002) have used this method in order to do a functional assessment of the challenging behaviour of children by looking at the probability of challenging behaviours in the seconds before, during, and after a given event. It seems to the present authors that the method could also be used to look at the relationship between much lower frequency challenging behaviours and possible setting events that occur in adjacent hours, days, or weeks. The results of such analysis could then be used to generate hypotheses as to the causal significance of these events. Three case studies are presented below in which this analysis is used in this way.
Case A
Jane is a woman in her mid 30s with a moderate intellectual disability. At the time of the assessment she lived in a group home run by an organization specializing in providing care for people with learning disabilities who showed challenging behaviour. Jane was referred to the clinical psychology department as she was having aggressive temper outbursts. During initial interviews with the staff at her group home it was suggested that she was more likely to have a temper outburst before she had contact with her parents. As the group home had kept records of both when she went home and when she was recorded as being agitated, it was decided to use these to see if there was evidence of a relationship between the two.
The home had records of her behaviour and home visits between 1997 and 2001, but with several gaps in the records there were only 882 days of recordings. During this time she had been recorded as having contact with her parents on 52 days; there were 288 days when she was recorded as being “agitated”, “up and down”, “unsettled” or “violent” or “aggressive”. Of these she showed physical aggression on 97 days. Correlations between the number of days per month (four consecutive weeks) she had contact with her parents, the number of days per month when she was reported to be agitated, and the number of days per month she was reported to be aggressive, were performed. The correlations between contact with parents and both agitation and aggression were non-significant (Pearsonr=.096 andr=.037 respectively).
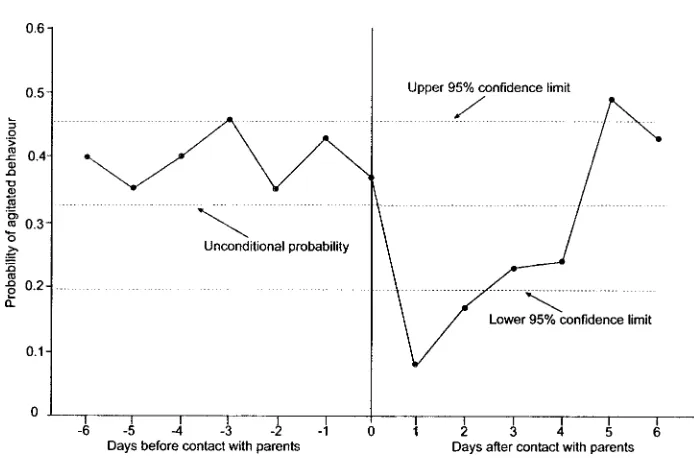
Figure 1.The probability of being recorded as showing agitated behaviour on the day on which she has contact with her parents (0) and on each of the 6 days before (−1 to−6) and after (1 to 6). contact with her parents
days and dividing them by the number of times she went home. As there was a possibility that when contacts with her parents occurred close together there was an overlap of effect so that the probability of an outburst was affected not only by the given contacts visit but also by others that occurred within a few days, the following rule was applied to correct for this. Data from days preceding a day on which she saw her parents was not included if she had a previous contact visit within the previous 6 days. Similarly, data from days following contact with her parents were not included if she had a second contact visit within the next 6 days. As with the studies of Emerson et al. (1995, 1996), 95% confidence limits were calculated in the manner suggested by Allison and Liker (1982).
a relationship between contact with her parents, but that this relationship is complex, possibly with the prospect of seeing her parents causing agitation on the days before she sees them, and/or seeing her parents resulting in a decrease in agitation.
Case B
Jenny is a woman in her 20s who, in addition to a mild learning disability, has a diagnosis of Borderline Personality Disorder. At the time of the analysis she was resident in a specialized forensic treatment unit for people with learning disabilities. Treatment on the unit was multidisciplinary, comprising psychiatry, clinical psychology, occupational therapy, and nursing and reviewed by a multidisciplinary team consisting of the heads of each of these specialties. Jenny showed periods of aggressive agitation. As with the previous case, it had been hypothesized that these incidents were made more likely if she had contact with her father. An analysis was done of her case records in order to test this hypothesis.
Data were taken from her records covering 153 days, during which time she had contact with her father on 28 days and was recorded as showing disturbed behaviours that were regarded as symptoms of borderline personality disorder (self-injury, aggression, hiding objects that could be used for self-injury, refusing to take her medication, being tearful and complaining of hearing voices) on 41 days. It was found that the correlation between the number of days per month when she had contact with her father and the number of days when she was recorded as showing disturbed behaviour was significant (Pearsonr=0.576 significant at 0.01 level 2 tails), giving support to the hypothesis. The relationship was further examined using a time base lag sequential analysis to see what the probability was of her showing disturbed behaviour on the day she had contact with her father and on the 3 days both before and after she had contact. The same rule as had been used with Case A for dealing with visits that occurred too close together was applied, except that in this case data from lag days that occurred within 3 days of a second visit were not used in the analysis.
From Figure 2 it can be seen that the probability of her being recorded as showing disturbed behaviour on the 3 days before seeing her father was close to the average of 0.27. On the day she saw her father it rose to 0.50, a significantly higher probability. In the 3 days after seeing him the probability again dropped to within the 95% confidence level. This analysis therefore gives further support to the simple correlation, and suggests that if there is a causal relationship between seeing her father and showing disturbed behaviour, then the effect is mainly on the day on which she sees him.
Case C
Figure 2.The probability of being recorded as showing disturbed behaviour on the day on which she has contact with her father (0) and on each of the 3 days before (−1 to−3) and after (1 to 3) contact with her father
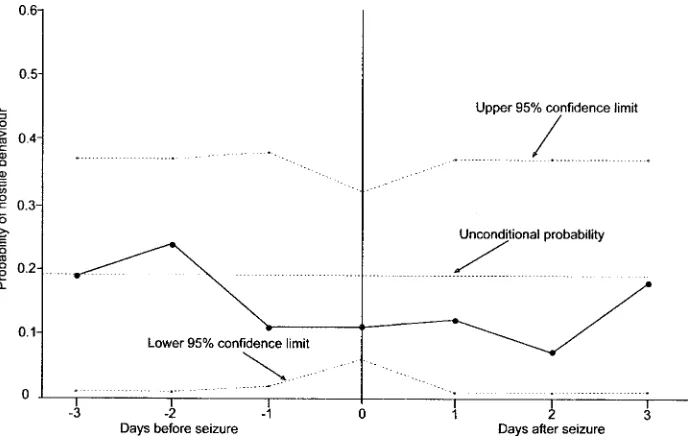
examined using a time base lag sequential analysis. As with Cases A and B, data from lag days that occurred within 3 days of a second fit were not used in the analysis.
As can be seen in Figure 3 the probability of him showing hostility is not significantly higher or lower on days when he has a seizure, or the 3 days either before or after he has one. This finding is consistent with the correlation in again failing to find evidence of a relationship between his seizures and difficult behaviour. Although this is a negative finding, it is still important as it tests a clinical hypothesis as to why he was showing challenging behaviour and demonstrates that it can be rejected (cf Popper, 1972).
Discussion
The above case examples demonstrate the use of time base lag sequential analysis in analysing the case records of clients who show relatively low frequency challenging behaviour. Case B shows the method being used to give further support to a hypothesis that had already been suggested by a simple correlation. Case A is an example of it indicating a possible relationship between an event and behaviour that was not shown with a simple correlation.
Figure 3.The probability of being recorded as showing hostile behaviour on the day on which he was recorded as having a seizure (0) and on each of the 3 days before (−1 to−3) and after (1 to 3) having a seizure
of agitated behaviour in the days after their visit, and then a gradual increase in the probability of agitated behaviour over the next 4 days. This suggests the following hypotheses as to why she was showing the agitated behaviour: (1) she became agitated before seeing her parents due to the prospect of seeing her parents; (2) she became relaxed after seeing her parents for some reason; or (3) the relationship between contact with parents and agitated behaviour occurs for some other less direct reason, such as her telling other residents that she is going home, making them feel jealous and becoming hostile to her. Examining what was actually happening in the home at these times could test and refine these hypotheses so that a working hypothesis as to why the client is displaying the challenging behaviour can be produced. A treatment plan could then be based on this working hypothesis. Once treatment has been decided upon, knowing when the challenging behaviour is likely to occur in relation to observable events also allows one to target treatment to appropriate times and places. With Case A, relaxation, which has been found to be an effective way of dealing with agitated behaviour in learning disabilities (cf Whitaker, 2001), could be used with her in the days before seeing her parents, when the chances of agitated behaviour were higher.
the client is showing the behaviour he/she is. The rejection of invalid hypotheses is clearly clinically important as it reduces the number of possible explanations for the clinical condition and prevents treatment being based on an invalid hypothesis. It is not claimed with Case C that the analysis was sufficient to totally reject the hypothesis that his hostile behaviour was a function of his seizures but the analysis does show that the available evidence does not support this hypothesis, so it is possible to say that there is no evidence for it.
Time base lag sequential analysis, therefore, seems to be a useful additional means of examining data available in case records to test hypotheses as to why a client shows challenging behaviour. However, as with simple correlations, there are some major theoretical and practical limitations with the method that should be taken into account when considering the results of such an analysis. First, the analysis can only indicate that there is a possible relationship between an environmental event and a client’s challenging behaviour. It is non-experimental; therefore, a significant result does not demonstrate causality. A significantly higher probability of a client showing challenging behaviour before or after an environmental event may be due to many things other than the environmental event causing the challenging behaviour (cf Whitaker & Hirst, 2002). For example, both the challenging behaviour and the environmental event could be caused by a third variable affecting both the occurrence of environmental events and the challenging behaviour. Even if the relationship between environmental event and challenging behaviour is causal, the direction of causality is not clear from this analysis, it being quite possible that challenging behaviour causes the occurrence of environmental events rather than the other way round. Therefore there may be several possible explanations for positive results. Similarly, if it is assumed that the positive results are due to a causal relationship, the analysis still does not tell us anything about the mechanism of this causal relationship (cf Kahng et al., 1998), though it may help in the development of hypotheses as to the nature of this mechanism.
Second, if the data are based on staff recordings, then the reliability of the data will be unclear. It will be unclear, therefore, whether staff recorded all incidents or a proportion of them, or whether the accuracy of recording fluctuates over time randomly or systematically. Although random error in recording, such as on average only recording 70% of incidents, would tend to make positive results less likely, systematic errors could produce a positive result.
Third, it is unclear whether the different topographical behaviours and events that are grouped together as belonging to unique categories are all members of these categories. For example, in the case studies above various behaviours were grouped together as it was assumed they were members of the same behavioural class, when in actual fact different behaviour could have had very different causes. Any positive results therefore may only apply to some of the behaviours recorded or some of the events recorded.
diligent recording and low rates of both during periods of slack recording. However, this sort of error would not produce the systematic relationship seen in Figure 2, where a much higher rate of challenging behaviour only occurred on the days when the client had contact with her father.
A further consideration in the use of time lag sequential analysis is the relationship between the time intervals between the given events and the period before and after the given event that target events are lagged. If this ratio is too small then it could result in an overlap effect whereby outlying lags are affected not only by the given event in the analysis but also by other given events that occur within or just outside the time period covered by the lagging. For example, if a given event occurred on average once every 5 days but with a range of 2 to 8 days, and the lagging covered 3 days before and after the given event, then there would be overlaps when some of the given events occurred within the period that is lagged, which could have an effect on the outlying lags. In the current study, this effect was dealt with in two ways: first, by choosing the number of days to be lagged so that there was reasonable compromise between the possibility of an overlap effect and the need to extend the lagging as much as possible, hence there was a 3-day lag period used in Cases B and C and a 6-day lag period in Case A; second, by eliminating days either side of the day on which the given event occurred if other given events had occurred within 6 days in Case A and within 3 days in Cases B and C.
It seems to the present authors that, in spite of shortcomings, time based lag sequential analysis has a great deal of utility. It has the potential to produce clinically useful information from data that are available when the assessment of the client’s behaviour first begins, which otherwise could appear random and non consistent. This is particularly important in the case of low frequency challenging behaviour where data from recording and observations set up as part of the assessment could take months to produce useful results. However, the method clearly does have serious shortcomings and should not be used uncritically or in isolation. Hypotheses generated should be tested out as far as possible and other methods of assessing the client should be used, such as the psychological and medical examination of the client themselves.
References
ALLISON, P. D., & LIKER, J. K. (1982). Analysing sequential categorical data on dyadic interaction: A comment on Gottman.Psychological Bulletin,91, 393–403.
BAKEMAN, R. (1978). Untangling streams of behavior: Sequential analysis of observation data. In G. P. Sachett (Ed.),Observing behavior (Vol. II): Data collection and analysis methods. Baltimore: University Park Press.
BAKEMAN, R., & GOTTMAN, J. M. (1978). Observing interaction: An introduction to sequential analysis. New York: Cambridge University Press.
EMERSON, E., REEVES, D., THOMPSON, S., HENDERSON, D., ROBERTSON, J., & HOWARD, D. (1996). Time-based lag sequential analysis and the functional assessment of challenging behaviour.
Journal of Intellectual Disability Research,40, 260–274
EMERSON, D., THOMPSON, S., REEVES, D., HENDERSON, D., & ROBERTSON, J. (1995). Descriptive analysis of multiple response topographies of challenging behaviour across two settings.
Research in Developmental Disabilities,16, 301–329
HARRIS, P. (1993). The nature and extent of aggressive behaviour amongst people with learning difficulties (mental handicap) in a single health district.Journal of Intellectual Disability Research,
37, 221–242.
IWATA, B. A., PACE, G. M., DORSEY, M. F., ZARCONE, J. R., VOLLMER, T. R., SMITH, R. G., RODGERS, T. A., LERMAN, D. C., SHORE, B. A., MAZALESKI, J. L., GOH, H. L., COWDERY, G. E., KALSHER, M. J., MCCOSH, K. C., & WILLS, K. D. (1994). The function of self-injurious behavior: An experimental-epidemiological analysis.Journal of Applied Behavior Analysis,27, 215– 240.
KAHNG, S. W., IWATA, B. A., FISCHER, S. M., PAGE, T. J., TREADWELL, K. R. H., WILLIAMS, D. E., & SMITH, R. G. (1998). Temporal distribution of problem behavior based on scatter plot analysis.Journal of Applied Behavior Analysis,31, 593–604.
KENNEDY, G. H., & ITKONEN, T. (1993). Effects of setting events on the problem behaviors of students with severe disabilities.Journal of Applied Behavior Analysis,26, 321–327.
KESSLER, J. W., BINZLEY, V. A., ARENDT, R., POLOMSKY, P., & SHAH, P. (1984). Dynamic analysis of aggression in an institutionalized mentally retarded population. In M. Berg & M. de Jong (Eds.),
Perspectives and progress in mental retardation vol. II: Biological aspects. Baltimore: University Park Press.
LERMAN, D. C., IWATA, B. A., SHORE, B. A., & DELEON, I. G. (1997). Effects of intermittent punishment on self-injurious behaviour: An evaluation of schedule thinning. Journal of Applied Behavior Analysis,30, 187–201.
LERMAN, D. C., IWATA, B. A., SMITH, R. G., ZARCONE, J. R., & VOLLMER, T. R. (1994). Transfer of behavioral function as a contributing factor in treatment relapse.Journal of Applied Behavior Analysis,27, 357–370.
MICHAEL, J. (1982). Distinguishing between discriminative and motivational functions of stimuli.
Journal of the Experimental Analysis of Behavior,37, 149–155.
MICHAEL, J. (1993). Establishing operations.The Behavior Analyst,16, 191–206. POPPER, K. R. (1972).The logic of scientific discovery. London: Hutchinson.
SMITH, R. G., IWATA, B. A., VOLLMER, T. R., & ZARCONE, J. R. (1993). Experimental analysis and treatment of multiply controlled self-injury.Journal of Applied Behavior Analysis,26, 183–196. TOUCHETTE, P. E., MACDONALD, R. F., & LANGER, S. N. (1985). A scatter plot for identifying
stimulus control of problem behavior.Journal of Applied Behavior Analysis,18, 343–351.
WAHLER, R. G., & FOX, J. J. (1981). Setting events in applied behavior analysis: Toward a conceptual and methodological expansion.Journal of Applied Behavior Analysis,14, 327–338.
WHITAKER, S. (1993). The reduction of aggression in people with learning difficulties: A review of psychological methods.British Journal of Clinical Psychology,32, 1–37.
WHITAKER, S. (1996). A review of DRO: The influence of the degree of learning disability and the frequency of the target behaviour.Journal of Applied Research in Intellectual Disabilities,9, 61–79. WHITAKER, S. (2000). The potential influences of frequency of challenging behaviour on treatment: An
analysis of the literature.British Journal of Developmental Disabilities,46, 83–88.
WHITAKER, S. (2001). Anger control for people with learning disabilities: A critical review.Behavioural and Cognitive Psychotherapy,29, 277–293.
WHITAKER, S., & HIRST, D. (2002). Correlational analysis of challenging behaviours.British Journal of Learning Disabilities,30, 28–31.