Full Terms & Conditions of access and use can be found at
http://www.tandfonline.com/action/journalInformation?journalCode=rero20
Download by: [University of East London] Date: 04January 2018, At: 08:09
ISSN: 1331-677X(Print) 1848-9664(Online)Journal homepage:http://www.tandfonline.com/loi/rero20
The
impact
of
reg
ime
-sw
itch
ing
behav
iour
of
pr
ice
vo
lat
i
l
ity
on
eff
ic
iency
of
the
US
sovere
ign
debt
market
Omar
Masood
,
Bora
Aktan
,
Beata
Gavurová,
Bachar
Fakhry
,
Manue
la
Tvaronav
ič
ienė &
Ra
imonda
Mart
inkut
ė
-Kau
l
ienė
To cite this article: Omar Masood, Bora Aktan, Beata Gavurová, Bachar Fakhry, Manuela
Tvaronavičienė & Raimonda Martinkutė-Kaulienė (2017) Theimpact of regime-switching behaviour of price volatility on efficiency ofthe US sovereign debt market, Economic Research-Ekonomska Istraživanja, 30:1, 1865-1881, DOI:10.1080/1331677X.2017.1394896
Tolink to this article: https://doi.org/10.1080/1331677X.2017.1394896
© 2017 The Author(s). Published byInforma UK Limited, trading as Taylor & Francis Group
Published online: 06 Nov 2017.
Submit your article to thisjournal
Article views: 145
View related articles
https://doi.org/10.1080/1331677X.2017.1394896
The
impact
o
f
reg
ime-sw
itch
ing
behav
iour
o
f
pr
ice
vo
lat
i
l
ity
on
efc
iency
o
f
the
US
sovere
ign
debt
market
Omar Masooda, Bora Aktanb,c, Beata Gavurovád, Bachar Fakhrye,
Manuela Tvaronavičienėf,g and Raimonda Martinkutė-Kaulienėh
aBusiness School, University of East London, London, UK;bCollege of Business Administration Department
of Economics and Finance, University of Bahrain, IsaTown, Kingdom of Bahrain;cFaculty of Commerce and
Business Administration, Future University in Egypt, New Cairo, Egypt; dFaculty of Economics, Technical
University of Košice,Kosice,Slovak Republic;eBusiness School, University of Bedfordshire, Luton, UK;fFaculty
of Business Management, Department of Economics and Management of Enterprises, Vilnius Gediminas Technical University, Vilnius, Lithuania;gDepartment of Management, The General Jonas Zemaitis Military
Academy of Lithuania, Vilnius, Lithuania; hFaculty of Business Management, Department of Financial
Engineering, Vilnius GediminasTechnical University,Vilnius, Lithuania
ABSTRACT
This articlefocuses on the asset price volatility at the stock exchange that resultfrom the regime switching behaviourin the market. This studyis devoted to the question about how the asset price volatility afects the US sovereign debt market. The efcient market hypothesis has been a basefor the asset pricing. This hypothesisis discussedin this study. The review of theliterature reveals nuances of behavioural fnance theory, and allows us to better understand the regime switching behaviourin the market. The object of empirical studyis the US sovereign debt market. We use the Markov Regime-Switching ARCH(SWARCH) model to analyse data. The results show that there is high volatility regimein both the 2012 and 2017 bonds US market, which signifcantly afects bond prices.
1. Introduction
Te efcient market hypothesis has beenthe basis of asset pricing sincethe mid-1960s. Accordingto Malkiel (1962) and Fama (1965),the efcient market hypothesis simply states thatthe price of any asset shouldincorporate all availableinformationimmediately. So, markets shouldfollow a random walkinthe short-term as stated by Malkiel (2003). Tough these assumptions do not always refectthe real picture, since market participantsin reality are afected by an array offactors, such as obvious structural changes of economy (Akhmadeev & Manakhov, 2015; Dezellus, Ferreira, Pereira, & Vasiliūnaitė,2015; Dudzevičiūtė, Mačiulis, & Tvaronavičienė,2014; Korsakienė & Tvaronavičienė,2014; Oganisjana, Surikova, & Laizāns, 2015; Prause, 2015; Rezk, Ibrahim, Tvaronavičienė, Sakr, & Piccinetti, 2015; Shatrevich
KEYWORDS Price volatility; regime-switching behaviour; switching -autoregressive conditional heteroskedasticity (SWARCH); sovereign debt market
ARTICLE HISTORY
Received 17 February 2016 Accepted 14 September 2017
© 2017 The Author(s). Published by Informa UK Limited,trading asTaylor & Francis Group.
This is an Open Access article distributed under the terms of the Creative Commons Attribution License (http://creativecommons.org/ licenses/by/4.0/), which permits unrestricted use, distribution, andreproductionin any medium, providedthe original workis properly cited.
CONTACT Manuela Tvaronavičienė [email protected]
OPEN ACCESS
JEL CLASSIFICATIONS
Do
wn
lo
ad
ed
b
y [
Un
iv
er
sit
y
of
Ea
st
Lo
nd
on
]
at
08
:0
9
04
J
an
ua
ry
2
01
8
& Strautmane, 2015; Travkina & Tvaronavičienė, 2015; Tvaronavičienė & Černevičiūtė, 2015; Tvaronavičienė, Mačiulis, Lankauskienė, Raudeliūnienė, & Dzemyda,2015; Wahl, 2015), economic growth mode, external andinternalthreats (Balitskiy, Bilan, & Strielkowski, 2014;Ignatavičius, Tvaronavičienė, & Piccinetti,2015; Kalyugina, Strielkowski, Ushvitsky, & Astachova, 2015; Lankauskienė & Tvaronavičienė, 2012; Munteanu & Tamošiūnienė, 2015; Stasytytė, 2015), approaches towards innovations and decision-making patterns (Bistrova, Lace, & Tvaronavičienė, 2014; Čirjevskis, 2015; Dobele, Grinberga-Zalite, & Kelle, 2015; Lace, Natalja, & Rumbinaite,2015; Mostenska & Bilan,2015; Oganisjana & Surikova, 2015; Olaniyi & Reidolf, 2015; Rosha & Lace, 2015; Šimberová, Chvátalová, Kocmanová, Hornungová, & Pavláková Dočekalová, 2015; Slapikaitė, Tamošiūnienė, & Mackevičiūtė, 2015; Tvaronavičienė &Černevičiūtė, 2015; Tvaronavičienė, Razminienė, & Piccinetti, 2015a,2015b; Zemlickiene, Mačiulis, & Tvaronavičienė,2017), performance of economic sectors (Uryszek, 2015; Vaško & Abrhám,2015), risk management methods (Fuschi & Tvaronavičienė,2014; Jurevičienė & Skvarciany,2016; Kaźmierczyk & Aptacy, 2016; Kulišauskas & Galinienė,2015; Novickytė & Pedroja,2014; Peker, Tvaronavičienė, & Aktan, 2014), economic policy (Dobrovolskienė, Tvaronavičienė, & Tamošiūnienė,2017; Dzemyda, Zacharevič, & Nedelko,2015; Giriūnienė & Giriūnas,2015; Jankalová & Jankal, 2017; Kozlovskis & Bistrova,2015).
Te particular questionthat our research revolves aroundis:‘Does volatilityfollow a regime-switchingtrendinthe sovereign debt market?’ Accordingto Blanchard and Watson (1982), Evans (1991) and more recently Branch and Evans (2011) and Dajcman (2015), a periodic collapsing bubble can be analysed using a Markov switching model. Tere are manyimplementations ofthe SWARCH model, howeverthetwo most relevant ones are Cai (1994) and Hamilton and Susmel (1994). Te keytothe Cai (1994) modelisthatthe Autoregressive Conditional Heteroskedasticity (ARCH)interceptis regime dependent. We optto usethe SWARCH model proposed by Cai (1994)to establish whetherthetrendin the price volatility doesfollow a regime-switching model and hence analysethetrend.
2. The theory of behavioural fnance
As stated by De Bondt (2000), one ofthe perspectives on asset pricesis‘the priceis right’ view proposed by Fama (1970). Another perspectiveisthat any uptrendin an asset price must eventually come down, resembling Newton’slaw of universal gravitation. Newton’s perspectiveis keyto understandingthe empirical studies of behavioural fnance. Some ofthe issues regardingthe pricing of assets cannot be addressed without referencetothe behav -ioural fnancetheory. Criticism by De Bondt, Muradoglu, Shefrin, and Staikouras (2008) and Kourtidis, Sevic, and Chatzoglou (2011) put againstthe neoclassical economics model. Particularly,the efcient market hypothesisisthat market participants are homo-sapiens and not homo economics. Terefore,thereis a requirementto understandthe psychology ofthe market participantsin orderto addresstheseissues. Tisledtothe alternativetheory of behavioural fnance being putforward by Statman (2008) and Subrahmanyam (2007) amongst others.
De Bondt et al. (2008) and Kourtidis et al. (2011) arguethatthereis a necessityto under -standthe psychology of market participantsin orderto provide an explanation of market abnormalities, such as asset price bubbles and crashes, and comprehendthe efciency of the fnancial markets. Kourtidis et al. (2011
Do
wn
lo
ad
ed
b
y [
Un
iv
er
sit
y
of
Ea
st
Lo
nd
on
]
at
08
:0
9
04
J
an
ua
ry
2
01
8
market participants making randomtransactions in the market can only be adequately explained bytaking account of behaviouralfactors. As discussed by Barberis and Taler (2003),theimpact onthe pricefromtheseirrational market participants can belong-lasting and signifcant. Accordingto Barberis and Taler (2003),the psychology andthelong-las t-ingimpact ofirrational market participantsformthe building blocks of behavioural fnance. Accordingto Kourtidis et al. (2011),traditional fnancialtheories examine how people behave with respect to wealth maximisation, whereas behavioural fnance is interested in how people actually behavein a fnancial environment. As defned by De Bondt et al. (2008) and Statman (2008), behavioural fnanceisthe psychological study ofthe market participants andtheirinteraction withthe fnancial markets wherethe market participants may beindividual households or organisations. Furthermore, De Bondt et al. (2008) stated thatthe behavioural fnancetheoryis not necessarily based onthe assumption of rational market participants and efcient markets. Animportantfactorinthe behavioural fnance theory asindicated by Statman (2008),isthat market participants are assumedto behave normalinthe sensethatthey act rational but with alimitedinformation set.
The mainideainfluencingthe behaviouralfinancetheoryis a number of behaviouralfactorsinfluences market participants. Kourtidis et al.(2011)statefour major behaviouralfactorsin analysingthe market par -ticipants’ behaviourinthefinancial market: over-confidence,risktolerance,socialinfluence andself-mon -itoring. Accordingto Subrahmanyam(2007)the assumptions and models behindthe behaviouralfinance theory are plausible. Hestatedthat asset prices areinfluenced by areference price andthe disposition effect. It pointstowardthe existence of a patterninthetrading activity ofindividual market participants. Another keyfactor asstated by Statman(2008)isthatthe disposition hypothesis behindthe behaviouralfinance theory predictthat market participants willrealiserapid gains but deferlosses, aretestable.
A key notionin behavioural fnancetheoryis:‘Whatisimportantin market fuctuations are notthe eventsthemselves, butthe human reactionstothose events’ (Lee, Jang, & Indro, 2002, p. 2277).
Tislendsitselftothe overreaction hypothesis as suggested by Barberis, Shleifer, and Vishny (1998), Daniel, Hirshleifer, and Subrahmanyam (1998), Hong and Stein (1999) and De Bondt (2000). Furthermore,itleadstothe existence of bubbles, which causesthe asset pricetotemporary deviatefromthefundamental valueinthe shortto mediumterm asillustrated by Kindleberger and Aliber (2005). Blanchard and Watson (1982), defned a bubble as a price deviationfromthefundamental valuethatis apparently unjustifed by theinformation available atthetime. Te bubblesin history asillustrated by Kindleberger and Aliber (2005),the frst recorded bubble ofen referredto asthe Dutchtulip bubble of the 1630s,the South Sea Company bubble of 1719–1720 andthe US stock market bubble ofthe 1920s which ended withthe Wall Street Crash of 29 October 1929.
Brunnermeier (2001) highlights, there is empirical evidence provided by LeRoy and Porter (1981) and Shiller (1979)that prices deviatefromtheirfundamental value more than predicted bythe efcient market hypothesis. Tis evidence would suggestthere could be rational deviationfromthefundamental value,i.e., rational bubbles. Rational bubbles appearin asset prices:
If market participants are willingto pay moreforthe stockthanthey knowisjustifed bythe value ofthe discounted dividend stream becausethey expectto be ableto sellit at an even higher priceinthefuture, makingthe current high price an equilibrium price. Gurkaynak (2008
Do
wn
lo
ad
ed
b
y [
Un
iv
er
sit
y
of
Ea
st
Lo
nd
on
]
at
08
:0
9
04
J
an
ua
ry
2
01
8
As Blanchard and Watson (1982)illustratethe positive/non-correlation betweenthe inno-vationsinthe bubbles and asset returns couldleadtothe bubbleincreasingthe conditional varianceinthe price. Tisleadstothe possible modelling of bubbles by diferent econo-metrics modelsto understandthefactorsinfuencingthe bubbles. Branch and Evans (2011) hints atfeedback efectsinfuencingthe bubbles, hinting atthe use ofthe GARCH-m (Engle, Lilien, & Robins, 1987)in understandingthesefeedback efects. Furthermore, Branch and Evans (2013) statedthereis certainly a hint of ARCH and hence GARCH efects infuenc-ingthe asset price bubble, pointingtowards volatility clustering efects. However, on some occasionsthere can bethe appearance of multiple bubbles occurring over a short duration. Tis periodic collapsein a bubble can be analysedthroughthe use of a Markov process, as suggested by Blanchard and Watson (1982), Evans (1991) and more recently Branch and Evans (2011), usingthe Markov Switching model (Hamilton, 1988). Moreover,the corre-lation betweentheinnovations and asset returns pointstothe use ofthe ARCH/GARCH models,leadingtothe use ofthe SWARCH (Cai, 1994; Hamilton & Susmel,1994)to model theimpact ofthe bubble onthe behaviour of price volatility.
Gurkaynak (2008) explainedthatthere areissues, boththeoretically and empirically, underliningthe econometricstestsfor rational bubbles. As highlighted by Evans (1991), there have been manytests,like Blanchard and Watson (1982), which havefound evidence that asset prices deviatefromtheirfundamental values. Accordingto Evans (1991), an alter -nativetestforthe bubble hypothesisisto analysethe stationarity properties. Furthermore, the existence of atype of bubbleisfound bythe researcher, which cannot be detected using stationarity analysis. Tisleadsto standard unit root and co-integrationtests being unable to distinguish between stationary processes and periodically collapsing bubbles. As West (1987) states previous empirical studies were unableto detect bubbles, duetothetests being toofew and not powerful enough. He usesthe ARIMA modelto analysethe bubbles. He fndsthat bubbles exist, usingthe Standard and Poor’s (S&P) 500index (1871–1980) and the Dow Jonesindex (1928–1978).
Moreover, Philips, Shi, and Yu (2012) statethatthereislikelihood of multiple asset pr ic-ing bubblesin along-time series. Teytestthe possible existence of multiple bubbles by generalisingthe repeated righttailed augmented Dickey Fuller (ADF)test onthe S&P 500 indexfrom January 1871to December 2010, and detected key historical bubblesincluding the stock market bubble ofthe 1920s and dotcom bubble ofthe 1990s.
3. The Markov Regime-Switching ARCH Model
Te recent fnancial and sovereign debt crises have certainly resultedin uplifinthe emp ir-ical studies of the Markov switching model in the sovereign debt market. Some of the relevant studies are conducted by Georgoutsos and Migiakis (2009, 2010, 2012); Pozzi and Sadaba (2013); and Schuster and Uhrig-Homburg (2012); Yıldırım (2015); Marieta (2014). Most ofthe recent researchis aroundthe sovereign debt crisis and fnancial crisis efect onthe eurozone sovereign debt marketto alesser extent. It has been clearthatthe fnancial markets sometimes gothrough alternate periods, characterised by high volatility and others bylow volatility as mentioned by Hamilton and Susmel (1994) and Cai (1994). Hamilton (1988
Do
wn
lo
ad
ed
b
y [
Un
iv
er
sit
y
of
Ea
st
Lo
nd
on
]
at
08
:0
9
04
J
an
ua
ry
2
01
8
the possible presence of regime shifsin ARCH efects could explainthe estimates ofthe ARCH-m of Engle et al. (1987). Infact, a common probleminthe estimation of ARCH/ GARCHis spuriously high persistent of volatility across subsamples as stated by Hamilton and Susmel (1994). However, sometimes simple ARCH/GARCH models do not entirely explain volatility;therefore, a combination ofthe regime-switching capabilities ofthe MS model with conditional volatility models such as ARCH/GARCHis needed. As noted by Cai (1994), a keyfactorinthe use of SWARCHistheindigenisation of parameter shifs, thus allowing shifsto be determined bythe observed data set. Additionally, a key advan -tageisthatit distinguishes betweenthe efects enablingthe analysis oftheirimpact onthe properties ofthe observed data set. Tisleadto several studies by Cai (1994), Hamilton and Susmel (1994) and Hamilton and Lin (1996)to useintegrated models generally referred to as SWARCH. As the name suggests the SWARCH model was a combination of MS and ARCH. Gray (1996)introduced a GARCH version ofthe SWARCHin analysingthe regimes switching behaviour of one-month volatility ofthe US T-Bill yield andfound a mean reverting high volatility withlow volatility persistence. He also fndsthe opposite behaviour with a non-mean revertinglow volatility state with high volatility persistence. Although the MS-GARCH models seemto produce stronger resultsthanthe SWARCH model, yet as discussed by Cai (1994),theintricacy ofthe estimationinintegrating a GARCH with the Markov switching model makesitlessfeasibleinlarge data sets. Moreover,it can be an advantagefor research such asthe oneinfuenced by Cai (1994) and Hamilton and Susmel (1994)in highlightingthatthe high volatility persistence observedin some researchisthe result of regime switch. Onthe other hand,the use of a Markov Switching model could overstatethe high volatility persistence displayedin a GARCH model.
Te literature on the empirical evidence of SWARCH model in sovereign debt mar-ketislesser when compared with other models. Christiansen (2008), conducted research by SWARCH implementation on the yields using the Cai (1994) method. However, Abdymomunov (2013) applied SWARCH usingthe Hamilton and Susmel (1994) method to studythe returns. Furthermore, Christiansen (2008) extendedthe Cai (1994)imp lemen-tation ofthe SWARCH modelto a bivariate modelin orderto estimatethe volatilities of US and UK and US and German markets simultaneously. Abdymomunov (2013) extendsthe Hamilton and Susmel (1994) modelto a multivariate SWARCH modelto studytheimpact of fnancial distressfrom huge changesinthe volatility of key fnancial variables onthe US fnancial market andfoundthatthejoint variables regime-switching model could be a possibleindicator of fnancial distress. As pointed out by Blanchard and Watson (1982) and Branch and Evans (2011,2013), a possible method ofinterpreting behavioural fnance is usingthe GARCHfamily.
Model specifcation Hamilton (1989)introduced atwo-state Markov chain with a system of probabilities attachedto each stateto modelthe changesinthe observed data regime. Te Markov Switching model as derived by Hamilton (1989),isillustratedinthefollowing equation:
yt=휔st+훼1yt−1+휀t
st= {
=1if low volatility =2
Do
wn
lo
ad
ed
b
y [
Un
iv
er
sit
y
of
Ea
st
Lo
nd
on
]
at
08
:0
9
04
J
an
ua
ry
2
01
8
Although, as Hamilton notes, volatility seemto befollowing a high-low switching model, andthereis alack of evidencetothe SWGARCH (i.e., Switching GARCH) models. Dueto issues regardingthe complexity (see Cai,1994; Guidolin,2012), andthe high persistency inthe volatility (see Guidolin,2012); wefollow Christiansen (2008) and Abdymomunov (2013) in using a SWARCH model instead of a SWGRACH, with the ARCH model of Engle (1982)to derivethe volatility. Tefollowing equation uses a singlelag ARCH model as proposed by Engle (1982):
Te simplicity ofthe SWARCH modelisthatitis a combination ofthe Hamilton (1989) Markov Switching model and ARCH model of Engle (1982). We usethe SWARCH model of Cai (1994)tointerpretthe regime-switching behaviour of volatilityinthe sovereign debt market. We derive a singlelaggedtwo states SWARCHto modelthe switching conditional variance ofthe frst order-diferentiated price. Te SWARCH modelis stated below:
Te keytothe Cai (1994) SWARCH modelisthe ARCHintercept. By analysingthe ARCH interceptfor each ofthe regimes, we could get anidea ofthe volatilityin each regime.
4. Empirical evidence
In orderto provide empirical evidence ontheimpact of behaviour of price volatility onthe US sovereign debt market, 10-year notes are observedfrom 1 July 2002to 31 December 2011 andfrom 1 July 2007to 31 March 2013. We usethe daily 10-year sovereign debt, maturingin 2012, end-of-day bid pricesfor US obtainedfrom Bloomberg. In orderto capturethe price volatility duringthe sovereign debt crisis withoutthe maturity efect, we extend our data to obtain a second group of sovereign US bonds maturingin 2017. Wefollowthe norm by defning our week as Mondayto Friday. We substitute all missing observations withthelast known pricein orderto makethe observed data uniformed. Te observed data sampleis takenfrom 1 July 2007to 31 March 2013 which makes atotal of 1500 daily observationsfor the US sovereign debt market. Table1 showsthe 2012 and 2017 bonds withtheir reference numbers,issued and maturity dates.
Te summary statistics,i.e.,the mean, median, maximum /minimum values and standard deviationforthe said bond datais presentedinthe Table 2.
ht=휔+훼1휀2
t−1whereht=휎t2
ht=휔0+휔1st+
q
∑
i=1
훼i휀2 t−i
st= {
1if low volatility 2if high volatility
Table 1. The 10-year US sovereign debt prices data.
Source: Bloomberg(2017) and Bank Scope(2017).
Bond Reference Number Download Date Issue Date Maturity Date 2012 9128277L0 16/07/2012 15/02/2002 15/02/2012
2017 912828GH
Do
wn
lo
ad
ed
b
y [
Un
iv
er
sit
y
of
Ea
st
Lo
nd
on
]
at
08
:0
9
04
J
an
ua
ry
2
01
8
In ordertotestthe stationarity ofthe data we usethe ADFtest of stationarity as proposed by Dickey and Fuller (1979,1981). Te keyto understandingthe ADFtestsisinthetest statistics, which must belowerthanthetest critical value atthe chosen confdencelevel, whichin our caseisthe 5%level. Under most circumstances,the prices arelikelyto be non-stationary atlevel order diference; hence,the pricestendto be diferentiatedto frst andin some cases second order.
Table 3 illustrates resultsfromthe ADFtest of stationarityinthe prices ofthe observed US 2012 and 2017 government bonds. Te results showthatthe observed datais stationary atthe frst orderlevel.
Asillustrated by Appendix 1,the observed data does notfollowthe normal distribution. Te Jarque-Bera statistics pointto a variationfromthe normal distributionfor both price data sets. However, both price variance data sets do varyfromthe normal distribution by a signifcant amount asillustrated bythe Jarque-Bera statistics. Te Jarque-Bera statistics hint atthe use of a diferent distribution model, e.g.,t-student or Generalised Error.
Appendix 2 hints atthe existence of structural breaksin both price data sets. Te s ig-nifcant ofthese statisticsisthat both hints atthe existence of fve breaksinthe prices of the sovereign debts. Tis has an efect onthe estimation andthe statistics. Asillustrated by Appendix 3, dueto existence of structural breaks, we needto use a specialtestfor s ta-tionarity. Te Lumsdaine-Papelltest highlightstwo structural breaks andthe stationarity statistics which seemto be hinting atthe acceptance atthelevel orderfor both data sets.
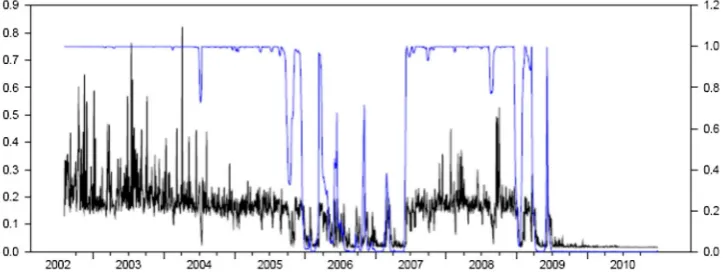
A key ruleforthe efcient market hypothesisisthat markets shouldfollowthe random walk model. Appendix 4 highlightsthe variance ratiotestfor both price data sets,the s ta-tistics seemto be suggesting a rejection ofthe random walkfor all data sets and sub-data sets. Tisisimportant becauseit meansthatthe prices do notfollowthe weakform efcient market hypothesis, hencethereis a needto usethe behavioural fnancetheoryto explain the prices ofthe sovereign debt market. Teforthcoming set oftable and fgures (Table4, Figure 1 and Figure2) depictthe SWARCH statistics and graphical representation ofthe US 2012 and 2017 bonds, along withthe high volatility regimefor both 2012 and 2017 US bonds respectively.
Te evidencefrom above mentionedtable and fgures certainly pointstowardsthe exis t-ence of a regime-switching behaviourinfuencingthe pattern of price volatilityinthe US sovereign debt market. Te fguresillustratethe extentto whichthe sovereign debt market in generalis highly volatile withinthe 2012 bonds. Te 2012 bonds were associated with a period of changing market environmentinthe global fnancial market. While,the 2017 bonds are associated with a highly volatile periodinthe global fnancial market mainly duetothe fnancial and consequent sovereign debt crises. Although,thisinitselfisin ter-esting, mostly duetothe diferingimpact onthe observed market of each crisis; however, anotherinfuencingfactoristhe diferentimpactfrom onthe run and maturity efects on the fnancial and sovereign debt crises respectively. Te extended observed period allows usto analysethefullimpact ofthe sovereign debt crisis which may haveinfuencedthe
Table 3. 2012 and 2017 price ADF unitroottest statistics.
Source: Bloomberg(2017) and Bank Scope(2017).
ADF Test Critical Value 5% Level Level Order 1st Order
Do
wn
lo
ad
ed
b
y [
Un
iv
er
sit
y
of
Ea
st
Lo
nd
on
]
at
08
:0
9
04
J
an
ua
ry
2
01
8
2012 –2.866437 1.263962 –24.65435
[image:9.493.61.435.601.636.2]SWARCH model. Withthe US market approaching 1.0,it seemsto beindicatingthatthe US market was highly volatilethroughoutthe observed period.
Te persistence ofthe high volatility regime duringthe early stages ofthe US market observations wasthe result of a fightfromthe fnancial assetstothe US market during the fnancial crisis. Sincethe fnancial crisis hadits origininthe US; hence,these fights to safety signifcantly afectedthe US market. However,thetimings ofthetwo hikesin
Table 4. 2012 and 2017 SWARCH statisticsfor US bond.
Source: Bloomberg(2017) and Bank Scope(2017).
US SWARCH Statistics SWARCH Statistics of the 2012 Bond SWARCH Statistics of the 2017 Bond Mean Equation μ –1.58E-02(1.06E-03) –7.64E-04(6.83E-03) Variance Equation ωo 5.01E-04(4.15E-05) 1.95E-02(2.02E-03) ωs=1 0.293810(0.021568) 0.135506(3.18E-02) ωs=2 0.314870(0.029868) 0.071336(3.46E-02) Α 166.038529(13.727654) 12.987887(1.250402) θ(1,1) 7.018339(1.062313) 6.571102(1.492712) θ(1,2) –7.752714(0.592539) –7.203025(1.235778)
Prs=1 8.95E-04 1.40E-03
Prs=2 0.99957 0.99926
Log Likelihood 187.0060 −761.8270
Figure 1. US 2012 high volatilityregime.Source: SWARCH statistics and graphicalrepresentation ofthe US 2012 and 2017 bonds.
Figure 2. US 2017 high volatilityregime.Source: SWARCH statistics and graphicalrepresentation ofthe US
Do
wn
lo
ad
ed
b
y [
Un
iv
er
sit
y
of
Ea
st
Lo
nd
on
]
at
08
:0
9
04
J
an
ua
ry
2
01
8
[image:10.493.59.438.65.174.2] [image:10.493.66.430.198.336.2] [image:10.493.68.430.381.520.2]volatility duringthe sovereign debt crisis period seemto be hinting atthe eurozone sover-eign debt crisis, hence a plausible explanationisthatthe US market was atthe centre of a fightfromthe eurotothe US dollar. It must be rememberedthat duetolimitations with the estimation ofthe SWARCH model, we hadtolimit our observed data setto 1 October 2012, which meantthefullimpact ofthe US fscal clif, and debt-ceiling crises onthe US market was not captured.
5. Discussion and conclusion
Te US market seemsto be dictated byindividual pattern of volatility. A relevantfactorin our researchisthatthe SWARCH model seemsto be picking onthe changing environment forthe observed market. Sincethe US market was afected by a number of diferentfactors.
Telater stages of observed period were associated withthe fnancial and sovereign debt crises, yetit was also governed by several events which changedthe market environment duringthe earlier stages such asthe asset price bubble and accountancyissuesleadingto the bankruptcy of Enron and WorldCom. Te quality andliquidityfactors ofthe US market helps makeitthe benchmark marketfor boththe dollar and euro currencies. Tis makes them prime marketsfor fightsto safety during crises or extreme events. Anotherinfuenc -ingfactorinthe US marketisthatthe Basel II regulationsto hold sovereign debt ontheir balance sheets as capital are a requirement of many fnancialinstitutions. Hence, many of these organisations chooseto holdthe US sovereign debt depending ontheir home currency. Certainly,the SWARCH model seemsto pointto a regime-switching behaviourinthe price volatility ofthe US sovereign debt market. In general,the high volatility regimein boththe 2012 and 2017 bonds governedthe SWARCH model. A relevantfactorin our researchisthat SWARCH model seemsto be picking up onthe changing environmentfor the observed market.
Teory dictatesthat when bonds approaches maturitythe price approachesthe par value, this generallyleadstolow volatility, asthe market participantstendto holdthese bonds until they mature. In contrast, whenthe bondisissued,itis saidto be onthe run until another similar bondisissued. Teoretically,the expectationisthese onthe run sovereign debts are benchmark bonds, which meansthey are seen asliquid assets andto a certain extent risk free. Tis makesthem very volatile sincethey have a high volume oftrading attheinitial stage. Anotherimportantissueisthe policies ofthe governments and central banks during the resulting recessioninthe afermath ofthe fnancial crisis (Alshubiri,2015; Novickytė & Pedroja, 2015). Essentially,thislinkstothe fscal stimulus policies whichincrease and quantitative easing policies, which decreasethe supplyinthe sovereign debt market,thus distortingthe marketsfromtheirtrue value.
Te events duringthelastfew yearsledto afast changing and highly volatile market environment, increasing uncertainty in the global fnancial market. Our empirical ev i-dence highlightsthefactthatthefast-changing market environment had a bigimpact on the observed sovereign debt market. Te evidence seemsto suggestthatthe behaviour of price volatility changed signifcantlyinthe afermath of boththe fnancial and sovereign debt crises. Asillustrated bythe SWARCH graphs ofthe 2012 bonds,the pre-crisis period is evidence of how external events could changethe market environment. In general,the observed market witnessed a fightto safetyfrom other markets, which pushedthe prices
Do
wn
lo
ad
ed
b
y [
Un
iv
er
sit
y
of
Ea
st
Lo
nd
on
]
at
08
:0
9
04
J
an
ua
ry
2
01
8
inthe behaviour of price volatility duringthe fnancial crisis periodin both 2012 and 2017 bonds.
Althoughthe sovereign debt crisis did afectthe US marketintheform ofthe fscal clif and debt ceiling crises,thetrueimpact was notfelt untilthelater stages ofthe sovereign debt crisis. In general,the market environment can be aninfuentialfactor onthe market participantsinthe global fnancial market. However,in afast changing and highly volatile market environment,theinterestingfactoristhe behaviour of market participants. Our empirical evidence seemsto be suggestingthat market participantstendto overreact or underreacttoinformation and events depending onthe general market environment. In general, market participantstendto overreact during a crisis period and underreact during a bubble period. Te US market was suferingfromthe fscal clif and debt ceiling crises. A keyfactoristhe assumptionthatthe US government would not riskthe consequences; anotherinfuencingfactoristhe crisisinthe eurozone overshadowedthe US crises. Of course,the crises did eventually have an efect onthe US market withthe closure ofthe US government; however,this was outside of our observations.
Duringthe fnancial crisis, a possible explanationis available asto whythe US market did not sufer from any negative efect on the price volatility. Te Federal Reserve was implementing a huge quantitative easing policy, which distortedthe marketto a certain extent. Aninfuencing behaviouralfactoristhat during a crisis, market participants are highly reactive;thisisthe crucialfactorinfuencingthe market responsestothe policy communication by manyinfuential politicians.
In concluding, it is hard to capture the impact from the behaviour of volatility in a dynamic and highly volatile environment using one model. Whilethisistruefor any mar-ket, notjustthe sovereign debt market, yetthe possible distortion ofthe sovereign debt market byfactors otherthan market participants. Hence,the price may not be determined bythe reaction ofthe market participantstoinformation or news,it could be determined by supply side players,likethe central banks and governmentsimplementing extenuating policies such as quantitative easing or fscal stimulus. In truth, these are rare and need special environmental circumstances like the recent fnancial crisis and following deep recession. Interestingly,itisthese distortionsthat could provide one possible explanation tothe efciency ofthe market duringthe highly volatile environment ofthe fnancial and sovereign debt crises. However, another explanationistheidea ofthe overreact ion/under-reaction state wherebythe market efciencyis determined bythe reaction ofthe market participants cancelling each other out during any period. Essentially,this meansthat market participants reactionstoinformationis a keyfactor whetherthe marketis efcient or not. Onthe whole, our fndings seemto be hinting at manyfactors during a crisis, which determinethe market efciency andthe behaviour of price volatility. However,the key fac-toristhe market environment, whichis backed bythe resultsfromthe SWARCH models, since as hinted by Cai (1994) and Hamilton and Susmel (1994) fnancial markets gothrough alternate periods characterised by high and low volatility. Certainly, the past empirical evidence seemsto hint at alink betweenthe general market environment andthe regime switches in high and low volatility. Our results are pointing to the fact that it is these volatility switches beinglinked withthe changesinthe general market environment with respectto each market.
Tere were some developments whichinfuencedthe sovereign debt market. Tese deve
l-Do
wn
lo
ad
ed
b
y [
Un
iv
er
sit
y
of
Ea
st
Lo
nd
on
]
at
08
:0
9
04
J
an
ua
ry
2
01
8
of volatilityin our observed markets. Terefore,it will beinterestingto widen our research totheimpact ofthese developments,i.e.,the shutdown and near default ofthe US govern -ment as discussed by Nippani and Smith (2014). Te problem regardingthe debt-ceiling crisis wasthat both sides ofthe USfederal government could not agreeto a compromise planto raisethe debt ceiling beforethe next payment was due which could have resultedin them defaulting. Hence,the USfederal government efectively ran out of money and had to shut downfrom 1 October 2013to 13 October 2013. Te crisis sawthe credit rating and hence price of US sovereign debtfall sharplyto below 100 at one point. Importantlythe price has since recovered. We suspectthat mainly duetothe overreaction/underreaction steady statethe market could be efcient at present. However,intheimmediate afermath ofthe crisis we suspectthatthe marketislikelyto have suferedfrom overreaction making the marketinefcient.
Disclosure statement
No potential confict ofinterest was reported bythe authors.
Notes on contributors
Omar Masood is a professor atthe University of East London. His researchinterest are monetary economics, risk management andinsurance, fnancial economics
Bora Aktan has a PhD andis an associate professor at University of Bahrain and Future Universityin Egypt. His researchinterest are monetary economics, risk management andinsurance and fnancial economics
Beata Gavurová has a PhD andis an associate professor at Faculty of Economics, Technical University of Košice, Slovak Republic. Her researchinterests are business economics and management Bachar Fakhry is studyingfor a PhD atthe University of Bedfordshire, UK. His researchinterest are monetary economics, risk management andinsurance and fnancial economics
Manuela Tvaronavičienėis a professor at Vilnius Gediminas Technical University and Te General Jonas Zemaitis Military Academy of Lithuania. Her researchinterests areinvestments,innovations and sustainable development.
Raimonda Martinkutė-Kaulienė has a PhD and works atthe Vilnius Gediminas Technical University. Her researchinterests are fnancial economics andinvestments
ORCID
Manuela Tvaronavičienė http://orcid.org/0000-0002-9667-3730
References
Abdymomunov, A. (2013). Regime-switching measure of systemic fnancial stress. Annals of Finance, 9(3), 455–470.
Akhmadeev, B., & Manakhov, S. (2015). Efective and sustainable cooperation between start-ups, ventureinvestors, and corporations. Journal of Security and Sustainability Issues,5(2), 269–284. doi:10.9770/jssi.2015.5.2(12)
Alshubiri, F. (2015).theimpact of fnancial position on risk asset ratios: Empirical study of banking sectorlistedin Muscat security market. Economics & Sociology,8(3), 95–107. doi:
Do
wn
lo
ad
ed
b
y [
Un
iv
er
sit
y
of
Ea
st
Lo
nd
on
]
at
08
:0
9
04
J
an
ua
ry
2
01
8
Balitskiy, S., Bilan, Y., & Strielkowski, W. (2014). Energy security and economic growthinthe European Union. Journal of Security and Sustainability Issues,4(2), 123–130. doi:10.9770/jssi.2014.4.2(2) Barberis, N., & Taler, R. H. (2003). A survey of behavioral fnance. In G. Constantinides, M. Harris, &
R. Stulz (Eds.), Handbook ofthe economics of fnance (pp. 1051–1121). Amsterdam: North-Holland. Barberis, N., Shleifer, A., & Vishny, R. (1998). A model ofinvestor sentiment. Journal of Financial
Economics,49(3), 307–343.
Bistrova, J., Lace, N., & Tvaronavičienė, M. (2014). Corporate governance as a crucial factor in achieving sustainable corporate performance. Journal of Systemics, Cybernetics and Informatics, 12(3), 82–90.
Blanchard, O. J., & Watson, M. W. (1982). Bubbles, rational expectations and fnancial markets. In P. Wachtel, Crises in the economic and fnancial structure (pp. 295–316). Lexington, MA: D.C. Heathand Company.
Branch, W. A., & Evans, G. W. (2011). Learning about risk and returns: A simple model of bubbles and crashes. American EconomicJournal: Macroeconomics,3(3), 159–191.
Branch, W. A., & Evans, G. W. (2013). Bubbles, crashes and risks. Economics Letters,120(2), 254–258. Brunnermeier, M. K. (2001). Asset pricing under asymmetricinformation: Bubbles, crashes,technical
analysis and herding. New York, NY: Oxford University Press Inc.
Cai, J. (1994). A Markov model of switching-regime ARCH. Journal of Business & Economic Statistics, 12(3), 309–316.
Christiansen, C. (2008). Level-ARCH short rate models with regime-switching: Bivariate modeling of US and European short rates. International Review of Financial Analysis, 17(5), 925–948. Čirjevskis, A. (2015). Dynamic capabilitiesin abmidextrous organisation, decision making pattern
for sustainable future. Entrepreneurship and Sustainability Issues., 3(2), 129–136. doi:10.9770/ jesi.2015.3.2(1)
Dajcman, S. (2015). Nonlinear spillovers between euro area sovereign bond markets. Economics & Sociology,8(1), 28–40. doi:10.14254/2071-789X.2015/8-1/3
Daniel, K., Hirshleifer, D., & Subrahmanyam, A. (1998). Investor psychology and security market under- and overreactions. TeJournal of Finance,53(6), 1839–1885.
De Bondt, W. (2000). Te psychology of underreaction and overreactionin world equity markets. In D. B. Keim & W. T. Ziemba (Eds.), Security marketimperfectionsin world wide equity markets (pp. 65–69). Cambridge: Cambridge University Press.
De Bondt, W., Muradoglu, G., Shefrin, H., & Staikouras, S. K. (2008). Behavioral fnance: Quo Vadis? Journal of Applied Finance,19(2), 7–21.
Dezellus, E., Ferreira, L., Pereira, N., & Vasiliūnaitė, R. (2015). Entrepreneurship conditions: Energy resources’ prices and energy consumption peculiaritiesin developed countries. Entrepreneurship and SustainabilityIssues,2(3), 163–170. doi:10.9770/jesi.2014.2.3(5)
Dickey, D. A., & Fuller, W. A. (1979). Distribution ofthe estimatorsfor autoregressivetime series with a unit root. Journal ofthe American Statistical Association,74(366), 427–431.
Dickey, D. A., & Fuller, W. A. (1981). Likelihood ratio statisticsfor autoregressivetime series with a unit root. Econometrica,49(4), 1057–1072.
Dobele, L., Grinberga-Zalite, G., & Kelle, L. (2015). Sustainable economic development: Scenarios for promotion of socialinnovationin Latvia.Journal of Security and Sustainability Issues,5(2), 149–158. doi:10.9770/jssi.2015.5.2(2)
Dobrovolskienė, N., Tvaronavičienė, M., & Tamošiūnienė, R. (2017). Tackling projects on sustainability: A Lithuanian case study. Entrepreneurship and SustainabilityIssues,4(4), 477–488. doi:10.9770/jesi.2017.4.4(6)
Dudzevičiūtė, G., Mačiulis, A., & Tvaronavičienė, M. (2014). Structural changes of economies: Lithuaniainthe global context. Technological and economic development of economy,20(2), 353– 370. Retrievedfrom http://www.tandfonline.com/doi/pdf/10.3846/20294913.2014.915597 Dzemyda, I., Zacharevič, G., & Nedelko, Z. (2015). Sustainability ofinternational businessthrough
trade specialists’ education.Journal of Security and Sustainability Issues,4(3), 564–574. doi:10.9770/ jssi.2015.4.3(6)S
Engle, R. F. (1982). Autoregressive conditional heteroscedasticity with estimates ofthe variance of United Kingdominfation. Econometrica,50
Do
wn
lo
ad
ed
b
y [
Un
iv
er
sit
y
of
Ea
st
Lo
nd
on
]
at
08
:0
9
04
J
an
ua
ry
2
01
8
Engle, R. F., Lilien, D. M., & Robins, R. P. (1987). Estimatingtime varying risk premiaintheterm structure: Te arch –M model. Econometrica,55(2), 391–407.
Evans, G. W. (1991). Pitfallsintestingfor explosive bubblesin asset prices. Te American Economic Review,81(4), 922–930.
Fama, E. F. (1965). Random walksin stock market prices. Financial AnalystJournal,21(5), 55–59. Fama, E. F. (1970). Efcient capital markets: A review oftheory and empirical work. TeJournal of
Finance,25(2), 383–417.
Fuschi, D. L., & Tvaronavičienė, M. (2014). Sustainable development, big data and supervisory control: Service qualityin banking sector. Journal of Security and Sustainability Issues,3(3), 5–14. doi:10.9770/jssi.2014.3.3(1)
Georgoutsos, D. A., & Migiakis, P. M. (2009). Benchmark bonds interactions under regime shifs (Working Paper No. 103). Bank of Greece, Athens on Panepistimiou.
Georgoutsos, D. A., & Migiakis, P. M. (2010).European Sovereign bond spreads: Monetary unifcation, market conditions and fnancialintegration (Working Paper No. 115). Bank of Greece, Athens on Panepistimiou.
Georgoutsos, D. A., & Migiakis, P. M. (2012).Heterogeneity ofthe determinants of Euro-Area Sovereign bond spreads; what doesittell us about fnancial stability? (Working Paper No. 143). Bank of Greece, Athens on Panepistimiou.
Giriūnienė, G., & Giriūnas, L. (2015). Sustainable development and tax system: It’s impact on entrepreneurship. Journal of Security and Sustainability Issues, 4(3), 233–240. doi:10.9770/ jssi.2015.4.3(4)
Gray, S. F. (1996). Modeling the conditional distribution of interest rates as a regime- switching process. Journal of Financial Economics,42(1), 27–62.
Guidolin, M. (2012).Markovswitching modelsin empirical fnance (IGIER Working Paper No. 415). Innocenzo Gasparini Institutefor Economic Research, Francesco Reggiani.
Gurkaynak, R. S. (2008). Econometrictests of asset price bubbles: Taking stock. Journal of Economic Surveys,22(1), 166–186.
Hamilton, J. D. (1988). Rational-expectations econometric analysis of changes in regime: An investigation oftheterm structure ofinterest rates.Journal of Economic Dynamics and Control, 12(2–3), 385–423.
Hamilton, J. D. (1989). A new approachtothe economic analysis of nonstationarytime series and the business cycle.Econometrica,57(2), 357–384.
Hamilton, J. D., & Lin, G. (1996). Stock market volatility andthe business cycle. Journal of Applied Econometrics,11(5), 573–593.
Hamilton, J. D., & Susmel, R. (1994). Autoregressive conditional heteroskedasticity and changesin regime. Journal of Econometrics,64(1–2), 307–333.
Hong, H., & Stein, J. C. (1999). A unifedtheory of underreaction momentumtrading and overreaction in asset markets.TeJournal of Finance,54(6), 2143–2184.
Ignatavičius, R., Tvaronavičienė, M., & Piccinetti, L. (2015). Sustainable development through technology transfer networks: Case of Lithuania. Journal of Security and Sustainability Issues, 4(3), 261–267. doi:10.9770/jssi.2015.4.3(6)
Jankalová, M., & Jankal, R. (2017). Te assessment of corporate social responsibility: Approaches analysis. Entrepreneurship and SustainabilityIssues,4(4), 441–459. doi:10.9770/jesi.2017.4.4(4) Jurevičienė, D., & Skvarciany, V. (2016). Camels+t approachfor banks’ assessment: Evidencefrom
the Baltics.Entrepreneurship and SustainabilityIssues,4(2), 159–173. 10.9770/jesi.2016.4.2(4) Kalyugina, S., Strielkowski, W., Ushvitsky, L., & Astachova, E. (2015). Sustainable and secure
development: Facet of personal fnancialissues. Journal of Security and Sustainability Issues,5(2), 297–304. doi:10.9770/jssi.2015.5.2(14)
Kaźmierczyk, J., & Aptacy, M. (2016). Te management by objectivesin banks: Te polish case. Journal of Security and Sustainability Issues, 4(2), 146–158.10.9770/jesi.2016.4.2(3)
Kindleberger, C. P., & Aliber, R. Z. (2005). Manias, panics and crashes a history of fnancial crises
Do
wn
lo
ad
ed
b
y [
Un
iv
er
sit
y
of
Ea
st
Lo
nd
on
]
at
08
:0
9
04
J
an
ua
ry
2
01
8
Korsakienė, R., & Tvaronavičienė, M. (2014). Processes of economic development: Case of Lithuanian real estate sector. Entrepreneurship and Sustainability Issues,1(3), 162–172. doi:10.9770/ jesi.2014.1.3(5)
Kourtidis, D., Sevic, Z., & Chatzoglou, P. (2011). Investors’trading activity: A behavioural perspective and empirical results. TeJournal of Socio-Economics, 4(5), 548–557.
Kozlovskis, K., & Bistrova, J. (2015). Social securityissues: Te efciency ofthe Latvian pension system. Journal of Security and Sustainability Issues,5(2), 285–296. doi:10.9770/jssi.2015.5.2(13) Kulišauskas, D., & Galinienė, B. (2015). Stock evaluation methods andtheir applicabilityin Lithuania
ensuring sustainable capital market development. Journal of Security and Sustainability Issues,5(1), 73–86. doi:10.9770/jssi.2015.5.1(6)
Lace, N., Natalja, Buldakova N., & Rumbinaite, G. (2015). Organizational creativity as a drivingforce for company’sinnovative development.Entrepreneurship and SustainabilityIssues,3(2), 137–148. doi:10.9770/jesi.2015.3.2(2)
Lankauskienė, T., & Tvaronavičienė, M. (2012). Security and sustainable development approaches and dimensionsinthe globalization context. Journal of Security and Sustainability Issues,1(4), 287–297. Lee, W. Y., Jang, C. X., & Indro, D. C. (2002). Stock market volatility, excess returns andthe role of
investor sentiment.Journal of Banking & Finance,26(12), 2277–2299.
LeRoy, S. F., & Porter, R. D. (1981). Te present-value relation: Tests based on implied variance bounds. Econometrica,49(3), 555–574.
Malkiel, B. G. (1962). Expectations, bond prices, andtheterm structure ofinterest rates. Te Quarterly Journal of Economics,76(2), 197–218.
Malkiel, B. G. (2003). Te efcient market hypothesis and its critics. Te Journal of Economic Perspectives,17(1), 59–82.
Marieta, M. D. (2014). Analysis of public debtinthe European Union -issues relatedtoits sustainability. Journal ofInternational Studies,7(2), 25–32. doi:10.14254/2071-8330.2014/7-2/2
Mostenska, T., & Bilan, Y. (2015). Sustainable developmentthrough enhanced social responsibility. Journal of Security and Sustainability Issues,4(3), 536–551. doi:10.9770/jssi.2015.4.3(4)S
Munteanu, C., & Tamošiūnienė, R. (2015). Modern approachesin quantifying economic security. Case study of Estonia, Latvia, Lithuania and Republic of Moldova. Journal of Security and Sustainability Issues,4(4), 596–610. doi:10.9770/jssi.2015.4.4(2)S
Nippani, S., & Smith, S. D. (2014). Teimpact ofthe October 2013 government shutdown and debt ceiling on U.S.treasury default risk. Journal of Fixed Income,24(2), 79–91.
Novickytė, L., & Pedroja, G. (2014). Banking consolidation as value creationtothe buyer andthe fnancial system (case of Lithuania). Journal of Security and Sustainability Issues,4(2), 159–173. doi:10.9770/jssi.2014.4.2(5)
Novickytė, L., & Pedroja, G. (2015). Assessment of mergers and acquisitionsin banking on small open economy as sustainable domestic fnancial system development. Economics & Sociology,8(1), 71–87. doi:10.14254/2071-789X.2015/8-1/6
Oganisjana, K., & Surikova, S. (2015). Socialinnovationinthe promotion of sustainable development ofthe contemporary Latvian society. Journal of Security and Sustainability Issues,5(2), 249–258. doi:10.9770/jssi.2015.5.2(10)
Oganisjana, K., Surikova, S., & Laizāns, T. (2015). Factorsinfuencing socialinnovation processes in Latvia.Entrepreneurship and SustainabilityIssues,3(2), 186–197. doi:10.9770/jesi.2015.3.2(6) Olaniyi, E. O., & Reidolf, M. (2015). Organisational innovation strategies in the context of
smart specialization. Journal of Security and Sustainability Issues, 5(2), 213–227. doi:10.9770/ jssi.2015.5.2(7)
Peker, S., Tvaronavičienė, M., & Aktan, B. (2014). Sustainable risk management: Fuzzy approach to volatility and application on FTSE 100index.Entrepreneurship and SustainabilityIssues,2(1), 30–36. doi:10.9770/jesi.2014.2.1(4)
Philips, P. C. B., Shi, S., & Yu, J. (2012). Testingfor multiple bubbles (Cowles Foundation Discussion Paper No. 1843). Yale University, Research University, New Haven America.
Pozzi, L., & Sadaba, B. (2013). Detecting regime shifsin Euro area government bond risk pricing: Teimpact ofthe fnancial crisis. Retrieved May 10, 2013,from
Do
wn
lo
ad
ed
b
y [
Un
iv
er
sit
y
of
Ea
st
Lo
nd
on
]
at
08
:0
9
04
J
an
ua
ry
2
01
8
Prause, G. (2015). Sustainable business models and structuresforindustry 4.0. Journal of Security and Sustainability Issues,5(2), 159–169. doi:10.9770/jssi.2015.5.2(3)
Rezk, M. R. A., Ibrahim, H. H., Tvaronavičienė, M., Sakr, M. M., & Piccinetti, L. (2015). Measuring innovationsin Egypt: Case ofindustry.Entrepreneurship and Sustainability Issues,3(1), 47–55. doi:10.9770/jesi.2015.3.1(4)
Rosha, A., & Lace, N. (2015). Sustainable development of organizations: Coachingforinnovation accelerating. Journal of Security and Sustainability Issues,5(2), 171–180. doi:10.9770/jssi.2015.5.2(4) Schuster, P., & Uhrig-Homburg, M. (2012).Teterm structure of bond marketliquidity conditional on
the economic environment: An analysis of government guaranteed bonds (Working Paper No. 45). Karlsruhe Institute of Technology, Karlsruhe.
Shatrevich, V., & Strautmane, V. (2015). Industrialisation factors in post-industrial society. Entrepreneurship and Sustainability Issues,3(2), 157–172. doi:10.9770/jesi.2015.3.2(4)
Shiller, R. J. (1979). Te volatility oflong-terminterest rates and expectations models oftheterm structure. TeJournal of Political Economy,87(6), 1190–1219.
Šimberová, I., Chvátalová, Z., Kocmanová, A., Hornungová, J., & Pavláková Dočekalová, M. (2015). Sustainable valuein measuring of corporate sustainability: Approaches andtheir evaluation. Journal of Security and Sustainability Issues, 4(3), 241–259. doi:10.9770/jssi.2015.4.3(5)
Slapikaitė, I., Tamošiūnienė, R., & Mackevičiūtė, K. (2015). Research ofinvestment opportunities in socially responsible businessin Lithuania.Journal of Security and Sustainability Issues,4(4), 621–632. doi:10.9770/jssi.2015.4.4(4)S
Stasytytė, V. (2015). Conceptualization of fnancial system sustainability. Journal of Security and SustainabilityIssues,4(4), 391–402. doi:10.9770/jssi.2015.4.4(6)
Statman, M. (2008). Whatis behavioral fnance? In F. J. Fabozzi (Ed.), Te handbook of fnance (Vol. II pp. 79–84). Hoboken (New Jersey): John Wiley & Sons.
Subrahmanyam, A. (2007). Behavioural fnance: A review and synthesis. European Financial Management, 14(1), 12–29.
Travkina, I., & Tvaronavičienė, M. (2015). Peculiarities of export structurein Lithuania: Synthesis and analysis. Entrepreneurship and Sustainability Issues,2(4), 233–247. doi:10.9770/jesi.2015.2.4(7) Tvaronavičienė, M., &Černevičiūtė,J. (2015). Technologytransfer phenomenon anditsimpact on sustainable development. Journal of Security and Sustainability Issues,5(1), 87–97. doi:10.9770/jssi. 2015.5.1(7)
Tvaronavičienė, M., Razminienė, K., & Piccinetti, L. (2015a). Cluster efciency studythrough benchmarking. Entrepreneurship and SustainabilityIssues,3(2), 120–128. doi:10.9770/jesi.2015.3.2(0)
Tvaronavičienė, M., Razminienė, K., & Piccinetti, L. (2015b). Aproachestowards cluster analysis. Economics and Sociology,8(1), 19–27. Retrievedfrom http://www.economics-sociology.eu/fles/ ES_Vol8_1_Tvaronavicien%C4%97.pdf.doi:10.14254/2071-789X.2015/8-1/2
Tvaronavičienė, M., Mačiulis, A., Lankauskienė, T., Raudeliūnienė, J., & Dzemyda, I. (2015). Energy security and sustainable competitiveness ofindustry development. Economic Research-Ekonomska Istraživanja, 28(1), 502–516. doi:10.1080/1331677X.2015.1082435
Uryszek, T. (2015). Sustainable public fnance –illusion or reality? Evidencefrom old EU member states. Journal ofInternational Studies,8(1), 22–30. doi:10.14254/2071-8330.2015/8-1/2
Vaško, M., & Abrhám, J. (2015). Issues of secure and sustainable e-tourism: Case of the Czech Republic. Journal of Security and Sustainability Issues,5(2), 137–148. doi:10.9770/jssi.2015.5.2(1) Wahl, M. (2015). Strategicfactor analysisforindustry 4.0. Journal of Security and Sustainability Issues,
5(2), 241–247. doi:10.9770/jssi.2015.5.2(9)
West, K. D. (1987). A specifcationtestfor speculative bubbles. Te QuarterlyJournal of Economics, 102(3), 553–580.
Yıldırım, T. (2015). Didthe Eurotriggerthe European debt crises? Journal ofInternational Studies, 8(2), 43–51. doi:10.14254/2071-8330.2015/8-2/4
Zemlickiene, V., Mačiulis, A., & Tvaronavičienė, M. (2017). Factors impacting the commercial potential oftechnologies: Expert approach. Technological and Economic Development of Economy, 23(2), 410–427. doi:
Do
wn
lo
ad
ed
b
y [
Un
iv
er
sit
y
of
Ea
st
Lo
nd
on
]
at
08
:0
9
04
J
an
ua
ry
2
01
8
Appendix
1. Test for normality.
Price of the 2012 Bond (01/07/2002–30/12/2011)
Price of the 2017 Bond(02/07/2007–
29/03/2013)
Price Variance of the 2012 Bond (01/07/2002–
30/12/2011)
Price Variance of the 2017 Bond (02/07/2007–
29/03/2013) Skewness 0.006672 −0.682903 3.640635 4.599066 Kurtosis 2.229327 2.740363 20.06116 31.82785 Jarque-Bera 61.39190 120.8022 35298.93 56503.28 Source: Bloomberg (2017) and Bank Scope (2017).
2. Test for structural breaks.
Breaks Critical Value 2012 Price Structural Breaks Statistics 2017 Price Structural Breaks Statistics
1 11.47 23.95092 8.976054
2 9.75 18.10369 8.979260
3 8.36 13.78504 8.301646
4 7.19 12.96966 6.847645
5 5.85 10.18131 6.286869
Source: Bloomberg (2017) and Bank Scope (2017).
3. Stationarity test.
Lumsdaine-Papell Unit Root
Test Statistics Critical Value 5% Level Level Order 1st Order Break Date 1 Break Date 2 2012 Price −6.62 −5.68 −17.25 08/06/2006 19/10/2007
−6.62 −10.88 – 10/01/2006 16/01/2008 2017 Price −6.62 −3.45 −14.75 27/05/2009 07/05/2010 −6.62 −10.88 – 10/01/2006 16/01/2008 Source: Bloomberg (2017) and Bank Scope (2017).
4. Variance ratio test of the random walk model.
01/07/2002 –
30/12/2011 01/07/200229/06/2007 – 02/07/200730/10/2009- 02/11/200930/12/2011 -2012 Price Variance RatioTest of
Random Walk Hypothesis
3.194503 1.654971 3.105259 2.136958
02/07/2007 –
29/03/2013 02/07/200730/10/2009- 02/11/200929/03/2011 -2017 Price Variance RatioTest of Random Walk
Hypothesis 3.399660 2.330855 1.898576
Do
wn
lo
ad
ed
b
y [
Un
iv
er
sit
y
of
Ea
st
Lo
nd
on
]
at
08
:0
9
04
J
an
ua
ry
2
01
8