2017 International Conference on Mathematics, Modelling and Simulation Technologies and Applications (MMSTA 2017) ISBN: 978-1-60595-530-8
Reliability Analysis of Dangerous Goods Transportation
Network in Container Terminals
Xiang-da LI, Yun PENG
*, Xiang-qun SONG, Ke LIU and Chuan LI
State Key Laboratory of Coastal and Offshore Engineering1, Dalian University of Technology, Dalian, 116023, China
*Corresponding author
Keywords: Container terminal, Dangerous goods Transportation network, Anylogic simulation, Reliability.
Abstract. With the increasing throughput of dangerous goods and the frequent occurrence of dangerous goods accidents, the transport network in a terminal is facing more and more serious security problems. Therefore, it is urgent to study the transport network reliability under dangerous goods safety accidents in order to improve the capacity of the terminal to deal with the dangerous goods accidents. On the basis of reliability theory and the container terminal operating process, the Anylogic simulation model of the dangerous goods transportation network is established and applied to the case studies. The simulation results show that the reliability of road network is related to the radius of the dangerous goods accident. With the increase of radius from 40m to 200m, the road network is seriously damaged, and the reliability is reduced from 0.49 to 0.05 consequently.
Introduction
With the increasing throughput of dangerous goods (DGs), frequent accidents of DGs have brought increasingly serious security problems to the terminal transportation network. For example, after an explosion accident occurred at a terminal warehouse in north of China, the roads in the port were seriously damaged, causing emergency rescue work difficult to carry out efficiently. As a result, heavy casualties were caused and direct economic losses reached 6.8 billion dollars. Therefore, there is an urgent need to study the reliability of the terminal transportation network under the safety accident of DGs so as to enhance the terminal's ability to deal with dangerous accidents.
Domestic and foreign research on terminal transportation network has focused on the road traffic flow in the terminal and the road capacity of the port. Cao and Liu [1,2] calculated the road capacity of the port based on the terminal road traffic characteristics. On the basis of survey data, Yang et al. [3,4] established the demand forecasting model of the terminal. Wang et al. [5] obtained the impact of emergencies on the road traffic flow in terminal through simulation. Mishra et al. [6] proposed a novel semi-open queuing network model for the inter-terminal transportation problem. Chen et al. [7]
applied the concept of resilience to the context of a port-hinterland container transportation network. Wu et al. [8] established the game model to study the dangerous transport route selection. Tang et al. [9] discussed the key aspects of the layout of dangerous goods container in the automated container terminal. Pant et al. [10] described the interdependent adverse effects of disruptive events on inter-regional commodity flows at an inland port terminal.
Reliability Model of Dangerous Goods Transportation Network (DGTN)
Analysis of the Consequences of Dangerous Goods Safety Accidents (DGSAs)
[image:2.612.110.509.210.582.2]DGSAs in the terminal mainly refers to explosion, leakage or fire accidents of the DGs container in the yard. Accidents often lead to heavy casualties and property damage, therefore we ought to establish a model of accident consequences and simulate the accident consequences. The analysis model of accident consequence usually includes the leakage calculation model, the fire heat radiation model and the blast shock wave model. Because there are many kinds of DGs in container terminals and the properties of DGs are quite different, we take a common liquid dangerous cargo-methanol for example. The influence scope of DGSAs is simulated and analyzed by ALOHA software, as shown in Figure 1.
a) Methanol leak toxic diffusion range diagram
c) Methanol leak flash area diagram
b) Methanol vapor cloud overpressure impact area diagram
d) Methanol tank fire radiation impact area diagram
Figure 1. Methanol safety accident impact area diagram.
Travel Time Reliability
The traffic in container terminals is mainly generated by container handling work, thus the handling cycle of transporting containers by trucks can be used to reflect the performance of the transportation network. If the handling cycle is short, the transportation network performance is good. Otherwise, it is poor. According to the reliability theory, the travel time reliability of the transportation network in a container terminal is defined as:
) (
0
c
c T
T P
where, cis the status of transportation network after DGSAs, c0is the status of transportation
network before DGAs, Tcis the handling cycle of transporting container under the statusc, and Tc0is
the handling cycle of transporting containers under status c0.
The Handling Cycle
The handling cycle means the travel time for a truck from starting at the wharf apron, through loading and unloading in the yard, to starting at the wharf apron again. The expression is:
3 2
1 T T
T
T (2)
where,Tis the handling time, T1 is truck travel time between wharf apron and yards,T2 is waiting
time for the truck to be loaded and unloaded at wharf apron, and T3 is waiting time for the truck to be
loaded and unloaded at yard.
From formula (1), the travel time reliability of the transportation network can be obtained according to the handling cycle probability distribution to evaluate the performance of the network. Due to the stochastic characteristics, the handling cycle can be obtained by Anylogic simulation.
Simulation Model of DGTN in Container Terminals
Model Assumptions. The research scope of the model is the whole land area of the terminal from the front line of the wharf to the terminal gate. Under the premise of simplifying the port operation without losing the simulation reliability, the model makes the following assumptions:
a) Only consider the loading and unloading of container ships in terminal without considering the queuing of container ships in the process of entering and leaving the port;
b) External trucks arrive at the terminal randomly, and the time interval of arrival trucks obeys Poisson distribution.;
c) When the corresponding yard of the container ship reaches the stockpile capacity or the yard is damaged, the container can be piled up in the adjacent yard.
Horizontal Operation Process in Container Terminals. We take the import process as an example to describe the simulation model logisitcs. First of all, the empty trucks come to the wharf apron waiting for the quay crane in a queue. If it is empty, the quay crane will unload the containers from the ship and load them to the truck. Secondly, the trucks with containers will travel to the assignment yard waiting for the idle yard cranes. Then the truck will go to the wharf apron if the unloading operation is not completed. Otherwise, the truck will go back to the parking lot. When DGSAs damages the road network and the yard, the traveling route of the truck will change and the containers will be picked up to the adjacent yard.
Figure 2. Horizontal operating system workflow
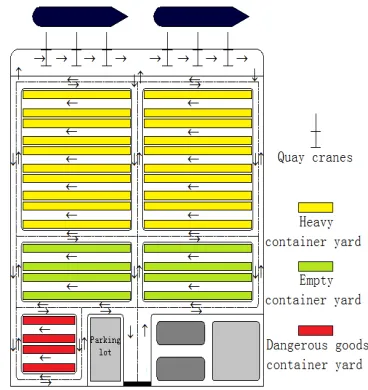
in container terminal. Figure 3. The plane layout of the container terminal. Anylogic Simulation Model. Taking the container truck as an agent, based on the logical order of the workflow of the horizontal operation system in Figure 2 and the actual conditions of the transportation traffic in the terminal, the paper uses the computer simulation software combined with the secondary development of Java to build an agent-based Anylogic simulation model of DGTN in the terminal. It mainly includes road network model in container terminal, cycle model in wharf apron and car agent model.
a) road network model: the road network of terminal is constructed by using Anylogic software, including the length and width of lanes, the direction of traffic, the driving route at the intersection, and the loading and unloading points under the quay crane and the yard crane.
b) cycle model in wharf apron: first, the total number of containers, berths, quay crane should be defined; secondly, achieving the function of the cycle process in heading for the wharf apron, waiting for the quay and yard crane, receiving the services of the quay and yard crane, leaving the wharf apron; finally embedding the car agent model into the cycle model in the wharf apron.
c) car agent model: the real time state of the agent can be traced by giving the agent’s attributes and building the state transition diagram of the agent.
Case Analysis
A seaport with two 50,000-ton container berths is used as a simulation case. It is equipped with 6 quay cranes, 28 yard cranes and 40 trucks. The yard consists of 20 heavy container yards, 8 empty container yards, and 4 DGs yards (separate arrangement). The handling lanes in the wharf apron, main and secondary roads are 6 lanes. The entrance and exit lanes of the gate are 4 lanes. The width of all lanes is 4m. The road intersections in container terminal are no-signal controlled.
Input Parameters
The quay crane operating efficiency is 30TEU/h., and the yard crane operating efficiency is 25TEU/h.The maximum speed in the main road is 30 km/h, and the maximum speed in the secondary road is 25 km/h. The truck driving speed in the working road is 15 km/h, and the maximum speed at the corner of the road 3 km/h. Single vessel loading case is1500TEU, and the proportion of heavy containers, empty containers, DGs containers is 73:23:4. The case takes methanol as an example to analyze safety accidents of DGs.
Simulation Results Analysis
According to the frequency-density curve of the handling cycle obtained from the simulation results of Anylogic, it can be seen that the average value of the handling cycle moves from 800s to 1000s with the increase of the influence radius of DGAs from 40m to 200m, as shown in Figure 4.
[image:5.612.90.520.131.252.2]a) Frequency distribution curve berth 1 b) Frequency distribution curve berth 2 Figure 4. Frequency distribution curve diagram.
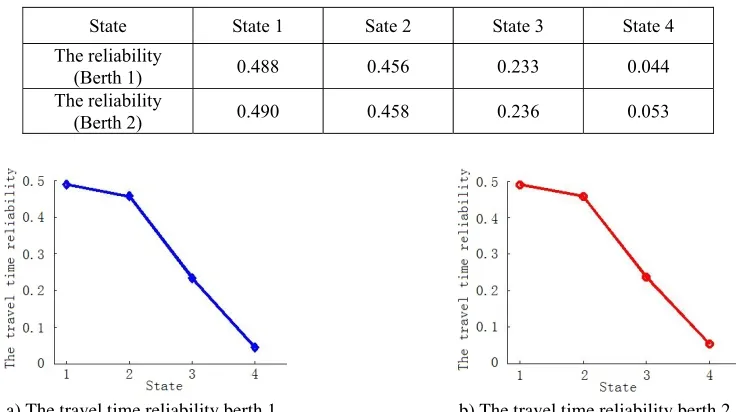
The travel time reliability can be calculated by using equation 1, as shown in Table 1 and Figure 5. Thus:
1) for situations 1 and 2, the safety accidents only affect the DGs yard, but have little impact on the whole road network. The transport paths of empty containers and heavy containers are less changed, while the reliability reduces from 0.49 to 0.45.
[image:5.612.122.490.397.603.2]2) for the situation 3 and the situation 4, the safety accidents affect the DGs and the empty container yard, and have bigger impact on the whole road network. The transport paths of empty containers and heavy containers are changed much, and the reliability reduces from 0.45 to 0.05.
Table 1. The travel time reliability.
State State 1 Sate 2 State 3 State 4 The reliability
(Berth 1) 0.488 0.456 0.233 0.044 The reliability
(Berth 2) 0.490 0.458 0.236 0.053
a) The travel time reliability berth 1 b) The travel time reliability berth 2 Figure 5. The travel time reliability diagram.
Conclusions
cycle of the truck has a random characteristic. With the increase of the scope of DGSAs, the handling cycle of the truck increases as a whole. The travel time reliability can well reflect the running condition of transportation network, which is relevant to the influence radius. The larger the influence radius, the lower the reliability. Future research may consider the travel time reliability of the DGTN under the inland transportation in container terminals.
Acknowledgements
This work was supported by National Natural Science Foundation of China (No. 51709037 and No. 51779037).
References
[1] L.F. Cao, L. Zhao, F.G. Gong, et al, Analysis and Research on the capacity of Port Road, Tianjin Constr. Sci. Technol. 6(2008) 47-49.
[2] Y. Liu, Design and study of road traffic network in Dalian container port area, NUST 2010. [3] Z.Z. Yang, G. Chen, R. Douglas, Modeling Road Traffic Demand of Container Consolidation in a Chinese Port Terminal, J. Transport. Eng. 136(2010) 881-886.
[4] Z.Z. Yang, G. Chen, K. Chen, Traffic demand forecasting model for large port based on terminal operation situation, J. Dalian Marit. Univers. 35(2009) 35-38+42.
[5] G. Wang. Traffic flow impact on harbor road of container terminals under the yard emergency, DLUT 2015.
[6] N. Mishra, D. Roy, J.K. van Ommeren, A Stochastic Model for Interterminal Container Transportation, Transport. Sci. 51(2017) 67-87.
[7] H. Chen, K. Cullinane, N. Liu, Developing a model for measuring the resilience of a port-hinterland container transportation network, Transport. Res. Part E 97(2017) 282–301.
[8] J. Wu, D. Wang, J. Li, et al, Game analysis of hazardous chemicals transport route selection based on reinforcement learning-model, Syst. Eng.-Theory Pract. 35(2015) 388-393.
[9] Q.H. Tang, S.P. Wu, X.L. Zhang, et al, The layout of dangerous goods container yard in the automated container terminal [J]. Port Wat. Eng. 9 (2016) 56-59.