2017 2nd International Conference on Manufacturing Science and Information Engineering (ICMSIE 2017) ISBN: 978-1-60595-516-2
Analysis of Influence of VOCs Diffusion on the
Operation of Liquid Cargo Tank in Multi Berth
Anchorage Based on CFD
Lina Shi, Faxin Zhu, Jinshu Lu, Wenfeng Wu, Min Zhang
and Hailin Zheng
ABSTRACT
This paper mainly aimed at the study on the diffusion mechanism of VOCs on multi-berth anchorage oil tanker operations, analyzed the theory of diffusion mechanism of VOCs on multi-berth anchorage oil tanker operation and established the models of physical, mathematical and numerical on the diffusion simulation of VOCs. Fluent software had been used, the paper simulated the diffusion mechanism of VOCs on multi-berth oil tanker operations under different environmental conditions, just like leakage intensity, temperature and speed. Types of simulation results mainly included pressure nephogram and gas concentration diagram. By Analysising the influencing factors, finally we ensured the safety of oil tanker operations.1
INTRODUCTION
In the mid-20th century period, with the rapid development of productivity, emissions of oil tanker operation such as Volatile Organic Compounds increased and spread rapidly and seriously affected the environment and people's health. Therefore, oil tanker spread out relatively more VOCs, in the process of operations, compared to the freighter and working ship. More likely to cause personnel
1Lina Shi, Faxin Zhu, Jinshu Lu, Wenfeng Wu, Hailin Zheng, School of Port and Transportation Engineering, Zhejiang Ocean University, Zhoushan, China.
poisoning, air pollution, and even the risk of burning explosion, which attracted a great deal of attention from all walks of life.
During the course of mooring, the safety of the tanker was mainly affected by environmental factors, ship factors and human factors. But the research on marine environmental conditions of port berth anchorage oil tanker operation was rarely reported. Based on this, this paper studied the influence of environmental factors on the VOCs diffusion in liquid cargo operation of anchorage tanker.
VOCSDIFFUSION THEORY OFLIQUID CARGO OPERATION IN MULTI BERTH ANCHORAGE TANKER
Gas diffusion could be divided into three physical forms, namely, drift diffusion, momentum diffusion and molecular diffusion. Because of the monsoon in different degrees in the selected sea area, with the development of VOCs drift diffusion and momentum diffusion, there were some potential risks such as air pollution, personnel poisoning, VOCs combustion and explosion at the tanker operation of multi berth anchorage tanker.
In this paper, three factors, the intensity of VOCs diffusion, the temperature of sea area and the velocity of sea area were simulated respectively. We tried to find the law of VOCs diffusion under the influence of the above three factors, so that operators could avoid working under adverse natural conditions, thus reducing the risk of accidents.
MODEL BUILDING FOR GAS DIFFUSSION SIMULATION
Physical Model
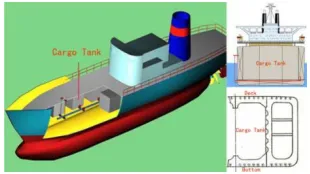
[image:2.612.219.374.569.656.2]A prototype of floating production storage and offloading tanker was constructed. FPSO system had wide deck area, strong bearing capacity and strong ability against wind and wave. And it was easy to produce equipment layout and very representative. As is shown in Fig.1,because the diffusion point source size varies greatly during different operation periods, it is assumed that the size of the diffusion source is constant and continues to diffuse into the computational region.
Numerical Simulation Model
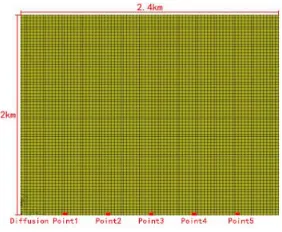
[image:3.612.225.366.302.418.2]Based on the above physical model and mathematical model ,due to the long time, high cost and safety risk of the actual ship test in this project, we modeled and simulated the Fluent in advance to prevent greater economic losses. A computational region model of size 2.4km * 2km was established according to the specific literature. The diffusion of VOCs during the loading and unloading operation of the five berth tanker, which is evenly distributed at every 400 meters and equal distances on the 2.4km production berth line, is examined. In this case, the diffusion source is assumed to be quadrilateral, and the dimensions near the deck are 20m*10m and spread continuously to the computational region. The schematic diagram is shown in figure 2.
Figure 2. Sketch map of calculation area.
FLUENT SIMULATION ANALYSIS
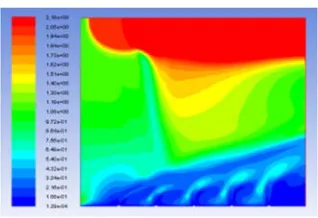
The key of Fluent simulation analysis is to show the distribution trend. For example, the different colors shown in the pressure cloud indicate different trends in the magnitude of pressure. Red represents a great value of pressure, which is the result of macroscopic view. The VOCs concentration profiles show different concentrations of VOCs. Red represents a large concentration of VOCs. It is only a trend. It does not indicate the size of the specific concentration.
Analysis of Influence of Diffusion Strength
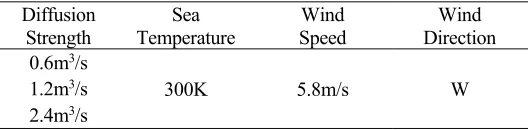
TABLE I. DIFFUSION STRENGTH COMBINATION. Diffusion
Strength
Sea Temperature
Wind Speed
Wind Direction 0.6m3/s
300K 5.8m/s W 1.2m3/s
2.4m3/s
When the author uses Fluent software to simulate the process, the residual graph shows that the convergence is good. Due to the limitation of the space, the detailed residual maps are not listed in detail, and the latter is not repeated.
THE DIFFUSION STRENGTH IS 0.6M3/S
[image:4.612.124.462.309.407.2]
Figure 3. Pressure nephogram. Figure 4. VOCs concentration distribution map
THE DIFFUSION STRENGTH IS 1.2M3/S
THE DIFFUSION STRENGTH IS 2.4M3/S
[image:5.612.322.466.111.220.2]
Figure 7. Pressure nephogram. Figure 8. VOCs concentration distribution map.
IMPACT ANALYSIS
From the above analysis of pressure nephogram, when the diffusion intensity is 0.6m3/s, the pressure distribution is even, and the pressure is larger when approaching the upper wind direction. With the increasing of VOCs diffusion intensity, the convection between the air above the point of diffusion and the VOCs discharged from the point source is strengthened. When the diffusion strength is 1.2m3/s and 2.4m3/s, the regional pressure is obviously higher than the diffusion strength, and the pressure distribution is obviously unstable at 0.6m3/s.
From the analysis of the above VOCs concentration profiles, the VOCs are continuously downward to the wind direction ,and the VOCs concentration at the gas vent increases with the increase of the diffusion intensity. When the diffusion intensity is 0.6m3/s, the distribution of VOCs concentration is uniform, and the operation of the tanker is relatively safe. When the diffusion intensity is 1.2m3/s and 2.4m3/s, the distribution of the dangerous explosion concentration area is uneven, and the probability of the risk of oil tanker operation becomes larger.
Analysis of Sea Temperature Influence
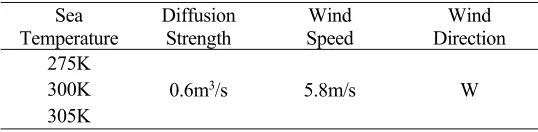
[image:5.612.162.431.622.688.2]According to the average temperature of the four seasons in the sea area, the representative 275K, 300K and 305K were selected to simulate the operation of the tanker in winter, spring and autumn and summer. Sea temperature combinations as shown in Table 2.
TABLE II. SEA TEMPERATURE COMBINATION. Sea
Temperature Diffusion Strength Speed Wind Direction Wind 275K
0.6m3/s 5.8m/s W
THE SEA TEMPERATURE IS 275K
[image:6.612.328.487.161.270.2] [image:6.612.108.266.163.273.2]
Figure 9. Pressure nephogram. Figure 10. VOCs concentration distribution map.
THE SEA TEMPERATURE IS 300K
Figure 11. Pressure nephogram. Figure 12. VOCs concentration distribution map.
THE SEA TEMPERATURE IS 305K
[image:6.612.340.472.572.664.2]
IMPACT ANALYSIS
From the above analysis of pressure nephogram, with the rising of sea area temperature, the influence of sea temperature on the division of pressure zone of VOCs diffusion layer is not very obvious. The greater the pressure near the upper wind, the greater the gas pressure. Therefore, in the actual operation, we should strengthen the inspection of the pressure around the operation vehicle, and strengthen the safety measures so as to ensure the safety of the operation of the tanker.
From the above VOCs concentration map analysis, with the rising temperature of the sea area, he impact on the concentration of VOCs is not very obvious. The basic trend unchanged. The higher concentration of VOCs reservoir moves to the lower wind direction, and the area of dangerous explosion concentration is the largest. It is necessary to strengthen the detection of the VOCs concentration around the operation oil tanker under the lower wind direction, so as to ensure the safety of operation.
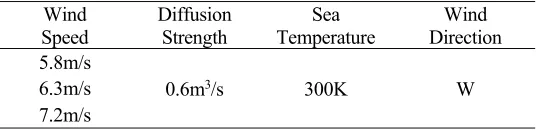
Analysis of Wind Speed Influence in Sea Area
[image:7.612.164.432.441.506.2]According to the monthly average wind speed in the sea area, three representative groups of wind speed are selected for simulation study. They are 5.8m/s,6.3m/s and 7.2m/s respectively, and the wind speed combinations in the sea area as shown in Table 3.
TABLE III. SEA WIND SPEED COMBINATION.
Wind
Speed Diffusion Strength Temperature Sea Direction Wind 5.8m/s
0.6m3/s 300K W
6.3m/s 7.2m/s
THE WIND SPEED IN THE SEA AREA IS 5.8M/S
THE WIND SPEED IN THE SEA AREA IS 6.3M/S
Figure 17. Pressure nephogram. Figure 18. VOCs concentration distribution map.
THE WIND SPEED IN THE SEA AREA IS 7.2M/S
[image:8.612.335.464.293.380.2]
Figure 19. Pressure nephogram. Figure 20. VOCs concentration distribution map.
IMPACT ANALYSIS
From the analysis of the above pressure nephogram, the change of wind speed in the sea area has no obvious influence on the distribution of pressure nephogram. With the increase of wind speed in the sea area, the wind direction is always high and the berthing pressure is great. Therefore, it is necessary to strengthen the pressure detection around the upper wind direction tanker. This conclusion is basically consistent with the analysis of the sea temperature.
CONCLUSION AND PERSPECTIVE
Conclusion
In this paper, the physical model, mathematical model and numerical model of gas diffusion simulation were established by the VOCs diffusion theory of liquid cargo operation in multi berth anchorage tanker. The main contents of this paper were summarized as follows:
VOCS DIFFUSION THEORY OF LIQUID CARGO OPERATION IN MULTI BERTH ANCHORAGE TANKER
Through the analysis of the concept of gas diffusion and its influencing factors, it was concluded that there were drift diffusion and momentum diffusion in the process of loading and unloading liquid cargo at anchorage. According to the analysis of factors affecting gas diffusion, the model variables in this study were mainly VOCs diffusion intensity, sea area temperature and sea area wind speed.
MODEL BUILDING FOR GAS DIFFUSION SIMULATION
In this part, we selected the physical model, construct the mathematical model and simulate it. The contents of numerical simulation included physical modeling, VOCs diffusion coefficient, mesh generation, boundary condition setting and calculation model.
FLUENT SIMULATION ANALYSIS
In view of the actual situation of liquid cargo operation of multi berth tanker, Fluent software was used to simulate the VOCs diffusion process of multi berth tanker liquid cargo operation, and then comprehensive analysis and comparison of different impact parameters were carried out. Finally, it was concluded that the simulation results were in good agreement with the theoretical analysis.
Perspective
Because of the limitation of the author's level and time, the research in this thesis needs further study:
In this paper, a simplified assumption is made in the numerical simulation. It is assumed that there is no heat exchange between air and oil, and there is no comparison experiment of heat exchange.
ACKNOWLEDGMENTS
The present research was partly funded by below projects:2017Talent project of Zhejiang college students' science and technology innovation activity plan (Xinmiao Talents Project of Zhejiang), No.2017R411063.Natural Foundation of Zhejiang,No.LQ14E090001.2016Nation Natural Foundation of Zhejiang,No.LQ16E090003.2016Open subject of Aquatic Science in Zhejiang Province,No.20160022.2016Local cooperation office of Zhejiang Ocean University,Zhejiang Ocean University Professor Dr. "Four Ones" Service Engineering (Zhoushan Minrui Science and Technology Consulting Co., Ltd.),Zhejiang Ocean University [2016] 5.
Also, the research was supported by Zhejiang Ocean University. Thanks Zhu Fa-xin, Lu Jin-shu, Wu Wen-feng, Zhang Min, Zheng Hai-lin for their selfless and sincere support.
REFERENCES
1. Zhao Hui-jun, Zhang Qing-song, Zhou Shi-dong etc. Study on the Numerical Simulation of Gas Leakage in Gas Tank Area Based on Phoenics [J]. China Safety Science Journal, 2007, 17(2): 39-43.
2. Shen Yan-tao, Yu Jian-guo. Numerical Simulation of Hazardous Gas Release with CFD modol [I]. Journal of Chemical Industry and Engineering(China), 2007, 58(3): 745-749. 3. Li Chang-lin, Xiong Yun-shi, Geng Bao etc. Environmental Impact Assessment of Pipeline
Characteristics of VOCs Pipelines [J]. Environmental Protection of Oil & Gas Fieles, 2012,01(14): 40-46.
4. Zhang Xiu-ling, Song Cui-hong, Liu Chun-chang. The theory of oil tanker of VOCs diffusion [J]. China Petroleum and Chemical Standard and Quality, 2011, 31 (7): 248-249.
5. Liu Yong-song. Analysis of the influence of obstacles on the flow of VOCs diffusion based on ANSYS simulation [J]. Technology Supervision in Petroleum Industry, 2013, 29 (5): 55-57.
6. D.N. Orensen, P.V. Nielsen. Quality control of computational fluid dynamics in indoor enviroments [J]. Indoor air, 2003, 13: 2-17.
7. P.V. Nielsen. Computational fluid dynamics and room air movement [J]. Indoor air, 2004, 14: 134-143.
8. Ma Cun-dong. The results of analysis of the law of gas diffusion simulation of the failure of high pressure natural gas pipeline [J]. Oil-Gas Field Surface Engineering, 2005, 24 (3): 8-10. 9. Wang Fu-jun. The principle and application of computational fluid dynamics analysis
software CFD [M]. Beijing, Qinghua University Press, 2004.
10. Zhao Su-ping. LNG Carrier Anchoring Security Research [D]. Beijing, Beijing Institute of Technology, 2001: 36-39.
11. E.L. Cussler. Diffusion Mass Transfer in Fluid Systems [M]. Beijing, Chemical Industry Press, 2002.
12. Wang Li-hua. Study on The Diffusion Simulation of Leaked Oil-gas on Offshore Platforms Based on CFD [D]. Qingdao, China Ocean University, 2014.
14. Zhu Zhe-ye, Lu Jin-shu, Liu Feng-shen etc. Experimental Design of Research Model of Compartment Breathing Out With sloshing Effect [J]. Oi l& Gas Storage and Transportation, 2014, 33(6): 657-661.
15. Renato Rota, Simone Frattini, Sabrina Astori. Emissions from Fixed-Roof Storage Tanks: Modeling and Experiments [J]. Ind. Eng. Chem. Res, 2001(24): 5847-5857.
16. Zimmerman J.R. User's guide for HIWAY, A Highway Air Pollution Model [R]. USEPA-650/4-74-008, 1975.
17. Beaton J.L. Math emanation approach to estimating highway impact on air quality, Washington [R]. Washington: Fed. Highway Administration, 1972.
18. Chock D.P. A simple line-source model for dispersion near roadways [J]. Atoms Eviron,1978. 19. Gualtieri G., Tartagila M. Predicting Urban Traffic Air Pollution: A GIS Frame work.