Journal of Criminal Law and Criminology
Volume 35 | Issue 3
Article 9
1944
Current and Postwar Automobile Speeds
E. H. Holmes
Follow this and additional works at:
https://scholarlycommons.law.northwestern.edu/jclc
Part of the
Criminal Law Commons
,
Criminology Commons
, and the
Criminology and Criminal
Justice Commons
This Criminology is brought to you for free and open access by Northwestern University School of Law Scholarly Commons. It has been accepted for inclusion in Journal of Criminal Law and Criminology by an authorized editor of Northwestern University School of Law Scholarly Commons.
Recommended Citation
AMERICAN JOURNAL OF
POLICE SCIENCE
Editor. David Geeting Monroe
Director of Research and Information, The Northwestern University Traffic Institute
Associate Editors:
M. EDWIN O'NEILL C. M. WILSON
Of the staff of the Chicago Police Scientific Crime Detection Laboratory
C. W. MUEHLBERGER DON L. KOOKEN Director Supervising Lieutenant Michigan Crime Detection Laboratory Division of Education and Personnel
Michigan Department of Health Indiana State Police
CURRENT AND POSTWAR AUTOMOBILE SPEEDS
E. H. Holmes
(In the following article Mr. Holmes directs attention to a number of esting findings relating to current and postwar automobile speeds. His inter-pretations are backed by years of study and research. He is a graduate of the Massachusetts Institute of Technology (year 1928, degree in Civil Engineer-ing), and was awarded a fellowship in Harvard University's Albert Russell Erskine Bureau for Street Traffic Research for the annum 1929-30. Since then he has been in the continuous employment of the United States Public Roads Administration. Recently he was made Acting Chief of its Division of Highway Transport Research.-Editor.)
"Speed too fast for conditions" is perhaps the cause most commonly ascribed td automobile accidents. Speeds of very low order may be too fast on a city street; extremely high speeds may be relatively safe on the Bonneville salt flats. But our real problem of speed, at least as the highway designer views it, lies between these two extremes-the speeds found on our rural highways.
One of the unexpected items that we can enter on the credit side of the ledger of war cost is the greatly increased conscious-ness of motor vehicle speeds. Official requests from Washington that speeds be held first to 40 and then to 35 miles per hour met an immediate and almost unanimous response from public officials responsible for highway traffic throughout the country. Safety and conservation organizations pointed their educational guns toward the objective of reducing speeds, and the motor vehicle and allied industries through their advertising mediums directed public attention to the need for conserving motor vehicle trans-portation. And to measure the effectiveness of this concerted effort, studies of motor vehicle speeds are being conducted in unprecedented numbers.
At the request of the Highway Traffic Advisory Committee to the War Department and of the Public Roads Administration,
speeds of vehicles at representative points on rural highways the country over are being regularly reported. In one recent period reports were received from 41 states, whereas adequate records prior to Pearl Harbor could be found in only 17 states. It is to be hoped that this awareness of the speed problem can be main-tained in the postwar period, for it is only by constant review of the problem and critical analysis of the effect of whatever measures are taken, that its solution may be found.
What, then, has been accomplished in reducing speeds to a level consistent with the need for motor vehicle conservation? Figure 1 shows the average rural speeds throughout the country calculated from figures submitted by the various States to the Public Roads Administration. Speeds prior to the war averaged about 47 miles per hour on the sections of highways over which
0941 1942 1943
0.
30 -o
IN 0 .J F M A M .J J A 5,.0 N4P JF - - - M A M J J A, _____ ____0 NI 0
-1_ "4 A_, l esr
President - osolr OD.T. Orders Nationwide Pleasurt Plea~ure Pleosure
appeal5 for Rationed 3P M.P.H. Gasoline Drivin9 Driving Ban Drsving Ban
40 MP. Limit in Eot Limit Rationing Banned Restored Lifftd in East in East
FIGURE i.-AVERAGE WARTIME 5PEED5 ON MAIN RURAL I-IIGHWAY5 BY PERIOD5
[image:3.454.66.392.237.482.2]CURRENT AND POSTWAR AUTOMOBILE SPEEDS
of the country as well, and efforts toward motor vehicle conserva-tion were correspondingly stimulated.
It remained for the ODT directive requiring speeds be held to 35 miles per hour to bring about the greatest actual reduction in vehicle speeds, and to reduce them to the lowest level that has prevailed for many years. This order, coupled with parallel action by many state governors and legislatures combined to
re-duce speeds to an average of 36 miles per hour.
Since this low in the late fall of 1942, speeds have been rising slowly but steadily throughout the country, until the most recent reports show substantially increased averages. In no state in that period was the average as low as 35, and in 12 of 21 report-ing states average speeds equaled or exceeded 40 miles per hour. The lines on this chart show marked breaks between the vari-ous reporting periods. Partly that is the result of continuing the lines to connect the speed levels in the various periods. Actually, however, speeds did respond to external influences almost as rapidly as shown here. As a demonstration of the sensitivity of this speed index, Figure 2 shows the average speeds month by month at four representative locations near the District of
1941 1942 1943
45
0
el
25
--N P J F M AM J J A 50 N 0,J F M A MJ J A SO N D
President r 6asolint ODT Orders Nationwide Pleasure Pleasure Pleaure
appeals for Rationed 35 IPlH. 6asoline Drivin9 riving ean Driving Bar
40 PtIH.Limit in East Limit Rationin9 Banned Restored Liftqi
[image:4.454.71.398.314.550.2]in East in East
FIGURE 2.-AVERAGE WARTIME SPEED5 ON FOUR RURAL
HIGHWAY5 NEAR WA5HIINGTON, D.C., BY PERIOD,S
shown in that figure. The sharp dip in June 1943 followed the restoration of the pleasure driving ban in the Northeast and apparently indicates the most cautious of driving by those opera-tors who did venture on the rural highway.
Average figures show the general picture. They are useful in assaying general trends and for rough gauges of the effective-ness of whatever measures may have been taken to influence speed. Any real analysis of the problem, however, requires that we go a good deal deeper than these average figures permit. If we are to forecast what may occur in the postwar period, we must examine in more detail how we arrived at our present situation.
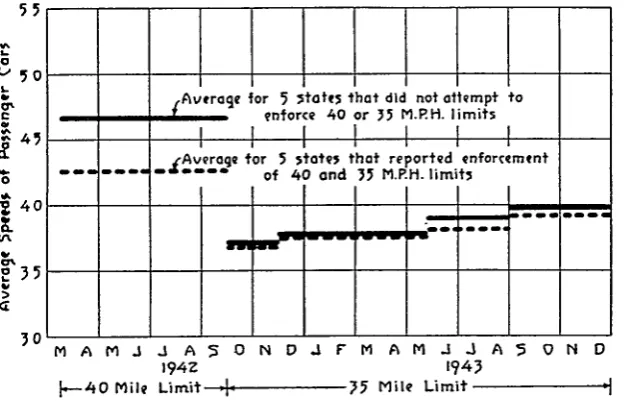
The thought that usually first comes to mind is the influence of enforcement practices. This element is difficult to evaluate statistically, at least from the information available to us in Washington. Strenuous enforcement efforts in an area where police forces are greatly undermanned may be relatively ineffec-tive; on the other hand, the mere presence of patrolmen, even though limits are not strictly enforced, is bound to have a sober-ing effect on the driver. Recognizsober-ing these statistical limitations it is interesting, nevertheless, to compare in Figure 3 the trend of speeds in five states in which it was reported that efforts were made to enforce the prevailing nation-wide limits with the trends in five states in which the limits were reported to be non-enforceable because of the lack of appropriate legislative action
55
r-0' 0
72
5O
Average for 5 3tate5 that did not attempt to
enforce 40 or 35 M.P.H. limits
SI
I
i
i
-jAverage for 5 5totes that reported enforcement
of 40 and 35 M.P.H. limit5
40
35
n' __ _ _ __ __ __ __ __
M A M J J A 5 O N D J F M A M J J A 5 ON D0
194Z 1943
[image:5.454.60.381.370.576.2].- 40 Mile Limit 14 - 35 Mile Limit - A
FIGURE 3.- COMPARISON OF AVERAGE PAS5ENGER CAR 5PEED5 IN TATE5 THAT DID AND DID NOT ATTEMPT ENFORCEMENT
CURRENT AND POSTWAR AUTOMOBILE SPEEDS
or emergency powers. This figure shows a marked difference in observance of the 40-mile limit during the early stages of the war. It shows, however, an insignificant difference once speeds reached their lowest levels in the fall of 1942, since the 35-mile limit has been in effect. The conclusion, therefore, seems to be that enforcement activities have had less effect than voluntary conservation, engendered perhaps by the existence of enforce-able limits in some cases, but probably more by the continuing publicity regarding vehicle, tire, and gasoline shortages.
Another comparison that may be made, and one which opens a wider range of speculation, is the comparison of war speeds with prewar speeds in groups of states having different prewar speed limits, as shown in Figure 4. Here on the left of the chart the top line shows the prewar speeds in 8 states in which there were no fixed limits. The average was just under 49 miles per hour. Then in order come lines showing the average prewar speeds in states having prewar limits of 60, 55, 50, and 40 miles per hour, respectively, the last line unfortunately representing only one state.
55
11 QtKlj I
)0pre-Wor Mao 1942 Oct. 1942 Dec. 1942 Mo0j1943 5ep,1943
Oct. 194- Dc942 MoLI943 5ep.1943 Jon. N94
FIURE 4.-AVERAr, EPEED5 OFVEHILLE5 ,Y PERIOD5,CLA51FIED
BY 5TATE5 H1AVING VARIOU5 PREWIAR SPEED LIMITS
It is significant that the average speeds varied directly with the speed limits and showed a wide range of more than 8 miles per hour between the highest and lowest average. Which is cause and which is effect is debatable. It seems likely, however, that a natural relation will always exist between desired and legal speeds, if only because a regulation inconsistent with the pro-nounced desires of the majority is difficult if not impossible to enforce.
how these originally divergent habits have been molded into a uniform pattern. Since the beginning of 1943 the range of speeds in the states that originally had widely differing speeds and speed limits now is almost negligible. Furthermore, within this narrow range the prewar order has become completely jumbled, with the lowest prewar group now being bracketed with the original middle group in top position, and the lowest present position being occupied by states that originally showed the second highest average. The explanation of this feature is prob-ably that the differences are so small that the order has become insignificant, but as mentioned before, this figure offers inter-esting possibilities for speculation.
This curve seems to have particular value, however, as a basis for forecasting what may occur when the war is ended. Speeds are already rising slowly but perceptibly. There is every reason to believe that once wartime restrictions are lifted, speeds will rapidly return to their prewar levels. Unless there are powerful campaigns of education and enforcement, backed by effective legislation, prewar speeds will again prevail. And accompanying
this increase will be a wave of accidents and fatalities as vehicles and drivers, figuratively rusty through disuse, and with every variety of prewar, recapped, and synthetic tires, find the strain too great. Furthermore, it is reasonable to believe that we can look to the states having the highest speed limits or no fixed
limits at all to take the lead in the postwar accident toll. Speed distributions as shown by figures that have been assem-bled at the many points on rural highways presumably might have been influenced by one or more of four principal factors: the road; the traffic; the vehicle; and finally the driver himself.
Considering these factors in order, the road may limit speed because of its alinement or because of its surface condition. Certainly there are many sections of highway on which the curvature and superelevation are such as to require the reduc-tion of speeds below those desired by the driver. Occasionally also, the road surface may be rough or have deteriorated suffi-ciently so as to require a reduction in speed. Neither of these conditions can have influenced the speeds on the sections included in the studies, however, for observation stations were invariably selected on level straightaway sections with smooth surfaces, with the specific objective of eliminating the highway itself as a factor influencing the driver's choice of speed. We may, there-fore, count out the highway.
CURRENT AND POSTWAR AUTOMOBILE SPEEDS
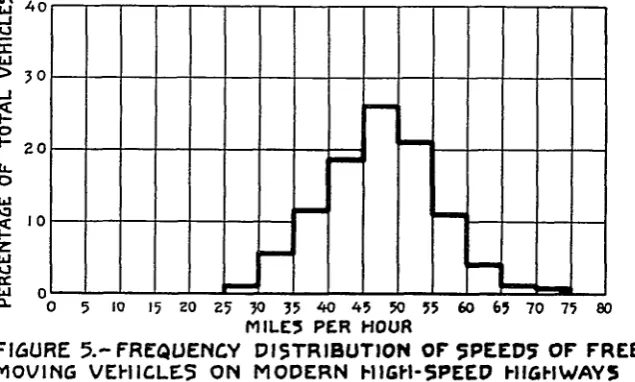
eliminated as a variable by considering only those vehicles so separated from vehicles traveling in the same or opposite direc-tion that their speeds were unaffected by other traffic. A typical pattern of speed of such vehicles with the influence of the road and traffic eliminated is shown in Figure 5. Here, with just the "free-moving" vehicles included, only 6 per cent traveled faster than 60 miles per hour, and but 36 per cent exceeded 50 miles per hour. Under these conditions, with the large majority of vehicles confined to the low and moderate speed ranges, we must look for explanation to the vehicle or its driver.
.40
> 30
-l
Io
0
-20
IL
10
S0-oL 0 5 I 15 ZO Z5 30 35 40 413 30 55 60 65 70 75 80
MILE5 PER HOUR
FIGURE 5.-FREQUENCY DISTRIBUTION OF 5PEED5 OF FREE
MOVING VEIHIICLE5 ON MODERN HIGH-SPEED HIGHWAYS
It is not so easy to eliminate unknowns in these categories. But considering now the vehicle, let us look back a little into the history of speed. First we have Figure 6, which shows motor vehicle speed records from about 1900 to date. These are one-mile records, established on straightaways and with a flying start. They show a rather gradual increase until about 1925, when the curve broke sharply, with speeds jumping from around 175 miles per hour to nearly 375 miles per hour in a 15-year period. The break in the trend probably coincided roughly with the beginning of the change in appearance and construction of the vehicle from something resembling an automobile to something more nearly resembling a projectile and which must be sighted, rather than
steered.
[image:8.454.73.391.193.384.2]3 250
0
M200-w
U%
LI150
100
50
-0
1595 1900 1905 1910 1915 1920 19;5 1930 1935 1940
[image:9.454.61.386.61.306.2] [image:9.454.61.383.347.570.2]YEAR
FIGURE 6.-ONE MILE MOTOR VEHICLE 5PEED RECORD5
5ource :-American Automobile A5;ociotion
120
0
---0
-U% 0
--- -0 - -
-S80
< 70T7
1911 1915 1919 19Z3 197 1931 1935 1939
YEAR
FIGURE 7.-AVERAGE 5PEED OF WINNER IN MIEMORIAL
VAY RACE5 ON INDIANAPOL15 5PEEPWAY BY YEAR5
CURRENT AND POSTWAR AUTOMOBILE SPEEDS 197
Day races at Indianapolis. This curve shows on the average a steady increase, but closer inspection shows that it has risen in a series of plateaus. These figures are more closely related to our problem because they show steadily increasing speeds despite constantly tightening restrictions on such important elements as piston displacement and oil consumption. They show that the application of the results of technical progress and of the country's inventive genius will produce faster and faster cars despite increasing stringency in operating economy. Incidentally, the vehicles setting these records bore a considerable resemblance to automobiles, and were steered, not sighted.
Now coming to the core of our problems of the vehicle, we see in Figure 8 the trend in speed records set by American stock cars. These vehicles not only resemble, but actually are, the vehicles we see in our everyday traffic. They, too, have shown an increase in top speeds. From 1925, when only the high-priced cars could beat 60, we find that the average 1940 car in the low-priced field can exceed 80 miles per hour, and in the high-low-priced field it can top 90.
100
go
80 .:_ .
- - J
-
70-I "" t r __
-LEGE-ND-0---High Price Group
50 -- Medium Price Group
--- " Low Price Group
,-C 19Z5 19e 1931 1934 1937 1940
[image:10.454.66.390.296.603.2]YEAR MODEL
FIGURE
8.- AVERAGE TOP 5PEED5 OF AMERICAN STOCK
CARS
IN
4HIGH, MEDIUM AND LOW PRICE RANGE5
BY YEAR MODEL5
ource:-Provin9 Ground Records 0
CL
0,.
W
W -J
U%
.l 0
i hI
Li
Two items are outstanding in this figure. First, the spread between speed capabilities of high- and low-priced cars has nar-rowed from 18 miles per hour in 1925 to less than 10 in 1940. In 1938 models it was only 8 miles per hour. Second, and more significant, is the general shape of the curve, which shows a definite leveling after 1934. Contrast this with the two previous diagrams. The rise in the mile record since 1925 has been almost meteoric. The rise in the Indianapolis speeds has been steady despite the increasing limitations imposed by the Contest Board. But stock car speeds have leveled off.
Clearly the manufacturer could have built in more speed if the speed capacity was not already equal to or in excess of the public's desires. Keeping this figure in mind, let us consider again the speed distribution of Figure 5, which showed that the greatest number of drivers moving without interference of road or traffic wish to travel between 45 and 50 miles per hour, and that only a scattered few wish to drive at speeds above 60, a speed at least 20 miles per hour below the speed capacities of their vehicles.
It is logical to conclude therefore that the vehicle also may be eliminated as a factor influencing the speed data we are con-sidering. Of the four original factors only the driver himself remains as a variable, and that variable is by far the most obscure and unpredictable in its behavior.
Drivers control their speed in accordance with their own idiosyncrasies and inhibitions. Diagnosing these idiosyncrasies is a job for a psychologist, not an engineer. Perhaps a psychia-trist would be more appropriate. But the engineer can point out a few symptoms to aid the psychologist in his diagnosis, and thereby perhaps can perform a useful service.
Several years ago the Public Roads Administration under-took an investigation of the characteristics of individual drivers, working in collaboration with the Institute of Human Relations at Yale University, and the American Association of Motor
Vehicle Administrators. In these investigations vehicle speeds
were determined on sections of highway and under conditions of traffic that would not constitute retarding influences. Beyond the points where the speeds were observed the vehicles were stopped and their drivers questioned regarding a number of their personal characteristics such as age, sex, occupation, place of residence, and driving experience, and regarding features of their trip such as its length, and purpose. This investigation, both in the field and analytical phases, has been stopped by the war, but the results give promise of a fertile ground for further study once work can be resumed.
CURRENT AND POSTIVAR AUTOMOBILE SPEEDS
average, out-of-state drivers traveled faster and drove newer cars than drivers residing in the state of the study; young per-sons drove somewhat faster than older perper-sons; men drove slightly faster than women; drivers on long trips traveled faster than those on short trips; non-owners drove faster than those who owned their vehicles; and newer vehicles were driven faster than older vehicles.
In our consideration of speed there has always been an assumption, perhaps almost subconscious, that speed and safety are closely related. It is probable that this belief persists in the minds of most of us even though there has never been any very clear evidence developed of the character of this relationship if it exists. Even now a joint committee is renewing the search for such a decisive relationship.
Without attempting or wishing to venture far into this field in this discussion, it is believed, nevertheless, that the com-parisons shown in Figure 9 are of interest. This figure simply shows that high-speed drivers from the States of Connecticut, New York, and New Jersey, as shown by the records of those States, are guilty of more speed violations (which, of course, is
5PEED VIOLATIOIS TRAFFIC VIOLATIONS TRAFFIC ACCIDENTS
140
120
tn
t 100
0 80 0
tr
U
tJ M. 60
W
z
• - 40
20
0
SPEED SPEED SPEED SPEED SPEED SPEED BETWEEN OVER BETWEEN OVER BETWEEN OVER
3 AND45 50 35AND45 50 35AND45 50
M.P.H. M.P.H. M.P.H. M.P.H. .P.IH. M.PRH. FIGURE 9.-COMPARI5ON OF NUMBER OF 5PEED VIOLATION5, TRAFFIC
VIOLATION5, AND TRAFFIC ACCIDENT5 FOR MODERATE AND
[image:12.454.65.386.326.609.2]to be expected), are guilty of more traffic violations, and are in-volved in more accidents than are those drivers who hold to a more moderate speed.
It is believed that this is the only analysis ever made of the accident experience of drivers as related to their normal driving habits, if we may assume that their speeds at the time they were observed in these studies, at points where they were uninhibited by unusual road or traffic conditions, represent their normal habits. It does not mean that the drivers were necessarily driving at high speed when they were involved in accidents nor when violating traffic regulations.
Thus this comparison does not in any way show the driver's performance at the time of violation or accident. It does show, however, that whatever individual characteristics inspire a driver to travel at high speed also caused him to be involved in more than his share of trouble on the highway, and confirms the many other reasons that make us feel that the fast driver is the core of our safety problem.
Now in conclusion, a word on postwar speeds, not so much a year or two postwar, as somewhat further in the future. What will these speeds be? If the trends shown in this discussion are accurately interpreted, we have in recent years provided high-ways and vehicles with speed capacities in excess of those possessed or desired by most of the drivers. Driving in new vehicles on smooth, straight roads unobstructed by traffic and uninhibited by speed limits, few drivers even approximate the speeds available to them.
If the vehicle and the roadway have caught or passed the driver in speed capacity, we must look to the drivers themselves with their human strengths and weaknesses as the index of our future speeds. In normal times we buy new cars every two or three years. We buy new highways every 20 or 30 years. But our physical and mental equipment is born with us and it must last a lifetime, even depreciating somewhat as life wears on, and psychological changes come about slowly if at all. To the extent we can relate speed to driver characteristics, we can, therefore, forecast future speed trends.
num-CURRENT AND POSTWAR AUTOMOBILE SPEEDS
ber of vehicles exceeded 65 miles per hour, the greatest concen-tration of speeds lay in the range between 40 and 45 miles per hour, and a significant number traveled at less than 35. On the best of highways constructed shortly before the war, speeds were higher, both average and maximum. But there still were many vehicles moving below 35 to hold the average to a figure of 48.5 miles per hour. It is doubtful whether on rural roads where access is unlimited, along which roadside developments flourish, and on which short trips are frequent or may even be predomi-nant, that the average in the postwar period will show much increase above this figure.
If, however, we build highways to the standards recom-mended by the National Interregional Highway Committee in its report recently transmitted to Congress by the President, we may expect considerably higher speeds. On such highways the loca-tion and design would discourage most short-trip travel, access would be permitted only where it can be provided safely, and we should expect a definite concentration of driving in the higher speed brackets. Here in the top diagram is shown a possible speed distribution on such rural roads. No vehicles are shown to exceed 80 miles per hour but the elimination of all vehicles moving under 40 gives an average of 56 miles per hour.
These roads and these speeds will be evidences of the higher living standard America can have if we can apply to construc-tive ends the energies we now are devoting almost entirely to the destructive purposes of war. And one item that must accom-pany this improved living standard is a greater appreciation of the principles of highway safety, that the more of us may live.
TWO-INCH REVOLVER NOW AVAILABLE
The 2-inch detective model revolver, which has not been manu-factured since the outbreak of the war, is now available to public law enforcement agencies and guard forces of industrial plants. Because of the demand for this type of revolver, the Defense
Sup-plies Corporation, subsidiary of the Reconstruction Finance Cor-poration has arranged with Smith and Wesson and Colt's Patent
Fire Arms Manufacturing Company to produce limited supply primarily for police use. Application and order forms may be secured from the Defense Supplies Corporation, 811 Vermont Avenue, N. W., Washington, D. C., or from the International
Association of Chiefs of Police, 918 F. Street, N. W., Washington,