Monte Carlo Simulation for Long Term Performance of
Initial Public Offerings in Malaysia Stock Exchange
Nashirah Abu Bakar*, Sofian Rosbi**
* Islamic Business School, College of Business, Universiti Utara Malaysia, Kedah, Malaysia ** School of Mechatronic Engineering, Universiti Malaysia Perlis, Malaysia
DOI: 10.29322/IJSRP.9.02.2019.p8677
http://dx.doi.org/10.29322/IJSRP.9.02.2019.p8677
Abstract- The objective of this study is to develop robust statistical method in evaluating long term performance of companies that issued initial public offerings. Data of monthly return are derived from Thomson Reuters Datastream. The companies selected in this study are 16 companies that listed on Malaysia Stock Exchange issuing initial public offerings in year of 2014 and 2015. These 16 companies are categorized as sharia-compliant companies. Method implemented in this study is Fama-French model for validating long term performance of initial public offerings. The Fama-French model is validated using 36 months of data analysis. Next, this study implemented Monte Carlo Simulation method to achieve more robust value for Fama-French model. Result of Shapiro-Wilk normality test indicates all variables follow normal distributions. The Fama-French model exhibits the alpha coefficient is – 3.99 that indicated market performed better than portfolio. Monte Carlo simulation increase data sample to attain alpha coefficient that is proved is under statistical control. The implication of this study will help investors to gain better understanding of financial condition in Malaysia Stock Exchange. In addition, Monte Carlo Simulation give better estimation of parameter in regression analysis that exhibits better value that represent real economic condition in Malaysia.
Index Terms- Monte Carlo Simulation, Long Term Performance, Initial Public Offerings, Malaysia Stock Exchange
I. INTRODUCTION
With the development of Islamic capital markets, investors invest more in Islamic equity markets especially on the sharia compliant companies. As reported by Securities Commission of Malaysia out of 693 from 901 companies listed on the Malaysian Stock Exchange was sharia compliant companies. Therefore, sharia compliant companies plays key role in promoting Islamic capital market worldwide. The main objective of investors is to get high return at the tolerant risk. Hence risk must be managed effectively. According to Farid, et al., (2010) risk is defined as “without risk there is no advance” and “the higher the risk the greater the reward” are well-established truisms. Therefore, going public for a new companies is an important phase in the life cycle of a company in order to be more productively in the financial resources and physical resources.
A body of literature investigates operating performance and stock returns following the initial public offering (IPO), and tends to indicate that companies underperform after the IPO relative to their pre-IPO performance (Abu Bakar, et al., 2019; Abu Bakar and Rosbi, 2017; Abu Bakar and Rosbi, 2016; Zarafat and Vejzagic, 2014; Carter, et al., 1998). Varies methods are used to examine the long term performance of shares prices. Notably, Ritter (1991) find a decline of newly listed companies over several decades using a cumulative average adjusted returns method and buy and hold returns method. Abu Bakar, et al., (2019) evaluate the long term performance of initial public offerings for sharia compliant companies listed on the Malaysia Stock Exchange using a market adjusted cumulative abnormal returns (MACAR). Abu Bakar and Rosbi (2018) used Modern Portfolio Theory to develop efficient frontier for portfolio investment in Malaysian market. While, Goergen, et al., (2007) used buy and hold returns, cumulative abnormal returns and Fama and French three-factor returns to investigate the long-run performance of UK IPO. The Fama and French three-factor model suggests that the excess return on a broad market portfolio from the CAPM is not a complete explanation of the expected return on a portfolio in excess of the risk free rate (Black, 2006).
II. LITERATUREREVIEW
The history of Monte Carlo methods as computational method for the calculation of expectation on potentially high-dimensional domains starts in the mid-1940s with the arrival of the first programmable computers (Jackel, 2001). Therefore, Monte Carlo are tested in varies field such as engineering (Prakash and Mohanty, 2017; Farnoosh, et al., 2012) technology (Djeddou, et al., 2013) and others (Cavaliere, et al., 2003; Watzenig et al., 2011; Ghiani, et al., 2004). Currently, Monte Carlo approach is tested in the financial field. Hoesli, et al., (2006) was success implemented Monte Carlo simulations in incorporate the uncertainty of valuation parameters. Monte Carlo simulations are a very powerful way to demonstrate the basic sampling properties of various statistics in econometrics (Adkins and Gade, 2012).
Berlinger et al., (2018) formulated a valuation model and applied a Monte Carlo simulation to assess the two most important benefits arising from a pool: the interest rate savings and the reduction in the counterparty risk. They concluded that the value of a cash-pool is higher in the case of firms with large, diverse and volatile cash flows having less access to the capital markets. It is also shown that cash pooling is not the privilege of large multinational firms anymore as the initial direct costs can be easily regained within a year even in the case of small-medium enterprises, especially if the corporate cash holding is highly volatile.
Power, et al., (2015) estimate the option value of infrastructure investment, accounting for the stochastic behavior of both financial and physical (engineering) variables. They found that real-option value for infrastructure investment is substantial. It is beneficial to model jointly financial and engineering risks to better understand the timing and real-option value of infrastructure investment.
Prakash et al., (2012) propose the idea of linking the use of the Monte Carlo simulation with scenario planning to assist strategy makers in formulating strategy in the face of uncertainty relating to service quality gaps for life insurance business. They highlights which particular service quality gap attribute as risk impacts most and least for the possibility of occurrences as best case, worst case, and most likely case. Therefore, they suggested that the application of Monte Carlo simulation give impact most and least on service quality gap.
The important of this research is to fulfill the gap by investigate the performance of sharia compliant companies using a Monte Carlo approach as a unique features in the Islamic financial engineering innovation.
III. RESEARCHMETHODOLOGY
The purpose of this paper is to analyze long term performance of initial public offerings using Fama-French method. In addition, this study performs the validity of findings using Monte Carlo Simulation (MCS) that increase data sample of random variables. This paper performed normality statistical test for all variables, Fama-French model calculation and Monte Carlo Simulation (MCS).
A. Data selection and return calculation
This paper selected 16 sharia compliant companies that listed in Malaysia Stock Exchange. These companies issued initial public offerings in year of 2014 and 2015. The daily price of stock collected from Thomson Reuters Datastream. Then, the daily stock price is averaged to calculate value on monthly price. The monthly return is calculated using Equation (1).
1 ,
1
Re t t 100%
i t t
P P
P
−
−
−
= × ………. (1)
The parameters in Equation (1) are described as below:
,
Rei t : Return rate for stock i at month t,
t
P : Stock price at observation month t, and
1 t
P− : Stock price at observation month t-1.
B. Normality test for data distribution
Normality distribution is distribution function for independent, randomly generated variables. The normal probability density function of normal distribution can be represents by using Equation (2).
(
2)
(2 2)22 1 ,
2
x
f x e
µ σ
µ σ
πσ
− −
= ………. (2)
The parameters in Equation (2) are described as follows:
µ
: Expectation of variable distribution usually represents by mean value,σ
: Standard deviation of x variable,2
σ
: Variance of x variablee : Mathematical constant that irrational and transcendental number approximately equal to 2.718281828459.
C. Fama-French model for evaluating long term performance of initial public offerings
The Fama-French three-factor model is an extension of the Capital Asset Pricing Model (CAPM). The Fama-French model aims to describe stock returns through three factors: (1) market risk, (2) the outperformance of small-cap companies relative to large-cap companies, and (3) the outperformance of high book-to-market companies versus low book-to-market companies. The rationale behind the model is that high value and small-cap companies tend to regularly outperform the markets.
The mathematical representation of Fama-French three-factor model is described in Equation (3).
(
)
(
SMB)
(
HML)
pt ft p p mt ft p p pt
R −R =
α
+β
R −R +γ
+δ
+ε
……….………. (3)In Equation (2), the parameters are described as below:
pt
R : Monthly return on IPO portfolio,
ft
R : Treasury bill rate
mt
R : Monthly market return
mt ft
R −R : Market risk premium (MRP),
SMB (Small Minus Big): Historic excess returns of small-cap companies over large-cap companies,
HML (High Minus Low): Historic excess returns of values stocks (high book-to-price ratio) over growth stocks (low book-to-price ratio)
p
α
: Intercept that indicates the performance of average monthly abnormal return.A positive value of
α
p indicates the market performs better than portfolio selection. Meanwhile, negative value ofα
p indicates theportfolio performs better than market.
D. Monte Carlo simulation
The Monte Carlo method is a probabilistic technique based on generating a large number of random samples. Simulations are particularly useful in monitoring the output variables with large dataset. Monte Carlo Simulation (MCS) capable of controlling the statistical process and variability of a complex system.
Monte Carlo simulation uses repeated random sampling to simulate data for a given mathematical model and evaluate the outcome. In the same time, Monte Carlo Simulation (MCS) is a technique that involves using random numbers and probability to solve problems.
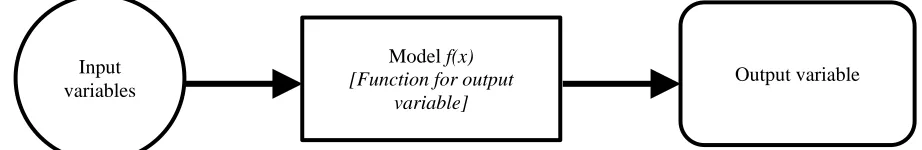
[image:3.612.88.549.637.712.2]MCS is categorized as a sampling method because the inputs are randomly generated from probability distributions to simulate the process of sampling from an actual population. Figure 1 indicates the process flow for Monte Carlo Simulation. The first step is all input variables is set to follow probability distribution. In this study, normal distribution is selected for all variables. Next, the outcome variable (output variable) will be calculated using the input variable with function of model. The third stage, the outcome variable need to be evaluate under statistical test. In this study, the process capability is implemented to evaluate the effectiveness of Monte Carlo Simulation in developing better alpha coefficient (output variable).
Figure 1: Monte Carlo Simulation Procedure Model f(x)
[Function for output variable]
Input
IV. RESULTANDDISCUSSION
The main objective of this paper is to evaluate long term performance of companies that issued initial public offering in year of 2014 and 2015. The evaluation method is using Fama-French three factor method. In developing robust finding, this study implemented Monte Carlo statistical method in developing large data set in producing reliable statistical model.
A. Selection of data
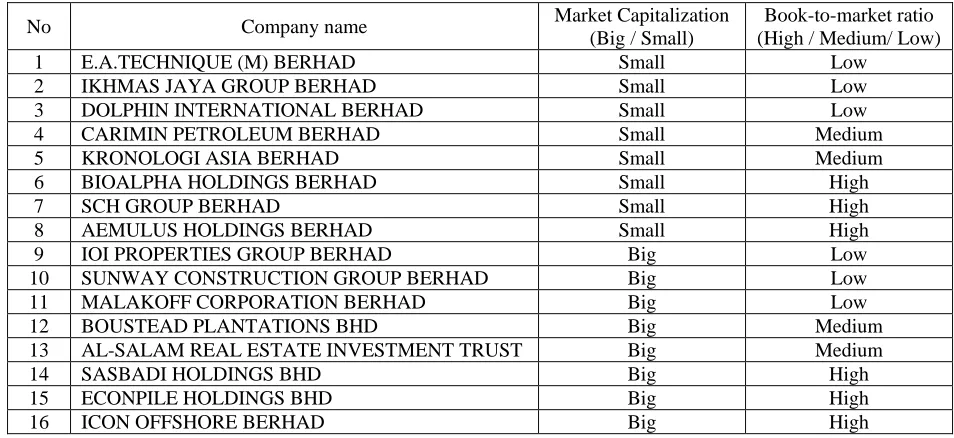
[image:4.612.66.543.216.435.2]This study selected 16 companies that issued Initial Public Offerings (IPO) in year of 2014 and 2015. The 16 companies are sharia compliant companies that listed in main market of Malaysia Stock Exchange. In developing Fama-French model, the 16 companies are classified into 6 groups as listed in Table 1. The classification is divided according to market capitalization and book-to-market value.
Table 1: Classification of companies based on market capitalization and book-to-market ratio
No Company name Market Capitalization
(Big / Small)
Book-to-market ratio (High / Medium/ Low)
1 E.A.TECHNIQUE (M) BERHAD Small Low
2 IKHMAS JAYA GROUP BERHAD Small Low
3 DOLPHIN INTERNATIONAL BERHAD Small Low
4 CARIMIN PETROLEUM BERHAD Small Medium
5 KRONOLOGI ASIA BERHAD Small Medium
6 BIOALPHA HOLDINGS BERHAD Small High
7 SCH GROUP BERHAD Small High
8 AEMULUS HOLDINGS BERHAD Small High
9 IOI PROPERTIES GROUP BERHAD Big Low
10 SUNWAY CONSTRUCTION GROUP BERHAD Big Low
11 MALAKOFF CORPORATION BERHAD Big Low
12 BOUSTEAD PLANTATIONS BHD Big Medium
13 AL-SALAM REAL ESTATE INVESTMENT TRUST Big Medium
14 SASBADI HOLDINGS BHD Big High
15 ECONPILE HOLDINGS BHD Big High
16 ICON OFFSHORE BERHAD Big High
B. Normality distribution of data
This section describes the normality checking for each of variables in Fama-French model. The independent variable is return with respect to risk free rate. Meanwhile the three independent variables are market risk premium (MRP), average return for Small-Minus-Big (SMB) and average return for High-Minus-Low (HML). This study using Shapiro-Wilk normality testing to validate the normality of data distribution.
Table 2 indicates the normality testing for all variables in Fama-French model. Table 2 indicates probability value (p-value) for all variables are larger than 0.05 (significant level). Therefore, this study failed to reject null hypothesis of Shapiro-Wilk normality testing. As the conclusion, all four variables in Fama-French model are follow normal distribution.
Table 2: Normality statistics variables in Fama-French model
Variable name Type of variable in
Fama-French model Statistics
Probability value
(p-value) Data distribution
Return-Risk free rate Outcome variable 0.982 0.825 Normal
Market Risk Premium (MRP) Explanatory variable 0.992 0.996 Normal
SMB Explanatory variable 0.958 0.191 Normal
[image:4.612.44.572.604.723.2]C. Regression analysis of Fama-French model
This study evaluates the long term performance of initial public offerings using Fama-French method. Table 3 shows the value of coefficients for Fama-French model calculated using regression analysis. The value of coefficient for y-intercept is -3.399. This value indicates portfolio performed less than market.
Table 3 also indicates the variation inflation factor (VIF) to evaluate multi-collinearity among predictors (independent variables). All of the three variables indicate VIF is close to 1 that show the predictor is not correlated with other variables. Therefore, there is no multi-collinearity problem in regression model.
Next, Table 4 indicates the robust statistical analysis for validating model. Table 4 indicates R-squared value 0.466. This value indicates 46.6 % indicates that the model explains all the variability of the response data around its mean. In addition, the p-value of F-statistics is 0.000 that is less than 0.05 of chosen alpha. This result indicates this model fits the data better than intercept only model. In the same time, the Durbin-Watson statistics value is 1.609. The Durbin–Watson statistic is a test statistic used to detect presence of autocorrelation at lag 1 in the residuals (prediction errors) from a regression analysis. Autocorrelation is the similarity of a time series over successive time intervals. Table 4 indicates the value of Durbin-Watson is in range of 1.5 and 2.5 that shows there is no autocorrelation.
Table 3: Value for regression analysis of Fama-French model (Independent variable is excess return)
Regression analysis for Fama French Method
Parameter Value VIF value
Coefficient (y-intercept) -3.399
Market Risk Premium (MRP) 0.497 1.048
Small Minus Big (SMB) 0.328 1.013
[image:5.612.121.491.282.388.2]High Minus Low (HML) 0.581 1.040
Table 4: Robust statistical analysis for reliability of model
Statistical parameter Value
R-squared 0.466
F-statistics 9.293
Probability value (p-value) of F-statistics 0.000
Durbin-Watson statistics 1.609
D. Alpha coefficient value analysis
This section evaluates the normality and reliability of alpha coefficient value in Fama-French model that is important variable. The negative alpha coefficient value indicates the portfolio perform less than benchmark market. This study calculated alpha coefficient value based on data for excess return (ER), market risk premium (MRP) , small minus big (SMB) and high minus low (HML). The alpha coefficient is re-arranged from Fama-French equation to Equation (4).
(
)
(
)
(
SMB)
(
HML)
p Rpt Rft p Rmt Rft p p pt
α
= − −β
− −γ
−δ
−ε
……… (4)Figure 2 shows the process capability of alpha coefficient. The sample mean is -3.39945 that indicate portfolio performed less than benchmarked market. Standard deviation for within sample is 2.90258 shows the data distribution of alpha coefficient. Main function of process capability is to make sure all variables under statistical process control. The important parameters in process capability are
pk
C andPpk. In this analysis, value of Cpk is 1.00 and value of Ppkis 0.87. Small difference between Cpk andPpk which is 0.13
Figure 2: Process capability of alpha coefficient 4 0 -4 -8 -12 LSL USL LSL -12.6 Target * USL 5.3
Sample Mean -3.39945 Sample N 36 StDev (Within) 2.90258 StDev (O v erall) 3.34383
Process Data
C p 1.03 C PL 1.06 C PU 1.00 C pk 1.00
Pp 0.89 PPL 0.92 PPU 0.87 Ppk 0.87 C pm * O v erall C apability Potential (Within) C apability
PPM < LSL 27777.78 PPM > USL 0.00 PPM Total 27777.78 O bserv ed Performance
PPM < LSL 762.76 PPM > USL 1362.63 PPM Total 2125.39 Exp. Within Performance
PPM < LSL 2966.11 PPM > USL 4638.92 PPM Total 7605.03 Exp. O v erall Performance
Within Overall
Process Capability of Alpha
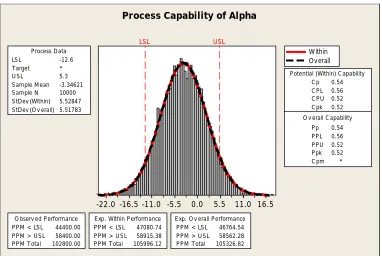
D. Monte Carlo analysis to validate the reliability for alpha coefficient value
This study performed Monte Carlo Simulation (MCS) to obtain better statistical control in producing output variable (alpha coefficient). This study developed 10000 data using Monte Carlo Simulation method for each of variables that determine alpha coefficient value. Figure 3 shows process capability of alpha coefficient with Monte Carlo Simulation (MCS). In this analysis, value of Cpk is 0.52 and value of Ppkis 0.52. The difference between Cpk andPpk is almost zero that indicates alpha coefficient output is
considered as a variable in statistical control condition. The Monte Carlo Simulation increased efficiency of statistical control for alpha coefficient with reducing the difference between Cpk andPpk.
Figure 3: Process capability of alpha coefficient with Monte Carlo Simulation
16.5 11.0 5.5 0.0 -5.5 -11.0 -16.5 -22.0 LSL USL LSL -12.6 Target * USL 5.3
Sample Mean -3.34621 Sample N 10000 StDev (Within) 5.52847 StDev (O v erall) 5.51783
Process Data
C p 0.54 C PL 0.56 C PU 0.52 C pk 0.52
Pp 0.54 PPL 0.56 PPU 0.52 Ppk 0.52 C pm * O v erall C apability Potential (Within) C apability
PPM < LSL 44400.00 PPM > USL 58400.00 PPM Total 102800.00 O bserv ed Performance
PPM < LSL 47080.74 PPM > USL 58915.38 PPM Total 105996.12 Exp. Within Performance
PPM < LSL 46764.54 PPM > USL 58562.28 PPM Total 105326.82 Exp. O v erall Performance
Within Overall
[image:6.612.116.498.474.730.2]V. CONCLUSION
The objective of this study is to evaluate the long term performance of initial public offering using Fama-French method. Next, this study implemented Monte Carlo Simulation to develop process capability of alpha coefficient in Fama-French model. Main findings of this study are:
(a) The data of monthly return are collected from Thomson Reuters Datastream. The Fama-French model is selected in evaluating long term performance of initial public offerings. Shapiro-Wilk normality test indicates probability value (p-value) for all variables are larger than 0.05 (significant level). Therefore, all variables in Fama-French model are follow normal distribution.
(b) The regression of analysis for FamaFrench model is represented by below equation. The value of coefficient for yintercept is -3.399. This value indicates portfolio performed less than market.
Expected excess return= −3.399+0.497 (Market Risk) + 0.328 (SMB) + 0.581 (HML)
(c) The sample mean for alpha coefficient is -3.39945 that indicate portfolio performed less than benchmarked market. Standard deviation for within sample is 2.90258. Main function of process capability is to make sure all variables under statistical process control. The important parameters in process capability are Cpk andPpk. In this analysis, value of Cpk is 1.00 and value of Ppkis
0.87. Small difference between Cpk andPpk which is 0.13 indicates alpha coefficient output in statistical control.
(d) This study performed Monte Carlo Simulation (MCS) to obtain better statistical control in producing output variable (alpha coefficient). This study developed 10000 data using Monte Carlo Simulation method for each of variables that determine alpha coefficient value. In this analysis, value of Cpk is 0.52 and value of Ppkis 0.52. The difference between Cpk andPpk is almost
zero that indicates alpha coefficient output is considered as a variable in statistical control condition. The Monte Carlo Simulation increased efficiency of statistical control for alpha coefficient with reducing the difference between Cpk andPpk.
The implication of this study will help investors to gain better understanding of financial condition in Malaysia Stock Exchange. In addition, Monte Carlo Simulation give better estimation of parameter in regression analysis that exhibits better value that represent real economic condition in Malaysia.
REFERENCES
Abu Bakar, N. and Rosbi, S. (2016). Long Term Performance of Islamic Share Price for Initial Public Offerings (IPOs) in Malaysia: Evidence from Sharia-Compliant Companies Listed on the Malaysian Stock Exchange (2006-2010). International Journal of Management Science and Business Administration, 2(6), 55-66.
Abu Bakar, N. and Rosbi, S. (2017). Impact of the Corporate Structure and Sharia-Compliant Status to Average Degree of IPO Underpricing in Malaysia Market. Advanced Science Letters, 23(9), 8758-8761.
Abu Bakar, N. and Rosbi, S. (2018). Efficient frontier analysis for portfolio investment in Malaysia stock market. Science International, 30(5), 723-729.
Abu Bakar, N., Rosbi, S. and Uzaki, K. (2019). Evaluation of Long Term Performance for Initial Public Offerings using Market Adjusted Cumulative Abnormal Returns (MACAR): A Case Study of Islamic Finance in Malaysia. International Journal of Advances in Scientific Research and Engineering, 5(1), 51-58.
Adkins, L. C., Gade, M. N. (2012). Monte Carlo Experiments Using Stata: A Primer with Examples, in Dek Terrell, Daniel Millimet (ed.) 30th Anniversary Edition (Advances in Econometrics, Volume 30) Emerald Group Publishing Limited, pp.429 – 477
Berlinger, E., Bihary, Z. and Walter, G. (2018). Corporate cash-pool valuation: a Monte Carlo approach. Studies in Economics and Finance, 35(1), 153-162.
Black, A.J. (2006). Macroeconomic risk and the Fama‐French three‐factor model. Managerial Finance, 32(6), 505-517.
Carter, R.B., Dark, F.H. and Singh, A.K. (1998). Underwriter Reputation, Initial Return and Long-Run Performance of IPO stocks.
Cavaliere, V., Cioffi, M., Formisano, A. and Martone, R. (2003). Robust design of high field magnets through Monte Carlo analysis.
COMPEL - The international journal for computation and mathematics in electrical and electronic engineering, 22(3), 589-602.
Djeddou, M., Zeher, H. and Nekachtali, Y. (2013). Yet another TOA estimation technique for IR-UWB. COMPEL: The International Journal for Computation and Mathematics in Electrical and Electronic Engineering, 33(1/2), 286-297.
Farid, D., Meybodi, A.R. and Mirfakhraddiny, S.H. (2010). Investment risk management in Tehran Stock Exchange (TSE) using technique of Monte Carlo Simulation (MCS). Journal of Financial Crime, 17(2), 265-278.
Farnoosh, R., Nabati, P. and Hajirajabi, A. (2012). Parameters estimation for RL electrical circuits based on least square and Bayesian approach. COMPEL - The international journal for computation and mathematics in electrical and electronic engineering, 31(6), 1711-1725.
Ghiani, E., Locci, N., Muscas, C. and Sulis, S. (2004). Uncertainty estimation for DSP‐based power quality measurements. COMPEL - The international journal for computation and mathematics in electrical and electronic engineering, 23(1), 92-103.
Goergen, M., Khurshed, A. and Mudambi, R. (2007) The long-run performance of UK IPOs: can it be predicted?. Managerial Finance, 33(6), 401-419.
Hoesli, M. and Jani, E. and Bender, A. (2006). Monte Carlo simulations for real estate valuation. Journal of Property Investment & Finance, 24(2), 102-122.
Jackel, P. (2001) Monte Carlo Methods in Finance, available at:
http://inis.jinr.ru/sl/M_Mathematics/MV_Probability/MVspf_Stochastics%20in%20finance/Jaeckel%20Monte-Carlo.pdf
Power, G.J., Tandja M. C. D., Bastien, J. and Grégoire, P. (2015). Measuring infrastructure investment option value. The Journal of Risk Finance, 16(1), 49-72.
Prakash, A. and Mohanty, R.P. (2017). DEA and Monte Carlo simulation approach towards green car selection. Benchmarking: An International Journal, 24(5), 234-1252.
Prakash, A., Jha, S.K. and Mohanty, R.P. (2012). Scenario planning for service quality: a Monte Carlo simulation study. Journal of Strategy and Management, 5(3), 331-352.
Ritter, J.R. (1991). The Long Run Performance of Initial Public Offerings. Journal of Finance, 46(1):3-27.
Watzenig, D., Neumayer, M. and Fox, C. (2011). Accelerated Markov chain Monte Carlo sampling in electrical capacitance tomography. COMPEL - The international journal for computation and mathematics in electrical and electronic engineering, 30(6), 1842-1854.