Comparative Analysis of Drop Tail, Red and NLRED
Congestion Control Algorithms Using NS2 Simulator
Obinna, Eva. N.*, Kabari, L. G. **
*
Computer Science, Ignatius Ajuru University of Education **
Computer Science, Ignatius Ajuru University of Education
DOI: 10.29322/IJSRP.8.8.2018.p8069
http://dx.doi.org/10.29322/IJSRP.8.8.2018.p8069
Abstract- Congestion in a network may occur when the load on the network is greater than the capacity of the network and consequently, performance degrades. Congestion control is a technique and mechanisms that can either prevent congestion before it happens, or remove congestion after it has happened. This work presents a comparative analysis of Drop Tail, RED and NLRED congestion control algorithm and performed a simulation experiment to show their relative effectiveness. The experiment was done using NS2 simulator on the basis of End-to-End Delay, Throughput, Packet Drop, and Packet Delivery Ratio in a wired network. The simulation result showed that NLRED performs best in high congestion network, while in low cohesive network, Drop Tail gives a good result. Drop Tail, RED and NLRED was also analysed in real audio traffic and the entire results showed that in congested network, NLRED and RED are better while in low congested network Drop Tail is better. This is because in heavy congested network, congestion avoidance mechanism aids the network to gain better performance while in low congested network unnecessary computation avoidance mechanisms degrades the performance of the network. If parameters are set effectively in RED, it will be the best queuing mechanism for that particular network. However, it is of great importance to know which congestion control mechanism is suitable for each network and traffic.
Index Terms- Congestion, Congestion Control Algorithm, Drop Tail, RED, NLRED, Networks.
I. INTRODUCTION
ongestion is an important issue that can arise in packet switched network. Congestion is a situation in communication networks in which too many packets are present in a part of the subnet performance degrades. Congestion in network may occur when the load on the network is greater than the capacity of the network performance degrades sharply when too many traffic is offered. Techniques and mechanisms that can either prevent congestion before it happens, or remove congestion, after it has happened is known as congestion control
[14]. Mechanisms that controls congestion are divided into two categories. Category one prevents congestion from happening and category two removes congestion after it has taken place. The different types of congestion control mechanisms are (Random Early Detection (RED), Drop Tail, Nonlinear Random Early Detection (NLRED), Weighted Random Early Detection (WRED), Class Based Weighted Random Early Detection
(CBWRED), Random Exponential Marking (REM), Stochastic Fair Queue (SFQ), Flow Random Early Drop (FRED), and Stabilized Random Early Detection (SRED). Though there are other variations of congestion control mechanisms, so it is important to choose a suitable active queue management technique in every network.
[7] submitted his dissertation in which the three mechanisms Drop Tail (DT), Early Random Drop (ERD) and Multithreshold Adaptive Early Random Drop (MTAERD) are compared using a Java framework and outcomes are showing the total improvement in the quality of service that can be obtained by the mechanisms over their non-adaptive supplements. One approach in this area was given by [4], in which they replaced RED based on linear packet dropping function by NLRED which is based on nonlinear quadratic function. NLRED is gentler than RED which improves the performance. [5] compare the performance of RED and adaptive RED from the viewpoint of nonlinear dynamics. Their simulation results confirm that adaptive RED performs better than RED. [1] proposed a new improved algorithm ARED to stabilize the queue length and avoid oscillation. [6] presented a survey of RED, GRED, ARED and DRED for congestion avoidance mechanism and measured their performances on the basis of different metrics such as delay, throughput, packet loss and average queue length.
exponentially weighted moving average of the queue length which it used as a congestion detection mechanism [2]. NLRED is a queue management algorithm that encourages the router to operate in a range of average queue sizes rather than a fixed one. When its load is heavy and the average queue size approaches the predetermined maximum threshold, which means the queue size may soon get out of control. NLRED allows more aggressive packet dropping to back off from it. [8] proposed a nonlinear RED active queue management scheme, with the proposed nonlinear packet dropping function, packet dropping changes according to the type of the load. By simulation, it can be concluded that NLRED achieves a more reliable throughput than any other queuing mechanism.
This work aimed at doing a comparative analysis of Drop Tail, RED and NLRED congestion control algorithm/mechanisms and performing their simulation experiment to show their relative effectiveness using NS2 simulator. The comparative analysis will be done on the basis of different performance metrics such as end –to-end delay, throughput, packet drop and packet delivery ration using N2.
NS2 is a discrete event simulator targeted at networking research. Ns provides substantial support for simulation of TCP, routing, and multicast protocols over wired and wireless (local and satellite) networks [13]. Ns began as a variant of the REAL network simulator in 1989 and has evolved substantially over the past few years. In 1995 ns development was supported by DARPA via the VINT project at LBL, Xerox PARC, UCB, and USC/ISI. Currently ns development is support via DARPA with SAMAN and via NSF with CONSER, both in collaboration with other researchers, including ACIRI. Ns has always included substantial contributions from other researchers, including wireless code from the UCB Daedelus and CMU Monarch projects and Sun Microsystems.
II. CONGESTION CONTROL ALGORITHM/ MECHANISM
Congestion control is a technique and mechanisms that can either prevent congestion before it happens, or remove congestion, after it has happened. Here we will be discussing three types of congestion control algorithm/mechanisms which are; Drop Tail, RED and NLRED.
A. Drop Tail
Drop Tail is a simple queue management algorithm used by network schedulers in network equipment to decide when to drop packets [12]. With drop Tail, when the queue is filled to its maximum capacity, the newly arriving packets are dropped until the queue has enough room to accept incoming traffic. Its name arises from the effect of the policy on incoming packets. Once a queue has been filled, the router begins discarding all additional datagrams, thus dropping the tail of the sequence of packets. The loss of packets causes the TCP sender to enter a slow-start, which reduces throughput in that TCP session until the sender begins to receive acknowledgements again and increases its congestion window.
B. Random Early Detection (RED)
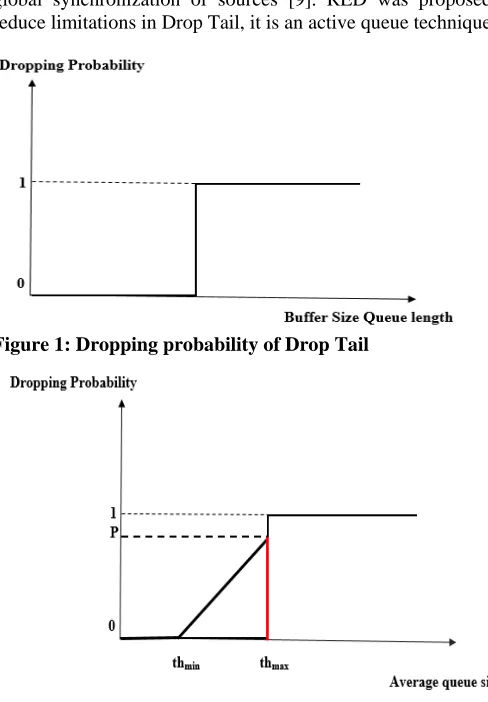
[image:2.612.317.561.156.507.2]RED is a type of congestion control algorithm/mechanism that takes advantage of TCP’s congestion control mechanisms and takes proactive approach to congestion [11]. RED drops packets with non-zero drop probability after the average queue size exceeds a certain minimum threshold, it doesn’t wait for the queue to be completely filled up. Its objectives are to provide high link utilization, remove biases against busty sources, attenuate packet loss and queuing delay, and reduce the need of global synchronization of sources [9]. RED was proposed to reduce limitations in Drop Tail, it is an active queue technique.
[image:2.612.321.544.185.318.2]Figure 1: Dropping probability of Drop Tail
Figure 2: Dropping probability of RED
Linearly with average queue size, the dropping probability varies and the average queue length lies between minimum threshold Tmin and maximum threshold Tmax, then dropping probability lies from 0 to p within the range. Packets starts dropping as the average queue size increases and the dropping probability is 0 from the beginning. When the dropping probability becomes 1 and the average queue size crosses the maximum threshold, all packets are dropped.
C. Non Linear Random Early Detection (NLRED)
approaches the maximum threshold Tmax, this is used as an indicator that the queue size could soon be full, so NLRED will first drop more aggressive packets, which means more heavy packets. Also, it is less parameter sensitive. NLRED obtains much stable throughput as compared to RED. Also, the packet dropping probability of RED will be always greater than that of NLRED due to which at same Pmax value NLRED is gentler than RED for all traffic load.
Figure 3: Dropping probability of NLRED and RED
III. PERFORMANCE METRICS
The primary metrics in our simulations that can work as basic building blocks for calculating other metrics are; Throughput, End-to-End delay, Packets Drop and Packet Delivery Ratio.
A. Throughput
The main features of performance measure and commonly used is throughput. It measures how fast the beneficiary can get a particular measure of information sent by the sender. Also, throughput is simply the proportion of the aggregate information got to the end-to-end delay. Total throughput is dependent on bottleneck bandwidth and the fairness among different flows is illustrated with the aid of throughput.
B. End-to-End Delay
The time slipped when a packet moves from sender to receiver is called delay. The characteristics of delay can be indicated in various ways, which are; average delay, variance delay (jitter) and delay bound. When the value for delay is large, the bandwidth will be high and it will be more difficult for transport layer to maintain.
C. Packet Drop
When size queue increases with the maximum capacity and packets starts dropping, it is called packet drop. Packets loses in network when queue in the network node increases. The quantity of packet drop during steady state is a major attribute of congestion control. Sustaining high bandwidth is more difficult and sensitivity to loss of packets for higher rate of packet drop.
D. Packet Delivery
The proportion of the total packets sent to the total packet received is called packet delivery and its mathematical
expression is; PDR=T1÷T2 where T1 is the Total number of data packets received from each destination and T2 is the Total data packets formed by each source.
IV. SIMULATION
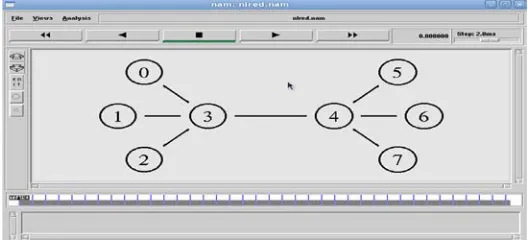
The network topology used here is the classic dum-bell, which is illustrated in figure 4. The classic dum-bell is a known example where different types of traffic share a bottleneck link. TCP (FTP application in particular), UDP flows (CBR application in particular) and real audio traffic are chosen as typical traffic patterns. Here we will be using three different mechanisms which have different behavior for different network configuration and traffic pattern. Most importantly, the task in designing the simulation is to select parameters (bandwidth, queue limit, packet size, etc.) and a typical set of network topology. A simple topology is used in our simulation where different flows share a bottleneck between the two routers (3.4). The packets sent from sources queue to the queue of router 3 and wait for transmitting. If the sender keeps sending and the queue overloaded, then congestion occurs.
This work focuses on congestion and by this simple topology we can easily create congestion by setting different parameters accordingly and analyze the behavior of the three congestion control mechanisms. If we increase the network size or change its topology, then results may change depending on the amount of congestion and bandwidth at any bottleneck link of the network. If bandwidth is large enough to allow the transmission of all the flows, then no need of applying any active complex mechanism. Simple drop-tail would give the best result. Else if bandwidth is low compared to the amount of congestion, then RED or NLRED would give good performance. In this research work, there are total four experiments that have been performed, and then, the simulation results have been analyzed through a thorough study.
Figure 4. Classic Dum-bell Network Topology
A. Experiment 1.
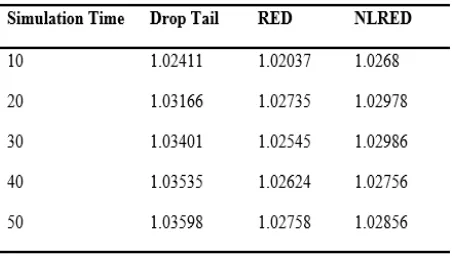
setting in Drop Tail is easy. For RED, we have to select values for minth and maxth. Also, some other remaining parameters such as maximum probability of drop are taken as 0.5 bytes; exponential weighted moving normal consistent is 0.001. Calculations of average queue size are in bytes. Setting queue in bytes to false demonstrate average queue size is in packets (not in bytes). Gentle RED mode is set to be false indicates gentle mode is OFF. Average size of a packet touching the router is likewise made equivalents to 1000. We have chosen such values of parameters just to create a congested network as 1.7 MB is very low bandwidth in comparison with packet size and queue size (Figures 5, 6, 7, 8; Tables 1, 2, 3, 4).
Figure 5: Comparing the variation of throughput for Drop Tail, RED, and NLRED
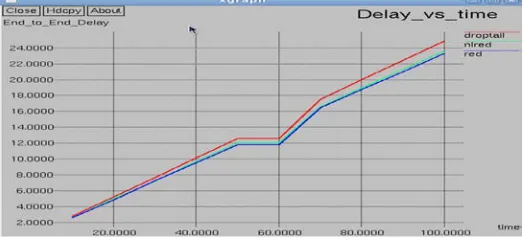
[image:4.612.35.301.209.318.2]Figure 6: Comparing the Variation of End-to-End Delay for Drop Tail, RED, and NLRED
Figure 7: Comparing Variation of Packet Drop for Drop Tail, RED, and NLRED
B. Experiment 2
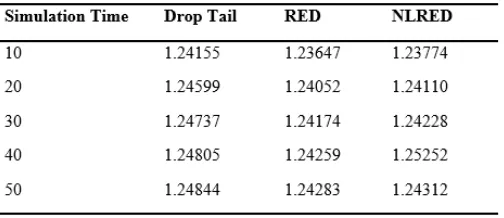
In this experiment, the same simple dumb-bell topology in wired network is being used. But, bandwidth at bottleneck link 3–4 is being increased from 1.7 to 10 MB. It means congestion in the network is decreased. Remaining parameters such as CBR flow rate, packet size and queue limit are kept same. Also, parameters of RED and NLRED (such as minimum threshold, maximum threshold, weight, etc.) remain unchanged. Here, all other parameter values are same except the bandwidth just to check the performance of all the three mechanisms in non-congested network (Figures 9, 10, 11, 12; Tables 5, 6, 7, 8).
[image:4.612.334.546.557.672.2]Figure 9: Comparing the variation of throughput for Drop Tail, RED, and NLRED
C. Experiment 3
Here simple dumb-bell topology is used in wired network. There are three nodes at each side of bottleneck link 3–4. Node 0 is acting as a RA source to send real audio traffic and node 6 as dump, while node 2 is acting as TCP source to send FTP traffic and node 6 as sink. Bandwidth at bottleneck link 3–4 is 1.7 MB. Packet size is 1000 bytes, CBR flow rate is 1Mbps, whereas queue limit is 15 packets. All four end-to-end delay, performance metrics throughput, PDR and packet drop are same for all the three queues, as the bandwidth of the bottleneck link is so small 1.7 as compared to audio traffic. So we are getting same readings for all queues Drop-Tail, RED and NLRED. In this experiment, the values are chosen same as in experiment-1, but instead of CBR and FTP traffic we are using real audio traffic just to check
the performance in a network where packets are highly aggressive and bandwidth is not sufficient to send the packets.
Figure 10: Comparing the Variation of End-to-End Delay for Drop Tail, RED, and NLRED
Figure 11: Comparing Variation of Packet Drop for Drop Tail, RED, and NLRED
D. Experiment 4
[image:5.612.314.576.95.214.2]Simple dumb-bell topology is used in wired network. There are three nodes at each side of bottleneck link 3–4 where node 0 is acting as a RA source to send real audio traffic and node 6 as RA dump, while node 2 is acting as TCP source to send FTP traffic and node 6 as sink. Bandwidth at bottleneck link 3–4 is now increased to 10 MB. CBR flow rate, packet size and queue limit are kept same as in experiment 3. Here, all other parameters are same as in experiment 3, but the bandwidth is chosen in such a way to provide a sufficient amount of width to the packets to pass on (Figures 13, 14, 15, 16; Tables 9, 10, 11, 12).
[image:5.612.314.577.539.655.2]Figure 13: Comparing the variation of throughput for Drop Tail, RED, and NLRED
Figure 15: Comparing Variation of Packet Drop for Drop Tail, RED, and NLRED
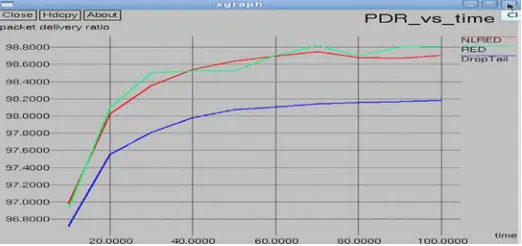
Figure 16: Comparing Variation of Packet Delivery Ratio (PDR) for Drop Tail, RED and NLRED
V. CONCLUSION
In computer network, it is of great importance to know which congestion control mechanism is suitable for each network and traffic. After the analysis of Drop Tail, RED, and NLRED on the basis of the simulation result, it was proven that in a congested network NLRED maintains good link utilization and small queue size. Its performance is better than RED and Drop Tail. It maintains high throughput, low packet drop, low delay, and high packet delivery ratio than Drop Tail and RED. Significantly, fairness between flows achieved with NLRED is better than that achieved from Drop Tail and RED. NLRED is not much sensitive to parameter like maxp. Congested networks performance of NLRED holds better than that of Drop Tail and RED, though Drop Tail performance is better than RED.
[image:7.612.51.283.311.415.2]avoid congestion will decrease the overall performance. By comparing the network packet drop, delay and packet delivery ratio in both the traffics, it could be stated that RED uses the network bandwidth less effectively than Drop-Tail. When congestion is high, NLRED and RED perform better than Drop Tail. However, in every case NLRED performed better than RED. This is because the uniform packet drop distribution from the random early packet drop behavior of RED will result in more application packet losses.
REFERENCES
[1] J. Chen, C. Hu, Z. Ji, “An improved ARED algorithm for congestion control of network transmission”. Math Probl Eng 2010:329035.
doi:10.1155/2010/329035
[2] S. Floyd, and V. Jacobson, “Random early detection gateways for congestion avoidance”. IEEE/ACM Trans. On Networking, vol. 1, no. 4, pp. 397-413, August 1993.
[4] W. Hui, L. Xiao-Hui, Z. Kai-Yu, X. Nin, L. Hui, “On the scalable fairness and efficient active queue management 399 of RED”. Int J Commun Netw Syst Sci 2(01):73–83. doi:10.4236/ijcns.2009.21009
[5] K. Jiang, X. Wang, Y. Xi, “Nonlinear analysis of RED—a comparative study”. Chaos Solitons Fractals 21(5):1153–1162, 2004.
[6] V. Katiyar, A. C. Jain, “A survey on red and some it’s varients in congestion control mechanism”. Int J Eng Manage Res 4(4):184–188, 2014.
[7] M.H.E. Mohamed, “Some active queue management methods for controlling packet queueing delay. Design and performance evaluation of some new versions of active queue management schemes for controlling packet queueing delay in a buffer to satisfy quality of service requirements for real- time multimedia applications”. Doctoral dissertation, University of
Bradford. 2010.
[8] K. Zhou, K.L.Yeung, V.O. Li, “ Nonlinear RED: a simple yet efficient active queue management scheme” . Comput Netw 50(18):3784–3794. 2006.
[9] S. Rastogi, H. Zaheer, “ Comparative analysis of queuing mechanisms: Droptail, RED and NLRED” Soc. Netw. Anal. Min (2016) 6:70 DOI 10.1007/s 13278-016-0382-5.
[10] Drop Tail and RED – Two AQM Mechanisms-roman 10 retrieved from www.roman10.net>2011/11/10>drop-t... on 16/06/2018.
[11] Random Early Detection (RED)? – CiscoNET retrieved from cisconet.com>QoS>QoS General on 16/06/2018.
[12] Tail drop – Wikipedia retrieved from
https://en.m.wikipedia.org>wiki>Tail_... on 16/06/2018.
[13] The Network Simulator – ns – 2 retrieved from https://www.isi.edu>nsnam on 16/06/2018.
[14] What is Congestion control? Describe the congestion control Algorithm commonly used – Computer Notes retrieved from
ecomputernotes.com>what-is-congestion on 15/06/2018.
AUTHORS
First Author – Obinna, Eva N., Ignatius Ajuru University of Education, Rivers State Nigeria, [email protected].
Second Author – Kabari, Ledisi G., Ignatius Ajuru University of Education, Rivers State Nigeria, [email protected].
Correspondence Author – Obinna, Eva N.,