Classification and Grading Rice Using Multi-Class SVM
Harpreet Kaur
*, Baljit Singh
***
Computer, Scienec and Engineering, P.T.U, Rayat Institute of Engineering and Technology Railmajra, Punjab, India
**
Computer Science and Engineering, P.T.U, Baba Banda Singh Bahadur Engineering College, Fathegarh Sahib, Punjab India
Abstract- This paper proposes machine algorithm to grade (Premium, Grade A, Grade B and Grade C) the rice kernels using Multi-Class SVM. Maximum Variance method was applied to extract the rice kernels from background, then, after the chalk has been extracted from rice. The percentage of Head rice, broken rice and Brewers in rice samples were determined using ten geometric features. Multi-Class SVM classified the rice kernel by examining the Shape, Chalkiness and Percentage of Broken (Head Rice, Broken and Brewers) kernels. The SVM classify accurately more than 86% .Based on the results, it was concluded that the system was enough to use for classifying and grading the different varieties of rice grains based on their interior and exterior quality.
Index Terms- Support Vector Machine, Binarization, Kernel, Threshold, Machine Vision, Segmentation.
I. INTRODUCTION
ice is grown in many regions across India. India is the second leading producer of rice in the entire world, preceded only by China. In Southeast Asia alone, rice is staple food for 80% of the population. As countries reach self-sufficiency in rice production, the demand by the consumer for better quality rice has increased. The Quality of rice is based upon many parameters such as color, size, shape and no of broken kernels. Rice Quality inspection by humans is neither objective nor efficient. In view of this automated rice quality inspection using machine vision is desirable. Recently, machine vision and image processing are widely used in biological and agricultural research with improvement of computer technology a significant reduction of cost of hardware and software of digital imaging. Many studies have applied image processing to grain quality inspection. Machine vision (MV) is a rapid, economic, consistent and objective inspection and evaluation technique [1].
There are many researches applied machine vision to estimate rice appearance quality inspection [2-16]. Sapirstein et al. (1987)employed the image processing to identify grains such as wheat, oats and rye using the parameters such as area, length, width, perimeter, color and shape [2]J.Aulakh et al.(2012) find the percentage purity of hulled rice grain sample by image processing technique[3]. K.Ding et al., 1994 applied the back propagation neural classifier for food shape classification [4]. J.A. Patindol, 2000 suggested grading criteria for rice in terms of defects found in rice samples such as chalky, broken, immature and damaged kernels [5]. T.Brosnan et al., 2003 reported that quality of rice is based on variety of properties such as size, shape, color, chalkiness and no. of broken rice kernels, color and chalkiness [6]. Guzman et al., 2008 investigated the use of machine vision system and multilayer neural networks to classify
Philippine rice grains including shape and size parameters [7]. C.Agustin et al., 2008 suggested probabilistic neural network to sort rice kernels into head rice, broken rice and brewer’s kernels [8]. Q.Yao et al., 2009 developed an automatic system to inspect the rice appearance quality including rice chalkiness and shape [9]. L.Guangrong, 2011 proposed a method to calculate the chalky area ratio and chalky grain rate and then automatic detection of chalk degree has been realized [10]. S.Shantaiya et al., 2010 used the morphological and color features to identify different varieties of rice using feed forward neural network [11]. B.Verma, 2010 used the back propagation through time neural to sort the rice into chalky, sound, and broken kernels [12]. M. Yao et al., 2010 develop an inspection system of rice exterior quality ( head rice rate, chalk rice, crackle rice) based on computer vision [13].
Burges et al.,1998 reported that the Support Vector Machine (SVM) is a new pattern classifier, set of supervised generalized linear classifiers that have often been found to provide higher classification accuracies than other widely used pattern classification techniques, such as multilayer perceptron neural networks[14]. S Noble, 2006 reported that Support Vector Machine (SVM) is a computer algorithm that learns by example to assign labels to objects [15]. M. Galar et al., 2011 suggested the ensemble methods for binary classifiers in multi-class problems, one-vs.-one and one-vs.-all schemes [16].
These researches provided some new ideas and image processing methods for evaluating rice appearance quality. The effectiveness and accuracy of inspection have been improved through these methods.
The objective of this study is to develop algorithm to grade the rice grains into Premium Quality, Grade A, Grade B and Grade C, with help of support vector machine by distinguishing between healthy and unhealthy rice by rough rice (Head Rice, Broken, Brewers, chalky, Long, Short, Selender, Bold and Round).
.
II. METHODOLOGY
Indian Basmati rice seed samples were taken up for grading and classification. The basic steps in the classification and grading of rice are as follows:
Scanning the Rice grain sample.
Image smoothening
Image Segmentation.
Image Binarization.
Calculation of chalk Volume.
Analysis of Shape of Rice Grains.
Analysis of purity of Rice Grain.
Classification Module
2.1 Scanning the Rice grain sample
Firstly, we put the rice grains on the plane of the scanner which is covered with black plastic sheet as background. Then we scan those rice grains to obtain an original image shown in figure.
[image:2.612.112.244.117.197.2].
Fig.1 Rice Image
2.2 Image Smoothening
First the image will be converted into grayscale image[0,256] and the image will preprocessed using a smoothing filter (median filter) that included operations which can enhance and smooth images, accentuating image edges and remove noise from an image.
2.3 Image Segmentation
Image segmentation is the first step of image analysis. An image is subdivided into its constituent parts or objects. The image is usually subdivided until the objects of interest are isolated. There are so many approaches for segmentation algorithms. In this study, our main goal is to extract the rice from the background. Maximum variance method is used to segment the image into foreground and background regions.
2.4 Image Binarization
The result of segmentation is usually a binary image. A binary image contains only two types of pixels: the pixels having a gray level value of either 0 or 1.So after segmentation the rice image will be converted into the binary image [0, 1].
2.5 Calculation of Chalky Volume of Rice Grain
Chalk volume is defined as the opaque volume in the rice grain. The procedure to calculate the chalky volume of rice is as follows:
The number of connected regions in the image is obtained after the segmented binary image of rice is counted.
Then do the labeling of rice grains.
Compute the best chalky segmentation threshold.
Process the connected region of rice with threshold to segment the chalky rice grain.
Compute the boundary values of each object with help of Harris Corner Algorithm.
Compute the Convex Hull using the corner points and we will be with volume of chalky rice kernel.
Chalk degree is defined as the percentage of chalky volume of chalky rice and total volume of rice grains is calculated as follows:
Chalk Degree (%) =
Chalky grain rate is defined as a percentage of chalky rice grains and total of rice grains namely:
Chalky Grain Rate (%) =
Chalky Part of the Rice Grain
Fig.2 Chalky Part Segmentation
70 75 80 85 90 95 50
55 60 65 70 75 80 85
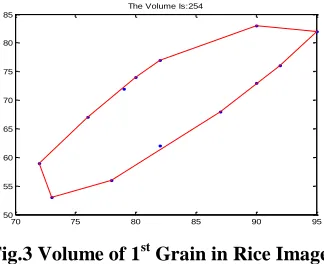
[image:2.612.365.527.258.390.2]The Volume Is:254
Fig.3 Volume of 1st Grain in Rice Image
2.6 Analysis of Shape of Rice Grain
Rice grain shape is described by length, width and their ratio and are categorized as slender (ratio greater than 3.0), medium (ratio within 2.1-3.0), bold (ratio within 1.1-2.0) and round (ratio less than 1.1).
2.7 Analysis of purity of Rice Grain
Purity test of rice sample is done according to the size of the grain kernel (full, half or broken).Head rice is a kernel or piece of kernel with its length equal to or greater than 75% of the average length (grain size) of unbroken kernel. Broken kernels are kernels whose lengths are 75% of the grain size. Brewers are small pieces or particles of
[image:2.612.378.512.582.696.2]kernels whose length equal to or less than 25% of the grain size.
Fig.4 Tracing Shape of Rice Grains
Chalky Volume of Chalky Rice Total Volume of Rice Grains
Roundness 2.80 2.93 3.09 2.83 3.02 3.02 2.83 3.12 3.14 2.743.02 2.87 3.22 2.92 2.34 2.89 2.13 2.81 2.99 2.54 2.86
Fig.5 Roundness Ratio
8) Classification Module
A support vector machine (SVM) a new pattern classifier was trained for classification of the samples into the grades (Premium, Grade A, Grade B and Grade C).
A support vector machine (SVM) performs classification by mapping input vectors into a higher-dimensional space and constructing a hyper-plane that optimally separates the data in the higher-dimensional space. SVM models are closely related Using a kernel function, SVMs are alternative training methods for polynomial, radial basis function, and multi-layer perceptron classifiers in which the weights of the network are found by solving a quadratic programming problem with linear constraints, rather than by solving a non-convex, unconstrained minimization problem as in standard neural network training. Given a training
set of instance-label pairs
x y
i,
i,i =1, 2,3…..l, ni
x
R
,
y
i
1,1
,the SVM require the solution of the following optimization problem:1
min
1
, ,
2
l T
i i
w w C
w b
(1)
subject to
(
( )
) 1
,
0
T
i i i i
y w
x
b
Here, training vectors
x
i(i=1, 2, 3…….l) are mapped into ahigher-dimensional space by the function f . Then the SVM finds a linear separating hyperplane (w, b) with the maximal margin in this higher-dimensional space. C > 0 is the penalty parameter of
the error term. The slack variables,
y
i(i=1,2,3………..l) measurethe degree of misclassification of
x
i.The SVM does not requirean estimation of the statistical distributions of classes to carry out the classification task, but it defines the classification model by exploiting the concept of margin maximization.
Furthermore,
( ,
)
( )
( )
T
i j i j
K x x
x
x
is called the kernel function, with which the computational problem of many dimensions is solved. Although new kernels are being proposed by researchers, the radial basis function (RBF) is a reasonable first choice. This kernel nonlinearly maps samples into a higher dimensional space so it, unlike the linear kernel, can handle the
case when the relation between class labels and attributes is nonlinear.
2
( , ) exp(
i j i j),
0
K x x
x
x
(2)
The RBF kernel nonlinearly maps samples into a higher-dimensional space, so it can handle nonlinear classification
issues. With certain parameters
( , )
C
the RBF kernel has the same performance as the linear kernel or the sigmoid kernel.There are two parameters while using RBF kernels: C and
.It is not known beforehand which C and
are the best for one problem; consequently, some kind of parameter search must be done. Cross-validation is commonly utilized to identify good( , )
C
so that the classifier can accurately predict unknown(independent) data.A common strategy is to separate the data set into two parts, of which one is considered unknown. The prediction accuracy obtained from the “unknown" set more precisely reflects the performance on classifying an independent data set. An improved version of this procedure is known as cross-validation. In n-fold cross-validation, we first divide the training set into n subsets of equal size. Sequentially one subset is tested using the classifier trained on the remaining n-1 subsets. Thus, each instance of the whole training set is predicted once so the cross-validation accuracy is the percentage of data which are correctly classified.
However, a major drawback of SVMs is that, from a theoretical point of view, they were originally developed to solve binary classification problems. Multi-class classifiers are typically constructed by combining several binary classifiers. In this study, 800 kernels were randomly selected, with 200 kernels from each group of chalky, broken, long & round and sound rice samples, which were divided into a training set with 400 kernels and a testing set with 400 kernels.
The training set was used to train the SVM model, while the independent test set was used to test the model performance. Ten order statistical characteristics (length, area, perimeter, etc.) provided effective classification features. A one-against-one multi-class support vector machine with kernel of RBF was trained by the transformed training pattern vectors and tested by the transformed independent test feature vectors. The image processing methods were implemented in Matlab R2011a and the SVM algorithms in LIBSVM.
III. RESULTS
Fig.6 Sorting Train Data & Test Data
[image:4.612.344.543.59.205.2]Fig.7 Test Data, Actual Labels & Predicted Labels
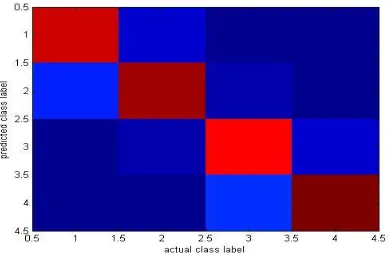
Fig.8 Confusion Matrix of Overall Classification
[image:4.612.67.263.422.551.2]Fig. 9 Representation of True Labels for Test Data
Fig.10 Representation of True Labels for Test Data
IV. CONCLUSION
This study shows the use of support vector machine in classifying and grading the rice grain. By improving the speed classification systems, we would focus on online quality measurement with this technique in the future
REFERENCES
[1] Narendra V G, Hareesh K S. “Quality Inspection and Grading of Agricultural and Food Products by Computer Vision,” International Journal of Computer Applications, vol. 2, pp 43-65, 2010.
[2] H.D. Sapirstein, M. Neuman, E.H. Wright,E.Shwedyk,W. Bushuk . “An instrumental system for Cereal Grain Classification using Digital Image Analysis,”Journal of Cereal Science, vol. 6, pp 3–14, 1987.
[3] Jagdeep Singh Aulakh, Dr. V.K. Banga .“Grading of Rice Grains by Image Processing,” International Journal of Engineering Research & Technology, vol.1, 2012.
[4] K.Ding, S.Gunasekaran. “Shape Feature Extraction and Classification of Food Material using Computer Vision,” Transaction of the ASAE, Vol. 37(5), pp 1537-1545, 1994.
[5] J.A. Patindol. “Methods and Standards for Rice Grain Quality Assessment in the Philippines,”ACIAR , pp-303-315,2000.
[6] Tadhg Brosnan, Da-Wen Sun. “Improving Quality Inspection of Food Products by Computer Vision,” Journal of Food Engineering Vol. 61(1), pp 3–16, 2004.
[7] Jose D Guzman , Engelbert K. Peralta. “Classification of Philippine rice grains using machine vision and artificial neural networks,” World Conference on Agricultural Information and It, pp. 41-48, 2008.
[8] Oliver C. Agustin, Byung-Joo Oh. “Automatic Milled Rice Quality Analysis,” International Conference on Future Generation Communication and Networking, Vol. 2, pp 112-115, 2008.
[9] Qing Yao, Jianhua Chen, Zexin Guan Chengxiao Sun, Zhiwei Zhu. “Inspection of rice appearance quality using machine vision,” WRI Global Congress on Intelligent Systems, Vol. 4, pp.274-279, 2009 .
[10] Liu Guangrong. “Detection of Chalk Degree of Rice Based on Image Processing Technique,” International Conference on Intelligence Science and Information Engineering, pp 515 – 518,2011.
[11] Sanjivani Shantaiya, Mrs.Uzma Ansari. “Identification Of Food Grains And Its Quality Using Pattern Classification,” IJCCT, Vol.2 (2), 2010. [12] Bhupinder Verma. “Image Processing Techniques for Grading &
Classification of Rice,” International Conference on Computer & Communication Technology, pp 220 - 223, 2010.
[image:4.612.92.266.582.711.2][14] Burges, C. J. C. “A tutorial on support vector machines for pattern recognition”. Data Mining and Knowledge Discovery :Vol. 2,pp121-167,1998.
[15] William S Noble. “What is a support vector machine,” Nature Biotechnology, Vol. 24(12), pp 1565-1567,2006.
[16] ]Mikel Galar, AlbertoFernandez, Edurne Barrenechea, Humberto Bustince, Francisco Herrera. “An Overview of Ensemble Methods for Binary Classifiers in Multi-Class Problems: Experimental study on one-vs-one and one-vs-one-vs-all schemes,” Pattern Recognition, Vol. 44, pp 1761-1767, 2011.
AUTHORS
First Author – Harpreet Kaur, Computer, Scienec and
Engineering, P.T.U, Rayat Institute of Engineering and Technology, Railmajra, Punjab, India, Email:
Second Author – Baljit Singh, Computer Science and
Engineering, P.T.U, Baba Banda Singh Bahadur Engineering College, Fathegarh Sahib, Punjab India, Email: