N A N O E X P R E S S
Open Access
Strong coupling between surface plasmon
polaritons and Sulforhodamine 101 dye
Svitlana V Baieva
1*, Tommi K Hakala
1,2and Jussi J Toppari
1Abstract
We demonstrate a strong coupling between surface plasmon polaritons and Sulforhodamine 101 dye molecules. Dispersion curves for surface plasmon polaritons on samples with a thin layer of silver covered with
Sulforhodamine 101 molecules embedded in SU-8 polymer are obtained experimentally by reflectometry
measurements and compared to the dispersion of samples without molecules. Clear Rabi splittings, with energies up to 360 and 190 meV, are observed at the positions of the dye absorption maxima. The split energies are dependent on the number of Sulforhodamine 101 molecules involved in the coupling process. Transfer matrix and coupled oscillator methods are used to model the studied multilayer structures with a great agreement with the experiments. Detection of the scattered radiation after the propagation provides another way to obtain the dispersion relation of the surface plasmon polaritons and, thus, provides insight into dynamics of the surface plasmon polariton/dye interaction, beyond the refrectometry measurements.
PACS:42.50.Hz, 33.80.-b, 78.67.-n
Keywords:surface plasmon polariton, Sulforhodamine 101, strong coupling, Rabi splitting, dispersion curve
Background
The vast development of nanotechnology has mainly concentrated on the areas of novel materials or nan-ometer scale devices with electrical or (bio)chemical functionalities, while the optics and photonics have lacked behind, mostly due to the diffraction limit. While optical microcavities and photonic crystals have pushed the light to its spatial limit, already producing many interesting nonlinear effects [1], different methods are needed for a real nanoscale confinement. Many kinds of surface waves [2], e.g., surface phonon polaritons, sur-face magnetoplasmons, and, especially, sursur-face plasmon polaritons (SPPs) [3,4], exist within the optical range and have been shown to provide the way for a possible nanoscale integration of photonics.
The surface plasmon polaritons are coupled modes of electromagnetic waves and oscillations of free electrons in a metal surface. They propagate in a wavelike fashion, like two-dimensional light bound to a metal-dielectric interface, however, with all the properties modified by
the subwavelength confinement of these optical fully evanescent fields [3,4]. Therefore, SPPs offer fascinating prospects for the photoelectronics, for example, by evad-ing the diffraction limit and, thus, enablevad-ing the efficient integration with electronics, so far prevented by the size mismatch of the ever diminishing electrical but diffrac-tion limited optical components. In addidiffrac-tion, a huge field enhancement near the interface, produced by the confinement, has been widely utilized in a surface enhanced Raman spectroscopy [5]. Similarly, also the enhancement of the fluorescence by surface plasmons has been under intense study [6,7]. Due to this, the combination of SPPs with emitters, such as dye mole-cules and quantum dots, is a heavily studied field of research nowadays. In many cases, the interactions between the SPPs and the emitters are governed by the weak coupling [6-12], resulting in a development of new nanodimensional photonic elements such as planar fre-quency converters [8] or planar refractive elements with a desirable refractive index [9]. Conversion from light to the SPP modes and vice versa can also be done by employing fluorescent molecules [10,11], and one of the most powerful techniques of the SPPs propagation ima-ging is also based on the scattering of the SPPs into * Correspondence: svitlana.v.baieva@jyu.fi
1
Nanoscience Center, Department of Physics, P.O. Box 35, FI-40014, University of Jyväskylä, Finland
Full list of author information is available at the end of the article
photons that excite fluorescent molecules (or direct excitation of the molecules by SPPs) [12].
In a strong coupling regime, the interaction between the SPPs and the emitters cannot anymore be explained by the regular absorption and emission, based on the Fermi Golden rule. This gives rise to new interesting phenomena such as Rabi splitting. Vacuum Rabi split-ting has been shown in, for example, microcavities [13-15] and in plasmonic systems with the SPPs coupled to J-aggregates [16,17], rhodamine molecules [18-20], and quantum dots [21,22]. In this regime, the Rabi split-ting appearing in the dispersion relation of the SPP-exciton interaction is very similar to the one in the in-plane dispersion of the exciton-cavity photon interaction studied in detail. However, to achieve the SPP-exciton strong coupling no optical cavity is needed which makes the experiment much more practical to realize. Also, a large exciton linewidth of the usual dye molecules that is due to vibronic states and inhomogeneous broadening complicates the observation of the strong coupling regime in the quantum microcavities, but not in the case of SPPs [14,18-20].
In this article, we report on experiments showing the strong coupling between SPPs and Sulforhodamine 101 (SR101), which is an organic semiconductor that has two absorption maxima at around 550 and 600 nmaand large oscillator strength. The samples consisted of a thin silver layer evaporated on the glass substrate, and a homoge-neous organic semiconductor layer formed on the top of that. The excitation of SPPs was done by prism coupling technique (Kretschmann configuration) and Rabi split-tings, with energies up to 360 and 190 meV, were obtained. In consequence of the observed double Rabi splitting, three separate SPP-exciton hybrid modes were formed, i.e., there exist three different possible frequen-cies for each wave vector; contrary to the case of periodi-cally nonhomogeneous dielectric layers where several wave vectors exist for a single SPP frequency [23]. Due to the similarity to the exciton-cavity photon coupling, the formalism of the vacuum Rabi splitting [24] is easily adapted to explain the SPP dispersion relation. We use both the coupled oscillator model [17,18] and the trans-fer matrix method [25] to fit the experimental results. Finally, the scattered radiation of the propagating strongly coupled SPP-exciton hybrids was used for study-ing the dynamics and mode emission after the incou-pling. Because of the propagation of the hybrid polaritons before scattering, the scattering event is spatially and temporally separated from the incoupling.
Methods
Sample details
Samples were fabricated on top of microscope cover glasses (colorless borosilicate glass, D263) with
dimensions of 15 mm × 15 mm, and thickness ≈ 0.15 mm, purchased from Knittel Gläser(Waldemar Knittel Glasbearbeitungs, GmbH, Germany). Before fabrication, the glasses were thoroughly cleaned with hot acetone, followed by a sonication (5 min) in isopropyl alcohol and drying by dry nitrogen flow. After that approxi-mately 55 nm thick silver layer was formed on top of the glass by electron-beam evaporation in an ultra-high vacuum (10-9-10-8mbar). It should be noted that the size of the Ag grains is dependent on the evaporation rate. There exists contradicting information in literature about the optimal evaporation rates of Ag layers for optical studies: whether to use a really high [26] or extremely slow rate [27] to obtain the lowest roughness. At the present work, the low evaporation rate of 0.02-0.04 nm/s was chosen to obtain smoother surface (2.5 nm RMS). Since all the samples reported in this study were prepared in different evaporation sessions, each time, the silver thickness and quality were verified by atomic force microscope.
Altogether, six samples with different SR101 concen-trations were prepared. SU-8 epoxy-based negative poly-mer resist (Microchem SU-8 2025, MicroChem Corp., Newton, MA, USA) was used as a matrix for the mole-cules. Desirable amount of SR101 (Sigma-Aldrich, München, Germany) was firstly dissolved in 300μl etha-nol. We prepared samples that contained 0.3, 0.5, 1, 2, 3, and 4 mg SR101 and a reference sample without SR101. After that the obtained solution were mixed with 4.5 ml of cyclopentanone and 420μl of already diluted SU-8 solution (1:6 volume ratio). It should be noted that in the solutions containing more than 3 mg of SR101, colloidal particles are formed. Further filtering was used to remove aggregates with the size above 0.2μm. After the filtration, the resist was spin coated on top of the silver as also shown in Figure 1 and baked at 95°C. To obtain resist thickness of approximately 55 nm, the spinning rate of 4, 500 rpm was used for 45 s. The resist layer also protects the silver against the oxidation process. For the absorp-tion measurement, reference samples without silver were similarly fabricated. The absorbance spectra were mea-sured by Perkin Elmer UV/VIS Lambda 850 spectrometer (Waltham, MA, USA).
SPP excitation and detection methods
Figure 1 shows a schematic picture of our experimental setup. The hemicylindrical prism (ThorLabs, Göteborg, Sweden) made of BK7 glass with index of refraction of 1.52 was used in Kretschmann configuration [4,28,29]. The sample was installed on the flat face of the prism by index matching oil with the same refractive index, and Oriel 66182 white light source (Oriel Instruments, Stratford, CT, USA) was used for excitation. The light is collimated and aligned by two slits with rotatable Glan Taylor prism polarizer in between to adjust the polariza-tion. The incident angle of the incoming light is adjusted manually by rotating the goniometric prism mount. The reflected (D1) and scattered (D2) signals (see Figure 1) are collected by an optic fiber connected to Jobin Yvon iHR320 spectrometer (HORIBA Jobin Yvon S.A.S., Longjumeau Cedex, France) equipped with Jobin Yvon Symphony CCD camera. It should be noted that the reflected and scattered signals were not col-lected simultaneously.
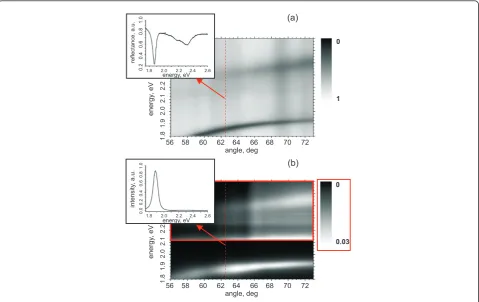
The typical data obtained by D1 and D2 are shown in Figure 2. The reflected light spectrum (D1) was col-lected for every angle of incidence higher than the total internal reflection angle and divided by the spectrum collected at 90° angle of incidence bypassing the prism and the sample. Then, the data were normalized to the highest value over the whole range. The data were col-lected at D2 with the same angles, but only normalized to the highest value over the whole range.
Transfer matrix method
We analyzed the experimental data using two approaches: the transfer matrix method [25] and the coupled oscillators model. First one is simply based on the Fresnel equations for multilayered structures. The model system is a multilayered structure that consists of a semi-infinite dispersionless glass (dielectric constant
εg), 55 nm silver layer with the dielectric function calcu-lated using the data from [26] 50 nm of resist contain-ing SR101 and a semi-infinite air layer. The dielectric function of SR101 layer can be described by an equation [30]
ε(ω) =εS+
2
i=1
Aiω20i
ω2
0i−ω2−iωγi
, (1)
whereεSis a frequency independent dielectric permit-tivity of the media that is hosting the SR101 molecule (SU-8 in here).Ai is a dimensionless parameter
charac-terizing the strength of an oscillation with the resonance frequency ω0i, and gi describes damping of such an
oscillation. With SR101,i= 1, 2. We deduced the para-meters Ai, ω0i, and gi from the measured absorption
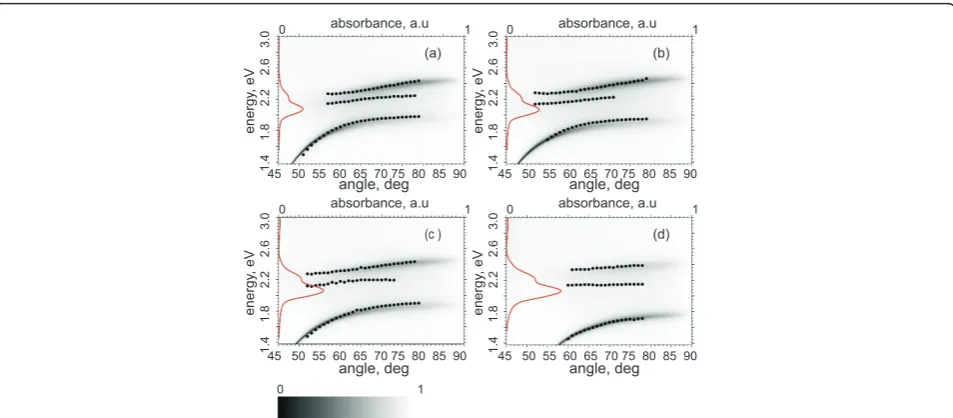
spectra of the reference samples containing only the SR101 resist spun on the glass substrate. The list of the parameters used in the fitting are presented in Table 1. Figure 3 shows the calculated reflectance coefficient of the model system together with the experimental data.
It is important to realize that D2 data result from the SPP scattering on silver film imperfections, and it is not the transmittance in terms of the transfer matrix method. D2 signal is also affected by the SPP/SR101 interaction that is beyond the model described above. So the D2 data cannot be fitted with the transfer matrix method directly.
Dispersion curves and the coupled oscillators model
To obtain the energies for the Rabi splits, we need the dis-persion relations, i.e., energy dependence of the mode on the in-plane wave vector componentkx. The dispersion
curves can be achieved by fitting Lorentzian curves to the dips in the reflectance (D1, Figures 1 and 2a) or peaks of the spectra resulting from the SPPs scattering to photons (D2, Figures 1 and 2b). We are able to resolve all the three hybrid branches in both cases even though the high energy branches are very weak in D2 (see Figures 2 and 3).
The coupled oscillators model is employed to fit the dispersion relation [17,18]. In this model, we solve a sys-tem of coupled equations for the interacting SPP and the two SR101 excitons that correspond to the absorp-tion minimum and shoulder,
⎛
⎝ESPP(Re [kVx1])−iγSPPEEx1V−1iγEx1 V02
V2 0 EEx2−iγEx2
⎞ ⎠ ⎛ ⎝xxSPPEx1
xEx2
⎞ ⎠=ε
⎛ ⎝xxSPPEx2
xEx3
⎞ ⎠ (2)
White light source Slit 1 Polarizer
p
s
Slit 2 Rotating mount Detection 1 (D1)
Detection 2 (D2)
[image:3.595.58.539.89.184.2]Glass substrate Silver Photoresist
Figure 1Schematics of the experiment. Schematic representation of the experimental setup and the sample structure.ais the angle of
Here, ESPP(Re[kx]) is a kx-dependent energy of the
uncoupled SPP at the interface between the silver layer and SU-8 (no SR101), and gSPP is the linewidth of the
SPP. EExi and gExi are the energy and the linewidth of
the i th exciton, respectively, and Viis the coupling
strength of that with the SPP (i= 1, 2). xSPP, xEx1, and
xEx2 are the state vector components corresponding to
the uncoupled SPP and the excitons, respectively. For simplicity, we follow the common way and neglect the linewidths of the excitations. The coupling strength parameters are varied to maximize the overlap with the
experimental data. The values of the energy splits are subsequently deduced from the fitted data as shown in Figure 4.
Results and discussion
Detection 1 (D1)
Dispersion curves measured by the method D1 from four samples are represented on Figure 5a. The behavior of the dispersion relation with changing dye concentra-tion is in good agreement with the previously reported observations [17,18], and the theories as shown in Fig-ures 3 and 4. In the case of D1, the sample without SR101 has a continuous dispersion curve without any signatures of splitting as seen on Figure 5a. When SR101 is present, the interaction between SPP and the molecular excitons happens, and an anti-crossing beha-vior is observed. For low concentration samples (less than 1 mg of SR101), only the lower energy gap, corre-sponding to the absorption maximum, opens. By increasing the concentration, this gap widens, and the second gap, corresponding to the absorption shoulder, appears. If the concentration increases, more both splits
(a)
(b)
1 0
0.03 0
1.8 1.9 2.0 2.1 2.2
1.8 1.9 2.0 2.1 2.2
0.2 0.4 0.6 0.8 1.01.8 2.0 2.2 2.4 2.6
0.0 0.2 0.4 0.6 0.8 1.0
[image:4.595.59.539.89.391.2]1.8 2.0 2.2 2.4 2.6
Figure 2Typical data obtained. (a) Measured reflectance, D1, (2 mg SR101) as a function of the radiation energy and the angle of incidence.
[image:4.595.56.291.624.697.2]Inset shows the reflectance as a function of energy at the 63° excitation angle (red dashed line). (b) Normalized intensity of D2 signal from the same sample. Due to the weakness of the high energy peaks at D2, we zoom on the high energy region (indicated as green rectangle). Corresponding scale bar is presented within green rectangle. Inset shows the intensity as a function of the energy at the 63° excitation angle (red dashed line).
Table 1 Parameters of the transfer matrix theory.
Sample (mg)
εs εgb A1 A2 g1, eV
g2, eV
ω01, eV
ω02, eV
1 2.9 1.485 0.094 0.0065 0.2 0.11 2.06 2.25
2 3 1.505 0.133 0.013 0.2 0.12 2.05 2.23
3 3.1 1.485 0.168 0.019 0.18 0.11 2.05 2.22
4 3 1.33 0.226 0.029 0.2 0.14 2.05 2.23
b
widen as seen on Figures 3 and 5a. Thus, by adjusting the concentration of the molecules in the film, one can move over from a weak coupling regime to the strong coupling regime.
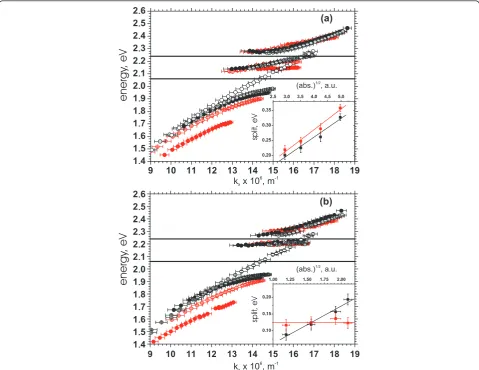
The width of the energy gap should be linearly depen-dent on the square root of the effective oscillator strength or, in other words, the total absorbance [18,31]. For D1, the lower and the upper energy gap values behave according to this prediction (insets on Figure 5). We find that the lower energy gap value changes from
200 to 330 meV when the amount of SR101 changes from 1 to 4 mg. These values well exceed the split ener-gies reported so far in references 15-18. The upper energy gap values vary from 90 to 190 meV.
Detection 2 (D2)
The same behavior characterizes the dispersions obtained from the scattered light detection, i.e., D2. However, the data from D2 shows larger values for the lower energy gap in comparison to D1, even the linear
1
0
45 50 55 60 65 70 75 80 85 901.4 1.8 2.2 2.6 3.0 45 50 55 60 65 70 75 80 85 90
energy
, eV
1.4 1.8 2.2 2.6 3.0
energy
, eV
(с ) (d)
45 50 55 60 65 70 75 80 85 901.4 1.8 2.2 2.6 3.0 45 50 55 60 65 70 75 80 85 90
energy
, eV
1.4 1.8 2.2 2.6 3.0
energy
, eV
(a) (b)
absorbance, a.u
0 1 0 1absorbance, a.u
absorbance, a.u
0 1 0 1absorbance, a.u
[image:5.595.60.537.88.297.2]0 1
Figure 3Reflectance measurements and the transfer matrix theory compared. Experimentally obtained energy dependences of the
observed reflectance spectrum minima as a function of the angle of incidence (black dots). Calculated reflectance coefficients as a function of the excitation energy and the angle of incidence for 1 mg (a), 2 mg (b), 3 mg (c), and 4 mg (d) samples. Red line is the measured absorbance from the corresponding reference sample without silver as a function of excitation energy (scale on the top axis).
.
.
.
.
.
.
.
.
.
.
.
.
.
Figure 4Determining the Rabi energies by the coupled oscillator model. Dispersion relation of the sample having 2 mg SR101 (solid black
[image:5.595.61.540.506.691.2]dependence on the square root of the total absorbance still holds as shown in the inset on Figure 5a. The lower gap value now changes from 220 to 360 meV. The increase of the lower energy gap in D2 agrees well with our earlier measurements and can be understood in the following way demonstrated in the reference 18. Since the interaction of the molecules with the SPP is coher-ent, and the experiment is within a vacuum Rabi split regime, as shown by the intensity independency of the splits, the molecules taking part to the coupling with a single SPP can be considered as a single high strength oscillator. As already noted and shown, the number of molecules taking part in the strong coupling is propor-tional to the concentration of molecules, i.e., the refer-ence sample absorbance. But while comparing the D1
and D2 measurements, there is no difference in the con-centration. However, in the case of reflectance, D1, the photon/SPP has a limited interaction time with mole-cules until reflected back to the detector. During this time, the SPP does not reach its full spatial coverage determined by the propagation speed and the decoher-ence time and, thus, only interacts with a limited num-ber of molecules making the oscillator strength effectively smaller. However, in D2, we detect scattered SPPs, which have propagated along the silver/SR101 resin boundary, and the spatial coverage of the SPP has reached its full value, thus, enabling more dye molecules to be involved in the interaction process, which further increases the effective oscillator strength. In the other words, the interaction time has, thus, also increased,
( )a
( )b
.
.
.
.
.
.
.
.
.
.
.
.
.
.
.
.
.
.
.
.
.
.
.
.
.
.
. . .
. . . . .
. . . .
[image:6.595.58.538.89.459.2]. . . .
Figure 5Measured dispersion curves and the Rabi energies. The dispersion curves of the four samples having 1 mg SR101 (solid gray
which similarly increases the gap as will be discussed in more details on the next chapter. Yet, our observation shows that approximately 10% more molecules partici-pate in decoupling to photons compared to the incoupling.
Further discussion
However, contradicting the earlier results and the rea-soning in reference 18 and above, the upper energy gap is independent on the sample’s absorbance and stays close to 125 meV in the case of D2. This also implies that with high SR101 concentrations, i.e., for the sam-ples with more than 2 mg of SR101, the gap energy is smaller in D2 than in D1, since in D1, the gap depends on the absorption as shown in the inset in Figure 5b. This tendency of the upper energy gap to stay constant in D2 can find the explanation via considering the role of the SPP lifetime that is proportional to (gSPP)-1. In
simpler case, when SPP interacts with only one exciton, the energy gap value can be easily written as
E=
4V2−(γ
SPP−γEx)2 (3)
The term V∝ (absorbance)1/2is responsible for the growth of the gap when more molecules are involved in the coupling, i.e., increase in the concentration or via propagation. However, if consideringgEx as a constant
(well justified approximation in the case of molecular excitations), the increase ofgSPP, i.e., the decrease of the
SPP lifetime, can lead to a decrease of the energy split (in uncoupled case gSPP ≈ gEx). Even though for SPP
interacting with two excitons, the energy split depen-dence on the couplings strengths and the SPP lifetime is more complex than the Equation 3, and the change in SPP lifetime can compensate the gap growth due to the increased oscillator strength.
One possible reason for the decrease of the SPP life-time would be an exciton-phonon scattering, which can cause population transfer from the upper polariton branches to the lowest one, or faster decay of the upper branches via other channels, both characterized by a decreased luminescence of the upper branches compared to the lowest one, i.e., D2 in our case [32]. This signature is clearly visible in our measurements also, as evidenced by comparing the D1 and D2 signals in the Figure 2. In addition, the same was observed in our earlier measurements [18], where an energy trans-fer was also suggested to be the reason. In addition to the decreased luminescence, these scattering processes would significantly shorten the lifetime of the upper-branch-polaritons leading to the decrease of the Rabi energy of the higher split in D2, especially in the case of SR101, where larger couplings are achieved
compared to the earlier measurements by Rhodamine 6 G [18,19]. Further, the strength of these processes is proportional to the coupling strength [32], which means that by increasing the concentration of SR101, the lifetime of the upper-branch-polaritons gets shorter (visible also as a widening of the linewidth of the upper branches in Figure 3 as the concentration increases). This furthermore decreases the Rabi split via increasing gSPP and could compensate the increase
in V also resulting from the increased SR101 concen-tration. The same does not hold for the lower split since the polaritons are gathered to the lowest branch involved in that.
Conclusions
We have experimentally demonstrated the strong cou-pling between SPPs and SR101 dyes in the planar silver/ SR101 resin structures by using two complementary detection geometries. Double Rabi splitting was observed with the energies higher than in the earlier measurements, i.e., up to 360 and 190 meV. Both, the transfer matrix method and the coupled oscillator mod-els fit the experimental data nicely, and the energies of the observed Rabi splittings depend linearly on the square root of the oscillator strength proving the coher-ent coupling between the SPP and the dye molecules. The reflectrometry measurements (D1) show that the lower and the upper gap values are changed by 100 meV while increasing the molecule concentration four times. The employed scattered radiation measurements (D2) allowed us gaining insight into the dynamics of the SPP/molecule interaction. The lower energy gap values obtained by the D2 measurements are approximately 10% larger than the gaps in D1, which is consistent with the earlier observations and means that more dye mole-cules participate in the decoupling to light than the initial incoupling. However, the upper energy split is most probably influenced by a strong decrease of the SPP lifetime leading to a decrease of the Rabi energy in D2.
Endnotes
a
Measured absorption maxima of 50 nm thick SR101/ SU-8 film deposited on a glass substrate.
Abbreviations
SPP: surface plasmon polariton; SR101: Sulforhodamine 101; D1: detection method 1; D2: detection method 2.
Acknowledgements
Author details
1Nanoscience Center, Department of Physics, P.O. Box 35, FI-40014,
University of Jyväskylä, Finland2School of Engineering and Applied Sciences, Harvard University, Cambridge, MA, 02138, USA
Authors’contributions
TKH and JJT initiated the idea. SVB carried out the sample fabrication, experiments, and analysis and wrote the first version of the manuscript. TKH and SVB built the experimental setup. JJT was involved in the design, coordination, and analysis of the experiments, and revising of the manuscript for improving the concepts. All authors read and approved the final manuscript.
Competing interests
The authors declare that they have no competing interests.
Received: 16 September 2011 Accepted: 19 March 2012 Published: 19 March 2012
References
1. Vahala KJ:Optical microcavities.Nature2003,424:839-846. 2. Boardman AD:Electromagnetic Surface ModesNew York: Wiley; 1982. 3. Barnes WL, Dereux A, Ebbesen TW:Surface plasmon subwavelength
optics.Nature2003,424:824-830.
4. Zayats AV, Smolyaninov II, Maradudin AA:Nano-optics of surface plasmon polaritons.Phys Rep2005,408:131-314.
5. Kneipp K, Kneipp H, Corio P, Brown SDM, Shafer K, Motz J, Perelman LT, Hanlon EB, Marucci A, Dresselhaus G, Dresselhaus MS:Surface-enhanced and normal stokes and anti-stokes Raman spectroscopy of single-walled carbon nanotubes.Phys Rev Lett2000,84:2470-2473.
6. Kühn S, Håkanson U, Rogobete L, Sandoghdar V:Enhancement of single-molecule fluorescence using a gold nanoparticle as an optical nanoantenna.Phys Rev Lett2006,97:017402.
7. Tam F, Goodrich GP, Johnson BR, Halas NJ:Plasmonic enhancement of molecular fluorescence.Nano Lett2007,7:496-501.
8. Hakala TK, Toppari JJ, Pettersson M, Kuzyk A, Tikkanen H, Kunttu H, Törmä P: Frequency conversion of propagating surface plasmon polaritons by organic molecules.Appl Phys Lett2008,93:123307.
9. Wu C, Khanikaev AB, Shvets G:Broadband slow light metamaterial based on a double-continuum Fano resonance.Phys Rev Lett2011,106:107403. 10. Andrew P, Barnes WL:Energy transfer across a metal film mediated by
surface plasmon polaritons.Science2004,306:1002-1005.
11. Kuzyk A, Pettersson M, Toppari JJ, Hakala TK, Tikkanen H, Kunttu H, Törmä P: Molecular coupling of light with plasmonic waveguides.Opt Exp2007, 15:9908.
12. Ditlbacher H, Krenn JR, Schider G, Leitner A, Aussenegg FR:Fluorescence imaging of surface plasmon field.Appl Phys Lett2002,81:404-406. 13. Weisbuch C, Nishioka M, Ishikawa A, Arakawa Y:Observation of the
coupled exciton-photon mode splitting in a semiconductor quantum microcavity.Phys Rev Lett1992,69:3314-3317.
14. Lidzey DG, Bradley DDC, Skolnick MS, Virgili T, Walker S, Whittaker DM: Strong exciton-photon coupling in an organic semiconductor microcavity.Nature1998,395:53-55.
15. Khitrova G, Gibbs HM, Kira M, Koch SW, Scherer A:Vacuum Rabi splitting in semiconductors.Nature Phys2006,2:81-90.
16. Pockrand I, Brillante A, Mobius D:Exciton surface-plasmon coupling-an experimental investigation.J Chem Phys1982,77:6289-6295. 17. Bellessa J, Bonnand C, Plenet JC, Mugnier J:Strong coupling between
surface plasmons and excitons in an organic microcavity.Phys Rev Lett 2004,93:036404.
18. Hakala TK, Toppari JJ, Pettersson M, Kuzyk A, Tikkanen H, Kunttu H, Törmä P: Vacuum Rabi splitting and strong-coupling dynamics for surface-plasmon polaritons and Rhodamine6G molecules.Phys Rev Lett2009, 103:053602.
19. Moerland RJ, Hakala TK, Väkeväinen AI, Eskelinen AP, Sharma G, Toppari JJ, Kuzyk A, Pettersson M, Kunttu H, Törmä :Vacuum Rabi splitting for surface plasmon polaritons and Rhodamine 6 G molecules.In Metamaterials VI, (SPIE Optics and Optoelectronics)Edited by: Kuzmiak V, Markos P, Szoplik T 2011, 8070, SPIE2011.
20. Valmorra F, Bröll M, Schwaiger S, Welzel N, Heitmann D, Mendacha S: Strong coupling between surface plasmon polariton and laser dye rhodamine 800.Appl Phys Lett2011,99:051110.
21. Gomez DE, Vernon KC, Mulvaney P, Davis TJ:Surface Plasmon mediated Strong exciton-photon coupling in semiconductor nanocrystals.Nano Lett2010,10:274-278.
22. Gomez DE, Vernon KC, Mulvaney P, Davis TJ:Coherent superposition of exciton states in quantum dots induced by surface plasmons.Appl Phys Lett2010,96:073108.
23. Motyka MA, Lakhtakia A:Multiple trains of same-color surface plasmon-polaritons guided by the planar interface of a metal and a sculptured nematic thin film.J Nanophoton2008,2:021910, Part II. J. Nanophoton. 2009, 3: 033502; Lahktakia A, Jen Y-J, Lin C-F: Part III.J. Nanophoton. 2009, 3: 033506; Faryad M, Polo Jr. JA, Lakhtakia A: Part IV., J. Nanophoton. 2010, 4: 043505.
24. Skolnick MS, Fisher TA, Whittaker DM:Strong coupling phenomena in quantum microcavity structures.Semicond Sci Thecnol1998,13:645-669. 25. Harbecke B:Coherent and incoherent reflection and transmission of
multilayer structures.Appl Phys B1986,39:165-170.
26. Christy RW, Johnson PB:Optical constants of the noble metals.Phys Rev B 1972,6:4370-4379.
27. Drachev VP, Chettiar UK, Kildishev AV, Yuan HK, Cai W, Shalaev VM:The Ag dielectric function in plasmonic metamaterials.Opt Exp2008,16:1187. 28. Raether H:Surface plasmons on smooth and rough surfaces and on grating
New York: Springer-Verlag; 1988.
29. Maier SA:Plasmonics. Fundamentals and applicationsNew York: Springer; 2007.
30. Sivuhin VD:General physics course. OpticsMoscow: Nauka; 1979. 31. Agranovich VM, Litinskaia M, Lidzey DG:Cavity polaritons in microcavities
containing disordered organic semiconductors.Phys Rev B2003, 67:085311.
32. Michetti P, La Rocca GC:Exciton-phonon scattering and photoexcitation dynamics inJ-aggregate microcavities.Phys Rev B2009,79:035325.
doi:10.1186/1556-276X-7-191
Cite this article as:Baievaet al.:Strong coupling between surface plasmon polaritons and Sulforhodamine 101 dye.Nanoscale Research Letters20127:191.
Submit your manuscript to a
journal and benefi t from:
7Convenient online submission
7Rigorous peer review
7Immediate publication on acceptance
7Open access: articles freely available online
7High visibility within the fi eld
7Retaining the copyright to your article