N A N O E X P R E S S
Open Access
A colorimetric method for the molecular weight
determination of polyethylene glycol using gold
nanoparticles
Kai Ling, Hongyan Jiang and Qiqing Zhang
*Abstract
A gold nanoparticle (AuNP)-based colorimetric method was developed for the molecular weight (MW) determination of polyethylene glycol (PEG), a commonly used hydrophilic polymer. Addition of a salt solution to PEG-coated AuNP solutions helps in screening the electrostatic repulsion between nanoparticles and generating a color change of the solutions from wine red to blue in 10 min in accordance with the MW of PEG, which illustrates the different stability degrees (SDs) of the AuNPs. The SDs are calculated by the absorbance ratios of the stable to the aggregated AuNPs in the solution. The root mean square end-to-end length (〈h2〉1/2) of PEG molecules shows a linear fit to the SDs of the PEG-coated AuNPs in a range of 1.938 ± 0.156 to 10.151 ± 0.176 nm. According to the Derjaguin-Landau-Verwey-Overbeek theory, the reason for this linear relationship is that the thickness of the PEG adlayer is roughly equivalent to the〈h2〉1/2 of the PEG molecules in solution, which determines the SDs of the AuNPs. Subsequently, the MW of the PEG can be obtained from its〈h2〉1/2using a mathematical relationship between〈h2〉1/2and MW of PEG molecule. Applying this approach, we determined the〈h2〉1/2and the MW of four PEG samples according to their absorbance values from the ordinary ultraviolet–visible spectrophotometric measurements. Therefore, the MW of PEG can be distinguished straightforwardly by visual inspection and determined by spectrophotometry. This novel approach is simple, rapid, and sensitive.
Keywords:Gold nanoparticles; Polyethylene glycol; Molecular weight determination; Colorimetric method; Spectrophotometry
Background
Polyethylene glycol (PEG) is a synthetic hydrophilic polymer, which is widely used as an emulsifier and sur-factant in cosmetics, foodstuffs, and pharmaceutical products [1,2]. The molecular weight (MW) of PEG has a significant impact on its properties and applications [1,3,4]. In the case of PEG-functionalized drugs, in par-ticular, an increase in the MW of PEG leads to reduced kidney excretion, resulting in a prolonged blood circula-tion time of the drug [1]. A variety of analytical tech-niques, such as size exclusion chromatography (SEC) with preferably a universal detector [2], nuclear mag-netic resonance spectroscopy [5], and matrix-assisted
laser desorption ionization time-of-flight mass spec-trometry [6], have been used to determine the MW of PEG polymer. However, these powerful techniques re-quire the use of sophisticated instruments and compli-cated protocols. Besides, the instruments are not as readily available in many laboratories.
Gold nanoparticle (AuNP)-based colorimetric assays have attracted considerable attentions in detection appli-cations with regard to their simplicity and versatility [7,8]. This colorimetric assay can be easily observed by visual inspection, which avoids the relative complexity inherent in conventional detection methodologies [9]. Because of the electrostatic repulsion resulting from the negative charges on the surfaces, AuNPs are highly stable in the absence of added salts. The addition of electrolytes to gold sols results in the reduction of charge repulsion and as a consequence nanoparticle ag-gregation. Nonetheless, AuNPs can be stabilized even at * Correspondence:zhangqiqt@126.com
Key Laboratory of Biomedical Material of Tianjin, Institute of Biomedical Engineering, Chinese Academy of Medical Sciences & Peking Union Medical College, Tianjin 300192, People’s Republic of China
high salt concentrations by adsorbing proteins or other hydrophilic polymers (protecting agents) onto their sur-faces [10]. They bind the macromolecules by noncova-lent electrostatic, stable adsorption [11]. PEG polymer is one of the most often used stabilizers, as it possesses the advantage of a chemically well-defined composition that ensures the reproducibility of its performance. Moreover, PEG dissolves rapidly and therefore can be prepared just prior to use.
At high salt concentrations, the stability of PEG-coated AuNPs depends upon the MW of PEG [12]. The stabilization of the fully coated AuNPs is due to the steric repulsion effect, which is dependent on the thick-ness (t) of the PEG adlayer and the conformation of the adsorbed PEG molecules [10,13,14]. The adsorbed PEG forms a single protecting layer on the surface of the nanoparticle, because of the resistance of the polymer coil to compress and to release both bound and free water from within the hydrated coil [15-17]. Under the complete coverage of the surface condition, PEG mole-cules are in direct competition for the adsorption sites on the AuNP surface [18]. Therefore, the adsorbed linear PEG molecules form typical loops and tail conforma-tions [13,18]. The value oftis roughly equivalent to the size of the PEG molecule as a free molecule in solution under the condition [13,18]. The root mean square end-to-end length (〈h2〉1/2) is commonly used to specify the size of a linear polymer molecule.
Herein, enlightened by the above facts, we developed a simple and reliable colorimetric method for the MW determination of PEG in aqueous solution using citrate-reduced AuNPs. This method is based on the different stability degrees (SDs) of the AuNPs, which are fully coated by different MW (〈h2〉1/2) of PEG, after screening the electrostatic repulsion between nanoparticles. The SDs of the AuNPs are monitored by ultraviolet–visible (UV–vis) spectrophotometry, which exploits the strong sensitivity of the localized surface plasmon resonance spectrum to the aggregation of AuNPs. In this study, the SDs are calculated by the absorbance ratios of the stable to the aggregated AuNPs in solution. The nanoparticles exhibit greater stability upon an increase in the MW (〈h2〉1/2) of PEG. Of the systems tested, the 〈h2〉1/2 of PEG molecules was found to exhibit a good linear cor-relation to the SDs of the AuNPs in a specified range. As a result, we can obtain the 〈h2〉1/2 of PEG from the SDs of the AuNPs and then estimate the corresponding MW using a mathematical relationship between the〈h2〉1/2 and MW of PEG molecule. So far, there is no report on nanomaterial-based methods for the MW determination of polymers. This AuNP-based determination method offers simplicity, convenience, and sensitivity, and can be accomplished in minutes without sophisticated instru-ments or training overhead.
Methods Materials
Hydrogen tetrachloroaurate (III) trihydrate (HAuCl4· 3H2O) and four PEG samples (SPEG 1,450 to 10,000) were purchased from Sigma-Aldrich (St. Louis, MO, USA). Ten PEG samples (APEG 400 to 20,000) were purchased from Alfa Aesar (Tianjin, China). Trisodium citrate dihydrate (Na3C6H5O7· 2H2O), sodium azide (NaN3), and sodium chloride (NaCl) were purchased from Sinopharm Group Chemical Reagent Co., Ltd. (Shanghai, China). All chemicals were analytical grade reagents and used without further purification. All water was deionized by reverse osmosis and further purified using a Milli-Q Plus system (Millipore, Billerica, MA, USA) to 18.2 MΩ cm resistivity. All glassware were cleaned using aqua regia solution (HCl/HNO3= 3:1,v/v) and subsequently rinsed with a copious amount of Milli-Q treated water.
AuNP preparation
Citrate-reduced AuNPs were prepared according to the modified method [19,20]. In brief, 99.00 mL of water and 1.00 mL of 1.0% (w/v) HAuCl4· 3H2O solution were mixed in a flask. The mixture was then heated under magnetic stirring until it began to boil, and a 1.0% (w/v) Na3C6H5O7· 2H2O solution (1.80 and 2.25 mL) was quickly added to the solution. After boiling for 20 min, the solutions were cooled to room temperature (25°C) with vigorous magnetic stirring. The prepared AuNP solutions were stored at 4°C until ready for use. The nanoparticle concentrations of the prepared two samples were determined by measuring their extinction at 520 and 524 nm, respectively.
The prepared nanoparticles were characterized using a JEM-2010 FEF transmission electron microscope (TEM; JEOL Ltd., Akishima, Tokyo, Japan). Bright-field images of at least 200 particles deposited onto a carbon-coated copper grid (Xinxing Braim Technology Co., Ltd., Beijing, China) were measured using ImageTool graphics software to approximate the average particle diameter. The optical densities of the two AuNP samples at 520 and 524 nm, respectively, were measured using a Lambda 35 UV–vis spectrophotometer (Perkin Elmer, Waltham, MA, USA).
Colorimetric determination of PEG MW
nanoparticles. The PEG-coated nanoparticles were col-lected by centrifugation (12,000 rpm, 20 min) and resus-pended in water three times to wash out the free PEG molecules and produce the fully coated AuNPs used in subsequent examinations. Subsequently, 1-mL aliquots of PEG-coated AuNP solutions were mixed with a cer-tain volume (40, 50, or 60 μL) of 10.0% (w/v) NaCl so-lution at room temperature (25°C) for 30 s, followed by recording of their absorption spectra using the Lambda 35 UV–vis spectrophotometer after 10 min.
Chromatographic determination of PEG MW
SEC measurements were performed using a Waters 515 liquid chromatography system configured with an Optilab rEX refractive index (RI) detector (Wyatt Technology, Santa Barbara, CA, USA). Separations were performed using three size exclusion columns (SB804HQ, SB803HQ, and SB802.5HQ, Shodex, Japan) in series. PEG samples (100μL) were run at 5 mg/mL concentrations in aqueous solution. The running buffer contained 0.05% (w/v) NaN3. A flow rate of 0.5 mL/min was used, and samples were characterized using RI detection (internal temperature 30°C). The columns and the buffers were used at the same temperature.
Multi-angle laser light scattering (MALLS) measure-ments were used to perform analytical scale chromato-graphic separations for the absolute MW determination of the principal peaks in the above SEC/RI measure-ments. MALLS determinations were performed using an 18-angle DAWN HELEOS laser light scattering detector (Wyatt Technology, USA) connected in tandem to the Optilab rEX RI detector (Wyatt Technology, USA), op-erating with a 50-mW solid-state laser at 658 nm. Sys-tem and instrument validation was performed based on dextran (GPC Standard 80, Pharmacosmos, Denmark).
Dynamic light scattering measurements
Hydrodynamic radii (Rh) of PEG molecules were mea-sured by dynamic light scattering (DLS) (Nanosizer ZS, Malvern Instruments, Worcestershire, UK) at room temperature (25°C). All PEG samples were dissolved in 81.5 mM NaCl solution to 5 mg/mL concentrations. All PEG solutions were then ultrasonicated for 10 min and filtered through 0.22-μm nylon filters. The zeta poten-tials of the AuNPs were also measured by DLS at room temperature (25°C).
Data analysis
OriginPro 8.0 software (OriginLab, Northampton, MA, USA) was employed to perform data processing. Each sample measurement was repeated in triplicate, and the data were presented as the mean ± standard deviation.
Results and discussion
Colloidal nanoparticles in a dispersion medium always show Brownian motion and hence undergo frequent col-lisions with each other. The stability of colloids is thus determined by the interaction between the nanoparticles during such collisions. There are two basic interactions: one being attractive and the other repulsive. When at-traction dominates, the nanoparticles will aggregate with each other, and finally, the entire dispersion may co-alesce. Conversely, when repulsion dominates, the sys-tem will be stable and remain in a dispersed state. This idea was originally proposed by Derjaguin, Landau, Verwey, and Overbeek and is therefore referred as the DLVO theory [13,21]. The DLVO theory assumes that the behavior of colloidal nanoparticles can be simplified by the interaction potential between two neighboring nanoparticles [13,21].
We therefore used the DLVO theory to study the ef-fects of PEG MW on the stability of the coated AuNPs. The three major interaction energies at work in this sys-tem are electrostatic (Uelec) and steric (Usteric) repulsions and van der Waals (UvdW) attraction. These are assumed to be additive so that the total interparticle interaction energy (Utotal) becomes [22]
Utotal¼UelecþUstericþUvdW: ð1Þ
We estimated the interaction energies for two neigh-boring spherical AuNPs coated by PEG adlayer as shown in Figure 1.
The weight average molecular weights (Mw) and the
Rh of the PEG samples determined from the above experiments are shown in Table 1. The polydispersity in-dexes (Mw/Mn) of all PEG samples were measured to be about 1.05. Due to the conformation of hydrated PEG molecules (low Mw) in aqueous solution, the radii of gyration (Rg) of the PEG coils can be calculated by [23]
Rh¼0:85Rg: ð2Þ
Since the PEG chains behave much like ideal chains in water, the Rg is related to the 〈h2〉1/2, which is expressed by the following equation [23,24]:
h2 1=2
¼pffiffiffi6Rg: ð3Þ
The data of the above calculations are listed in Table 1.
theRg(Equation 3),〈h2〉1/2∝Mwυ [24], which is described by
h2 1=2¼0:0718M0:5250
w ð4Þ
with an R2= 0.9994. This relationship is presented in Additional file 1: Figure S1 and plotted according to the
Mw and the 〈h2〉1/2 values of the PEG samples (APEG
400 to 20,000) listed in Table 1. The coefficient υ is 0.5250, which is close to 0.5, establishing the fact that
the PEG chains behave much like ideal chains in the solution [23].
In order to verify the colorimetric method, two sizes of AuNPs were prepared by reducing HAuCl4 with dif-ferent amounts of trisodium citrate (see ‘Methods’). Through TEM examination, the diameters of the as-prepared AuNPs were measured to be about 16 and 26 nm, respectively (Additional file 1: Figure S2). The zeta potential values of the AuNPs were measured to be
[image:4.595.56.538.88.324.2]−34.6 ± 1.9 mV (16-nm AuNPs) and−30.1 ± 1.5 mV (26-nm
Figure 1Schematic of two neighboring AuNPs coated with adsorbed PEG.RAuNPsis the radius of the AuNPs,Lis the nanoparticle center-to-center separation distance,His the separation distance between the nanoparticle surface (H=L−2RAuNPs), andtis the thickness of the adsorbed PEG layer.
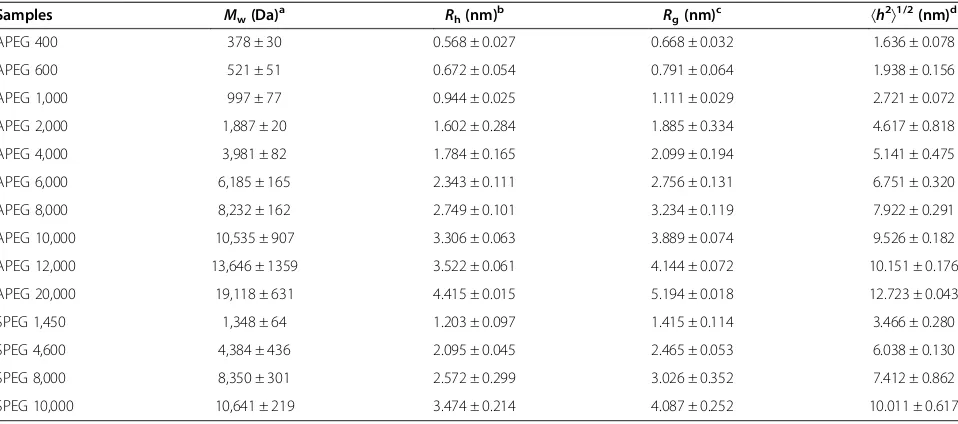
Table 1Mw,Rh,Rg(Equation 2), and〈h2〉1/2(Equation 3) values of PEG samples used in this study
Samples Mw(Da)a Rh(nm)b Rg(nm)c 〈h2〉1/2(nm)d
APEG 400 378 ± 30 0.568 ± 0.027 0.668 ± 0.032 1.636 ± 0.078
APEG 600 521 ± 51 0.672 ± 0.054 0.791 ± 0.064 1.938 ± 0.156
APEG 1,000 997 ± 77 0.944 ± 0.025 1.111 ± 0.029 2.721 ± 0.072
APEG 2,000 1,887 ± 20 1.602 ± 0.284 1.885 ± 0.334 4.617 ± 0.818
APEG 4,000 3,981 ± 82 1.784 ± 0.165 2.099 ± 0.194 5.141 ± 0.475
APEG 6,000 6,185 ± 165 2.343 ± 0.111 2.756 ± 0.131 6.751 ± 0.320
APEG 8,000 8,232 ± 162 2.749 ± 0.101 3.234 ± 0.119 7.922 ± 0.291
APEG 10,000 10,535 ± 907 3.306 ± 0.063 3.889 ± 0.074 9.526 ± 0.182
APEG 12,000 13,646 ± 1359 3.522 ± 0.061 4.144 ± 0.072 10.151 ± 0.176
APEG 20,000 19,118 ± 631 4.415 ± 0.015 5.194 ± 0.018 12.723 ± 0.043
SPEG 1,450 1,348 ± 64 1.203 ± 0.097 1.415 ± 0.114 3.466 ± 0.280
SPEG 4,600 4,384 ± 436 2.095 ± 0.045 2.465 ± 0.053 6.038 ± 0.130
SPEG 8,000 8,350 ± 301 2.572 ± 0.299 3.026 ± 0.352 7.412 ± 0.862
SPEG 10,000 10,641 ± 219 3.474 ± 0.214 4.087 ± 0.252 10.011 ± 0.617
a
Mwwas determined by MALLS. b
Rhwas determined by DLS. c
Rgwas calculated using Equation2. d
〈h2
〉1/2
[image:4.595.59.538.514.726.2]AuNPs) by DLS. The nanoparticle concentrations were calculated as 1.316 × 10⁻⁹M (16-nm AuNPs) and 2.804 × 10⁻¹⁰M (26-nm AuNPs) using the corresponding absorb-ance values of 0.6471 and 0.6911 at 520 and 524 nm in conjunction with the calculated extinction coefficient for
ε520 nm
NP16 ¼4:916108andε524 nmNP26 ¼2:465109cm−
1 M−1, respectively [27].
To ensure that the amounts of PEG are able to satur-ate the AuNP surfaces in the final suspensions of 7.925 × 10¹¹ particles/mL (16-nm AuNPs) and 1.689 × 10¹¹ particles/mL (26-nm AuNPs), we estimated the total surface area simply based on the diameters of the uncoated AuNPs. Thus, the total available surface area in the suspensions was estimated as approximately 6.37 × 10⁻⁴m2/mL (16-nm AuNPs) and 3.59 × 10⁻⁴m2/mL (26-nm AuNPs). We then calculated the amount of PEG needed to cover all nanoparticles with a single monolayer of four typical PEG samples (APEG 400, 600, 6,000, and 20,000) occupying areas dictated by their Rh (Additional file 1: Tables S1 and S2). These numbers were then com-pared to the total concentration of PEG available in the solution for the bulk concentration used (11.25 mg/mL). This concentration is considered to ensure that there are at least 5 orders of magnitude more PEG molecules than necessary as needed to saturate the nanoparticle surfaces, based on the above calculations.
The Debye length (κ−1) is the measure of a charge car-rier's net electrostatic effect in the solution and the distance over which those electrostatic effects persist. It is also ap-propriately termed the electrostatic ‘screening length,’ be-yond which the charges are electrically screened [13]. For a single symmetrical electrolyte in water at room tempera-ture (25°C), it can be readily calculated in the form [13]:
κ−1¼0:3041 z
j jpffiffiffiffiCðnmÞ; ð5Þ
whereCis the electrolyte concentration (M) andzis the valence of the electrolyte.
In this study, we added varying amounts of 10.0% NaCl solution (40, 50, or 60 μL, w/v) to each PEG-coated AuNP solution (1 mL) to screen the electrostatic repulsion between nanoparticles. The electrostatic repul-sion originates from the surface underlying the adsorbed polymer layer. The resulting NaCl concentrations were 65.8, 81.5, and 96.9 mM, respectively. The correspond-ing values of κ−1were determined to be 1.19, 1.07, and 0.98 nm, which were calculated using the above data and Equation 5. The amount of the salt present in the added 40μL of 10.0% (w/v) NaCl solution does not en-sure complete screening of the electrostatic repulsion. This may be attributed to the fact that the Rhof APEG 400 is 0.568 nm (2Rh<κ−1= 1.19 nm) and the zeta po-tentials of the fully coated nanoparticles range from
−13.4 (APEG 400, 16-nm AuNPs) to −9.5 mV (APEG 20,000, 16-nm AuNPs) and from−12.6 (APEG 400, 26-nm AuNPs) to −8.4 mV (APEG 20,000, 26-nm AuNPs) after adding NaCl solution. The salt added in a 50-μL amount of 10.0% (w/v) NaCl solution can more adequately screen the electrostatic repulsion as a result of the relatively shorter κ−1 with the zeta potentials ranging from −8.3 (APEG 400, 16-nm AuNPs) to −4.8 mV (APEG 20,000, 16-nm AuNPs) and from−7.8 (APEG 400, 26-nm AuNPs) to −4.4 mV (APEG 20,000, 26-nm AuNPs) after NaCl addition. Likewise, the amount of salt for the addition of 60 μL of 10.0% (w/v) NaCl solution can also screen the electrostatic repulsion. However, the hydrophobicity of soluble polymer increases at a higher concentration of salt [28,29]. Hence, 50 μL of 10.0% (w/v) NaCl solution was added to 1 mL of PEG-coated AuNP solutions in order to screen the electrostatic repulsion between nanoparticles. In addition, the pH values of the PEG-coated AuNP solu-tions were maintained at 6.3, even after salt addition. According to the above analyses, the Uelec= 0, under the salt addition condition.
The steric repulsion between two nanoparticles of radiusRAuNPswith adsorbed PEG layers can be modeled as [30]
Usteric¼
( ∞;L<2RAuNPs
U0 −lnð Þy− 9 5ð1−yÞ þ
1 3 1−y
3
−1
30 1−y 6
0;L>2ðRAuNPsþtÞ
;2RAuNPs
<L<2ðRAuNPsþtÞ;
ð6Þ
where
y¼L−2RAuNPs
2t ≤1 ð7Þ
and
U0¼ π 3tσ
pkBT
12Npl2
!
RAuNPst2; ð8Þ
where L is the radial distance from the center of parti-cles, σp is the surface density of adsorbed chains, kB is
the Boltzmann constant,Tis the kinetic temperature,Np
is the number of segments in the polymer chain, andlis the segment length.
The potential energy of the van der Waals interaction between two particles, UvdW, can be approximated by the following calculation [14],[21]:
UvdW¼−A
R
AuNPs
12H ; ð9Þ
particles. According to the DLVO theory, when the sur-face layers just touch (i.e., H= 2t), the Usteric= 0. The
total energy (Utotal) of the net interaction has a deep
minimum that is dependent on the value of the UvdW
(Additional file 1: Figure S3) [13,18,31]. In general, the minimum of the Utotal(dashed line in Additional file 1:
Figure S3) determines the stability of fully coated AuNPs, which is dependent on thetvalue of the adlayer [13]. If the adlayer is thick enough, the minimum be-comes so slight that it can be ignored, thus resulting in greater nanoparticle stability, and vice versa [13]. In other words, the t can determine the SDs of the PEG-coated AuNPs.
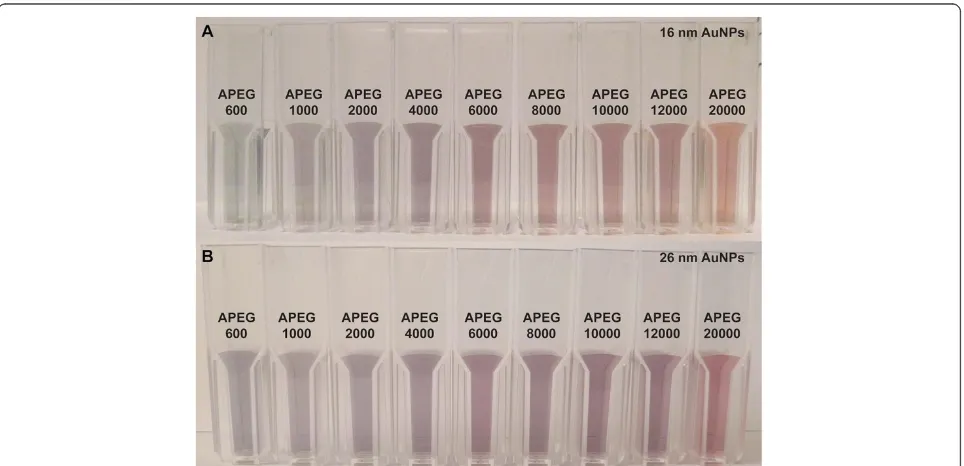
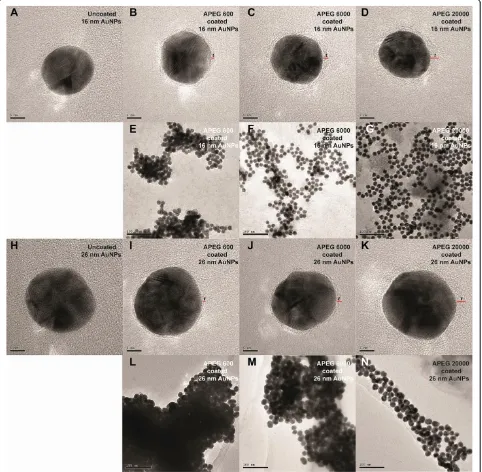
After screening the electrostatic repulsion, the colors of the PEG-coated AuNP solutions were observed to change from wine red to blue within 10 min of NaCl addition, in accordance with the MW of PEG (Figure 2). The APEG 400-coated AuNPs aggregated rapidly to form a deposit within 3 to 5 min, so the data are not shown. However, the APEG 20,000-coated AuNPs remained stable, without significant aggregation (color change) during the experimental period (8 h). This phenomenon reflects the differences in the SDs of the AuNPs. This color change supports the ready distinction of PEG MW through visual inspection. TEM was employed to examine the PEG adlayers on the typical fully coated nanoparticle surfaces (by APEG 600, 6,000, and 20,000). As shown in Figure 3, higher MW of PEG corresponded to a thicker adlayer, and hence, greater AuNPs stability.
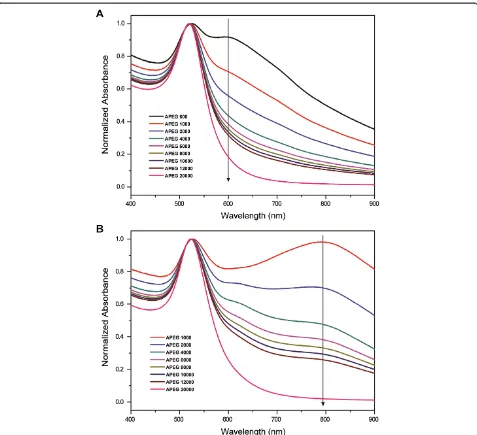
Figure 4 shows the normalized absorption spectra of the PEG-coated 16- and 26-nm AuNPs in 81.5 mM NaCl solution. The absorption peaks at 520 nm (16-nm AuNPs) and 524 nm (26-nm AuNPs) are attributed to the still stable nanoparticles in the solution. The other absorption peaks at 598 nm (16-nm AuNPs) and 790 nm (26-nm AuNPs) correspond to the aggregated nanoparticles in the solution. In this study, we used the absorbance ratios of the stable to the aggregated nano-particles in the solution to calculate the SDs of the AuNPs, which are formulated by
SDð16 nmÞ¼ A520 A598−A0598
ð10Þ
SDð26 nmÞ¼A A524
790−A0790
ð11Þ
where, the A0598 and the A0790 are the absorbance values of the diluted AuNP solutions (1 mL of PEG-coated AuNP solution + 50 μL of water) at 598 nm (16-nm AuNPs) and 790 nm (26-nm AuNPs), respectively. The APEG 600-coated 26-nm AuNPs began to form a pre-cipitate within 10 min, and hence, the data are not shown.
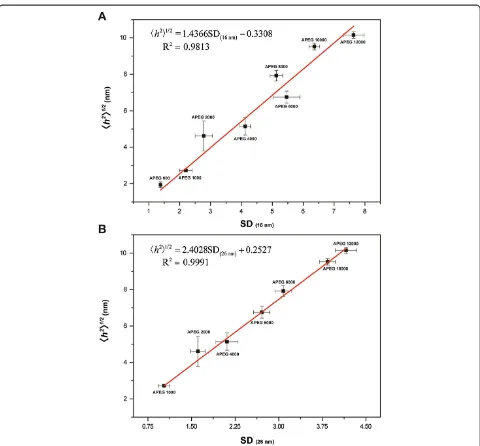
[image:6.595.58.540.479.712.2]In this study, the 〈h2〉1/2 values of PEG were found to exhibit a good linear correlation to the SDs of the fully coated AuNPs in the range of 1.938 ± 0.156 nm (APEG 600) to 10.151 ± 0.176 nm (APEG 12,000, Figure 5). The reason is attributed to the t of the PEG adlayer being about equal to the 〈h2〉1/2 of the PEG molecules in
solution under the system condition [13,18]. For PEG-coated 16-nm AuNPs (APEG 600 to 12,000), the stand-ard regression equation is
h2 1=2
¼1:4366SDð16 nmÞ−0:3308 ð12Þ
with an R2= 0.9813. For PEG-coated 26-nm AuNPs (APEG 1,000 to 12,000), the standard regression equation is
h2 1=2
[image:7.595.58.540.91.563.2]¼2:4028SDð26 nmÞþ0:2527 ð13Þ Figure 3TEM images of uncoated and PEG-coated AuNPs.TEM images of uncoated AuNPs:(A)16-nm AuNPs and(H)26-nm AuNPs. TEM images of fully coated AuNPs in the absence of 10.0% (w/v) NaCl solution for 16-nm AuNPs:(B)APEG 600,(C)APEG 6,000, and(D)APEG 20,000; for 26-nm AuNPs:(I)APEG 600,(J)APEG 6,000, and(K)APEG 20,000. TEM images of fully coated AuNPs in the presence of 10.0% (w/v) NaCl solution for 16-nm AuNPs:(E)APEG 600,(F)APEG 6,000, and(G)APEG 20,000; and for 26-nm AuNPs:(L)APEG 600,(M)APEG 6,000, and(N)APEG 20,000. Thetrepresents the thickness of the dehydrated PEG adlayer (red line). The scale bars are 5 nm(A to D),(H to K)and 100 nm(E to G),
with anR2= 0.9991. Therefore, the〈h2〉1/2of PEG can be estimated through the absorbance values of UV–vis spec-trophotometric measurements. Finally, the Mw of PEG
can be obtained using Equation4.
The colorimetric method was employed to determine the 〈h2〉1/2
of SPEG samples. The normalized absorption spec-tra of the AuNPs coated with SPEG 1,450, 4,600, 8,000, and 10,000 in the NaCl solution are presented in Additional file 1: Figure S4. According to their absorbance values, the 〈h2〉1/2
values of the four PEG samples are estimated through Equations 12 and 13. Then, using Equation 4, the Mwof the PEG is obtained from its calculated〈h2〉1/2. The above results are listed in Table 2. The measurements obtained by this colorimetric method did not exhibit a
significant difference compared to the SEC/MALLS method with the two-tailed Student'sttest (P> 0.1).
Conclusions
[image:8.595.60.537.87.522.2]In summary, a unique colorimetric method was devel-oped to determine the MW of PEG, based on the steric stabilization of PEG-coated AuNPs. Using the ordinary UV–vis spectrophotometry technique, the MW of the PEG samples can be calculated by the absorbance values of the PEG-coated AuNP solutions, after adding salt to screen the electrostatic repulsion between nanoparticles. This strategy offers operational advantages (simplicity, conveni-ence, and sensitivity) over many existing methodologies, which has important implications for the development of
Figure 4Normalized absorption spectra of PEG-coated AuNPs in the presence of 10.0% (w/v) NaCl solution. (A)16-nm AuNPs and(B)
nanomaterial-based determination methods. In the future, this colorimetric method can be applied to the MW deter-mination of other soluble macromolecules. This strategy would provide a great advantage to current research areas in polymer science, materials science, and biology.
Additional file
Additional file 1:Supplementary information of a colorimetric method for the molecular weight determination of polyethylene glycol.Correlation between〈h2〉1/2andM
wof PEG(Figure S1). TEM
images of as-prepared AuNPs(Figure S2). Plot of energy vs interparticular distance (H) for steric stabilization(Figure S3). Normalized absorption spectra of PEG (SPEG 1,450 to 10,000)-coated AuNPs in the presence of 10.0% (w/v) NaCl solution(Figure S4). Calculation of surface area of 16-nm AuNP availability for PEG adsorption(Table S1). Calculation of surface area of 26-nm AuNP availability for PEG adsorption(Table S2).
Abbreviations
APEG:PEG samples were purchased from Alfa Aesar; AuNPs: Gold nanoparticles; DLS: Dynamic light scattering; MALLS: Multi-angle laser light scattering;Mw: Weight average molecular weights; MW: Molecular weight;
PEG: Polyethylene glycol; RI: Refractive index;Rh: Hydrodynamic radii;
[image:9.595.58.538.85.531.2]Rg: Radii of gyration; SD: Stability degree; SEC: Size exclusion Figure 5Linear correlation between the〈h2〉1/2of PEG and the SDs of fully coated AuNPs. (A)16-nm AuNPs and(B)26-nm AuNPs.
Table 2 AuNP-based colorimetric method to determine 〈h2〉1/2
andMwvalues of PEG samples
Samples 16-nm AuNPs 26-nm AuNPs
〈h2〉1/2(nm) M
w(Da) 〈h2〉1/2(nm) Mw(Da) SPEG 1,450 3.398 ± 0.298 1,561 ± 259 3.444 ± 0.411 1,611 ± 362
SPEG 4,600 6.017 ± 0.368 4,621 ± 537 6.096 ± 0.349 4,736 ± 515
SPEG 8,000 8.086 ± 0.279 8,096 ± 532 7.974 ± 0.397 7,893 ± 747
[image:9.595.57.291.649.733.2]chromatography; SPEG: PEG samples were purchased from Sigma-Aldrich; TEM: Transmission electron microscope; UV–vis: Ultraviolet–visible;κ−1: Debye length;〈h2〉1/2: Root mean square end-to-end length.
Competing interest
The authors declare that they have no competing interests.
Authors’contributions
KL and HJ performed the experiments and analyzed the results. QZ conceived and designed the experiments, analyzed the results, and participated in writing the manuscript. All authors read and approved the final manuscript.
Authors’information
KL and HJ are Ph.D. holders, and QZ is a professor. All authors are from the Key Laboratory of Biomedical Material of Tianjin, Institute of Biomedical Engineering, Chinese Academy of Medical Sciences & Peking Union Medical College, Tianjin 300192, People's Republic of China.
Acknowledgements
We are grateful for the financial support of Major Research Plan of NSFC (90923042, 913231004), NSFC (31271023), and Graduate Innovation Fund of PUMC (2011-1001-024).
Received: 2 November 2013 Accepted: 5 December 2013 Published: 20 December 2013
References
1. Knop K, Hoogenboom R, Fischer D, Schubert US:Poly(ethylene glycol) in drug delivery: pros and cons as well as potential alternatives.
Angew Chem Int Ed2010,49:6288–6308.
2. Kou D, Manius G, Zhan S, Chokshi HP:Size exclusion chromatography with Corona charged aerosol detector for the analysis of polyethylene glycol polymer.J Chromatogr A2009,1216:5424–5428.
3. Daou TJ, Li L, Reiss P, Josserand V, Texier I:Effect of poly(ethylene glycol) length on the in vivo behavior of coated quantum dots.Langmuir2009, 25:3040–3044.
4. Kojima C, Regino C, Umeda Y, Kobayashi H, Kono K:Influence of dendrimer generation and polyethylene glycol length on the biodistribution of PEGylated dendrimers.Int J Pharm2010,383:293–296.
5. Bovey FA, Mirau PA:NMR of Polymers.San Diego: Academic Press; 1996. 6. Montaudo G, Montaudo MS, Puglisi C, Samperi F:Characterization of
polymers by matrix-assisted laser desorption ionization-time of flight mass spectrometry. End group determination and molecular weight estimates in poly(ethylene glycols).Macromolecules1995,28:4562–4569. 7. Daniel M-C, Astruc D:Gold nanoparticles: assembly, supramolecular
chemistry, quantum-size-related properties, and applications toward biology, catalysis, and nanotechnology.Chem Rev2004,104:293–346. 8. Rosi NL, Mirkin CA:Nanostructures in biodiagnostics.Chem Rev2005,
105:1547–1562.
9. Zhao W, Brook MA, Li Y:Design of gold nanoparticle-based colorimetric biosensing assays.ChemBioChem2008,9:2363–2371.
10. Hayat A:Colloidal Gold: Principles, Methods, and Applications.San Diego: Academic Press; 1989.
11. Horisberger M:Colloidal gold: a cytochemical marker for light and fluorescent microscopy and for transmission and scanning electron microscopy.Scanning Electron Microsc1981,Pt 2:9–31.
12. Heller W, Pugh TL:“Steric protection”of hydrophobic colloidal particles by adsorption of flexible macromolecules.J Chem Phys1954,22:1778. 13. Berg JC:An Introduction to Interfaces and Colloids: The Bridge to Nanoscience.
Hackensack: World Scientific; 2010.
14. Napper DH:Polymeric Stabilization of Colloidal Dispersions.San Diego: Academic Press; 1983.
15. Ratner BD, Hoffman AS:Non-fouling surfaces. InBiomaterials Science:
Introduction to Materials in Medicine.3rd edition. Edited by Ratner BD, Hoffman
AS, Schoen FJ, Lemons JE. San Diego: Academic Press; 2013:241–247. 16. McPherson TB, Lee SJ, Kinam P:Analysis of the prevention of protein
adsorption by steric repulsion theory. InProteins Interfaces II.Washington, DC: American Chemical Society; 1995:28–395.
17. Liu Y, Shipton MK, Ryan J, Kaufman ED, Franzen S, Feldheim DL:Synthesis, stability, and cellular internalization of gold nanoparticles containing
mixed peptide-poly(ethylene glycol) monolayers.Anal Chem2007, 79:2221–2229.
18. Stuart AC:Lecture Notes Colloid Science.Wageningen: Wageningen University; 2007.
19. Taton TA:Preparation of gold nanoparticle-DNA conjugates.Curr Protoc
Nucl Acids Chem2002,9:12.2.1–12.2.12.
20. Wang Y, Zhan L, Huang CZ:One-pot preparation of dextran-capped gold nanoparticles at room temperature and colorimetric detection of dihydralazine sulfate in uric samples.Anal Methods2010,2:1982–1988. 21. Ishikawa Y, Katoh Y, Ohshima H:Colloidal stability of aqueous polymeric
dispersions: effect of pH and salt concentration.Colloids Surf B2005, 42:53–58.
22. Lim JK, Majetich SA, Tilton RD:Stabilization of superparamagnetic iron oxide core-gold shell nanoparticles in high ionic strength media.
Langmuir2009,25:13384–13393.
23. Lee H, Venable RM, Mackerell AD, Pastor RW:Molecular dynamics studies of polyethylene oxide and polyethylene glycol: hydrodynamic radius and shape anisotropy.Biophys J2008,95:1590–1599.
24. Squire PG:Calculation of hydrodynamic parameters of random coil polymers from size exclusion chromatography and comparison with parameters by conventional methods.J Chromatogr A1981,210:433–442. 25. Devanand K, Selser JC:Asymptotic behavior and long-range interactions
in aqueous solutions of poly(ethylene oxide).Macromolecules1991, 24:5943–5947.
26. Doi M, Edwards SF:The Theory of Polymer Dynamics.Oxford: Clarendon Press; 1988.
27. Liu X, Atwater M, Wang J, Huo Q:Extinction coefficient of gold nanoparticles with different sizes and different capping ligands.Colloids
Surf B2007,58:3–7.
28. Ricker RD, Sandoval LA, Ricker RD, Sandoval LA:Fast, reproducible size-exclusion chromatography of biological macromolecules.J Chromatogr A
1996,743:43–50.
29. Jiang X, van der Horst A, van Steenbergen MJ, Akeroyd N, van Nostrum CF, Schoenmakers PJ, Hennink WE:Molar-mass characterization of cationic polymers for gene delivery by aqueous size-exclusion chromatography.
Pharm Res2006,23:595–603.
30. Genz U, D'Aguanno B, Mewis J, Klein R:Structure of sterically stabilized colloids.Langmuir1994,10:2206–2212.
31. Roucoux A, Schulz J, Patin H:Reduced transition metal colloids: a novel family of reusable catalysts?Chem Rev2002,102:3757–3778.
doi:10.1186/1556-276X-8-538
Cite this article as:Linget al.:A colorimetric method for the molecular
weight determination of polyethylene glycol using gold nanoparticles.
Nanoscale Research Letters20138:538.
Submit your manuscript to a
journal and benefi t from:
7 Convenient online submission
7 Rigorous peer review
7 Immediate publication on acceptance
7 Open access: articles freely available online
7 High visibility within the fi eld
7 Retaining the copyright to your article