Dependency Analysis using UML for Component-Based
Software Systems: An XMI Approach
Jawwad Wasat Shareef
Deptt.Of Maths.& Computer Science,
Rani Durgavati University
Jabalpur, India
Rajesh Kumar Pandey
University Institute of Computer
Science & Applications
Rani Durgavati University
Jabalpur, India
ABSTRACT
Component-based software development (CBSD) is an important area in the software engineering field. It has become one of the preferred streams for developing large and complex systems by integrating prefabricated software components which have not only made easier the process of software development but has also changed the ways for software professionals to develop software applications. A number of attempts have been made by software development teams, developers as well as researchers to improve component-based software development through improved measurement tools and techniques i.e. through an effective metrics. To manage and to study the different forms of dependencies that might occur in component based systems there has been little effort. The Component-based systems (CBS) are built up by integrating a number of these components in the system thus known as component assembly. In a CBS interaction can be in the form when one component interacts with another component, like one component provides an interface and other components use it, and also when an event is submitted by a component and it is received by other component. These interactions results in dependencies. Higher dependency has adverse effects thus leading to a complex system, resulting in poor understanding and higher maintenance cost. Dependency is represented in many forms one is by an adjacency matrix used in graph theory. However, this representation can check only for the presence of dependency between components and does not consider the type of interactions between these components. Interaction type can have a significant contribution to the complexity of the system. In this paper we present a technique in which component-based system is modeled using UML tool like ArgoUML 0.32, this tool is an open source and has the capability to export the component model in XMI (XML Meta-data Interchange) file format, this XMI file stores all the information related to a model, by applying parsing technique through a tool developed in Java, this technique can store the dependency along with other information like, provided interface (UML:Dependency.supplier) and required interface (UML:Dependency.client). This paper also presents the results of an experiment of the proposed approach and measures the interaction densities and dependency level of an individual component and for the system.
General Terms
Component-Based System, Unified Modeling Language.
Keywords
Component, Component-based system (CBS), Interaction, Dependency, Supplier, Unified Modeling Language (UML), XML Meta-data Interchange (XMI).
1.
INTRODUCTION
Components are developed by software developers, which use different methodologies for developing these components often in separate groups. The Component-based systems are built up by integrating a number of these components in the system thus known as component assembly. As the components are integrated in a system, more and more interaction between these components exists in the system. These interactions among the components happen through their interfaces known as provided or required interface. In other words, interaction happens when a component provides an interface and other component uses it, interaction may take place in the form of event also, when a component submits an event and other components receive it [1]. An interface information model specifies all of the operations and their associated constraints. It also assists in clarifying the definitions of component interactions [2]. Interaction among the components results in dependencies, the more the interaction among components; the system will be more complex which results in poor understanding and maintenance cost is also high. Integrating a component can affect the composite functionality of the system. Sometimes, a component fails to achieve its goal if the dependencies are not properly resolved, resulting in a system failure.
Dependency conflicts can be seen in operating systems where administrators do not monitor security announcements or they do not update their operating system kernels with appropriate security patches. Often, building and installing a new software package requires updates to a series of other components as well [3]. Researchers suggest that most faults are found due to the poor interactions among components. If we can identify these possible faults early at specification, then precautionary actions can avoid the likely failure causes and costly maintenance [4].
on updating a component, which other components that are dependent in the system are affected? This will help in predicting the efforts required for maintainability. in a system if a new component is installed, it might
require the services of other components, what effect it will make on the system?
in a system consisting of number of components which components play an important role and are critical than others? Which components are cut off from others? in case when system failure occurs what is the minimal
set of components in the system that must be inspected? is there any difference between two configurations?
To address the above issues, it is important that dependencies among components should be represented by an efficient and effective manner, which can retrieve the information in a faster way.
2.
DEPENDENCY
What is Dependency? Whenever a component A uses another component or interface B, then A depends on B. Component A cannot perform its task without B, and A cannot be reused without also reusing B. In such a situation the component A is called the "dependant" and the component or interface B is called the "dependency". A dependant depends on its dependencies [7].
Two components that use each other are called "coupled". The coupling between components can be loose or tight, or somewhere in between. The tightness of a coupling is not binary. It is not either "loose" or "tight". The degrees of tightness are continuous, not discrete. Dependencies can also characterize as "strong" or "weak". A tight coupling leads to strong dependencies, and a loose coupling leads to weak dependencies, or even no dependencies in some situations. Dependencies, or couplings, are directional. That A depends on B doesn't mean that B also depends on A.
Efficient system functioning is provided by components through interacting, cooperating and coordinating with other components, which results in the form of dependencies among components. Complex system functionality is usually provided by a group of components which depends on the interaction of these components with each other. The composite functionality also changes when a modification to a component takes place, because different components in a system reflect composite functionality. Dependency among components changes when the replacement or updating of a new version component takes place [8].
Dependency may be defined as [9] (Lisa and Delugach, 2001):
Dependency is a relationship involving two or more components, where a change of state in one or more component leads to a potential for a change of state in one or more other components.
In the simplest case of dependency, a unidirectional dependency between two entities, d(A, B), implies that A depends upon B. If A depends upon B, then a change in B implies a potential or possible change in A. A is referred as dependent and B as the antecedent [10].
3.
DEPENDENCY ANALYSIS AND
COMPONENT-BASED SYSTEM
Dependency analysis involves the task of identifying the interdependent components of a system. In component based systems, components communicate and share information in order to provide system functionalities. Components are regularly composed for the purpose of offering more abstract services in a system. This composition creates interaction that promotes dependencies among components. Replacing a new version of a specific component or updating might involve replacing the component(s) on which it depends, in order to preserve a specific system’s functionality. The key point to analyze those aspects is the knowledge about possible component relations and dependencies among them [11].4.
DEPENDENCY REPRESENTATION
TECHNIQUES
Dependency among components can be determined by using concept of graph theory. In order to determine whether the components are dependent or not, this can be represented using a graph with a matrix or adjacency lists, so that dependencies among components can be tracked and stored for further processing. This approach helps in analyzing what has been affected in the system and to create determinism when updating the system with new components [12].
Dependency among components proposed by [13], represented by a graph G where G=(N, E) is a directed graph which has a finite set of vertices N (called components) and E the set of dependencies (path) between components. An adjacent matrix AMn*nmay be used to represent the directed
graph, where
AM[I,j] = 1, if component Ci is directly connected with Cj,
0, if component Ci is not directly connected with Cj,
d11 d12 d13 … d1n
d21 d22 d23 … d2n
= …. ….. (1)
….
dn1 dn2 dn3 … dnn
where dij (ij = 1, n) is the (i, j)th state with value 1, if jth
component is dependent on ith component, otherwise 0.
For example, dependencies in a component-based system modeled in ArgoUML 0.32 consisting of five components, namely, C1, C2, C3, C4 and C5(shown in Fig.-2) can be represented by the matrix as:
C1 C2 C3 C4 C5 C1 0 1 0 0 0 C2 0 0 0 1 0
C5 0 0 0 1 0
From this representation, the dependencies among components may be computed. Dependency of a component Ci to other components is the number of all paths in the graph from Cito other component.
Di (Dependency of Ci) = Sum of all paths (i to j) (3)
wherej=1 to n and Path (i,j) is the total number of paths from component Cito Cj.
The dependency graph, which is represented by a matrix, can easily be used to determine what has been affected when a new version of a component is installed.
Component dependency for CBS proposed by [11] used adjacency matrix representation and introduced a set of component-based metrics, namely, Component Dependency Metric (CDM) and Component Interaction Density Metric (CIDM), which measure the dependency and coupling aspects for the software components respectively. The work concludes that higher interactions among components increase the complexity because of more coupling among components. Higher complexity means more expensive and less maintainable software. The work uses graph theory based notations and adjacency matrix to show dependency. However, this approach only considers the presence of interactions (1 or 0) and does not consider the type of interaction while measuring the complexity.
Narasimhan and Hendradjaya, (2004) proposed a suite of static and dynamic metrics to measure complexity and criticality for the integration of software components. Static metrics covered the complexity and the criticality within an integrated component and is intended to be used early during the design stage. The complexity metrics consist of Component Packing Density (CPD) metrics and Component Average Interaction Density (CAID) metrics. CPD metrics is defined as the form of a ratio of constituent to the number of components. It is used to identify the density of integrated components. The formula is:
components
t
constituen
CPD
constituent type#
#
_
where #<constituent> is the number of lines of code, operations, classes, and/or modules in the related components. The number of constituent depends on the information that might come from the definition of component. This is related to the information on the number of classes, number of lines of code (LOC), number of modules, or number of operations for each component. Interaction Density Metrics measures the interaction happens at one component’s interface or through consuming other component’s events. It also happens when a component submits an event and other components receive it, while interaction densities are measured by dividing the actual incoming interactions to the total number of incoming interactions and similarly dividing the actual outgoing interactions to the total number of outgoing interactions.
Continually as an extension of [14] (Narasimhan et al. 2006), in (Narasimhan et al. 2007) [15], the authors detailed illustrate
the static and dynamic metrics proposed in (Narasimhan et al. 2006) [14] and validated these metrics by using Weyuker’s properties. Most of these metrics fulfill the Weyuker’s property criteria. Also the authors checked the impact of these metrics in the context of McCall’s Quality Model. Therefore, it concluded that these metrics can help component-based developers to identify complexity and criticality in an integrated system. Based on above metrics, the authors deduced results as shown in Table1.
Table1: Density Metrics
CPD CAID Result
Low Low Low data processing and low computation (Simple transaction systems)
High Low High volume of data with many components (Compute -intensive real timesystems)
High Low High volume of data with many components but with low interaction among components (Transaction processing systems)
Kharb and Singh (2008) [16] adopted a similar approach. Authors proposed several interaction metrics for component-based systems to finally measure the complexity of the system. These metrics are based on actual and total number of incoming and outgoing interactions among the components. However, these metrics are just proposed theoretically, without any correlation with any quality characteristic, with no evaluation and validation on real-life applications. Boxall and Araban (2004) [17] define Interface Textual Complexity Metrics through a set of mathematical expressions. These metrics considers various measuring aspects of component’s interfaces, such as interface size, number of distinct arguments in operations, level of repetition of such arguments, the commonality in identifiers, identifier’s length and the density of reference arguments. The proposed metric gives a very rich analysis for the arguments used, however it considers all the arguments of same type and does not differentiate them on the basis of their type and complexity involved in that argument due to its data type.
5.
PROPOSED
COMPONENT
DEPENDENCY REPRESENTATION
USING XMI FILE
The main idea of this approach is to provide mechanisms for: Describing dependencies of an individual component
with the overall system and
Analyzing the influence of such dependencies in terms of type of interactions, dependent components in a CBS in which the component is assembled, by extracting the information through XMI file, generated through design documents like UML tool (AgroUML 0.32) at early stage.
In the proposed representation, each component has a list of components which are dependent on it. The length of a dependency list gives the number of dependent components and can be used as a measurement of dependency complexity. The higher the number, the more complex is the relation with other components.
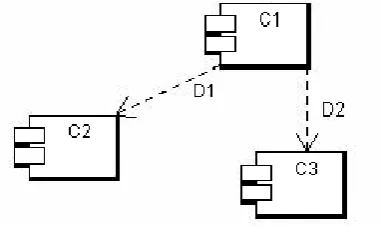
Consider a simple case involving two components C1and C2.
C2 requires some functionality from component C1. Therefore
C2is dependent on C1.
This can be represented by using design tool like ArgoUML as follows:
In this approach components are first design using an open source design tool ArgoUML, this tool has the ability to store its model data in XMI 1.2. As a variant of XML, XMI is amenable to automatic processing; using a variety of parsers, and XMI documents can be transformed to other XML formats. However, extracting metrics from XMI does provide a mechanism for design evaluation at an early stage in the development lifecycle, as well as source code language independence (to some extent) [19].
Using ArgoUML design tool, components are then selected to design the system, where they are integrated and then XMI 1.2 file is generated, by parsing the XMI file the dependency level of components and information about components dependent on other components and their interaction density can be obtained. This will result in better understanding of the system and will decrease the overall maintenance efforts and problems that are likely to occur at later stages of software development.
5.1
Implementation of the Proposed
Methodology
For the above representation after the system has been designed using ArgoUML tool, creating component artifacts through Collaboration diagram option, as shown in Figure2, the XMI 1.2 file is generated with the help of Export XMI option (ArgoUML using Netbeans XMI Writer version 1.0), as shown in Annexure-1, which is then parsed for extracting information regarding dependency of components using a Java based Netbeans software tool. The parser parses the XMI file, which stores each and even small to small information related to UML model. The XMI file contains information about all the components integrated into the system, it is the only open source tool that assigns a unique XMI identifiers (UUIDs) to flag user-designed model components. Therefore, only in the case of analyzing ArgoUMLderived XMI was it possible to extract information of interest. Figure1 shows the data-flow through the various stages of the application. XMI input derived from UML models created by software design tools is transformed as follows:
UML model to XMI file generated XMI input to parser
[image:4.595.57.248.426.542.2] Different status of Components related to dependency output using Netbeans software tool.
Figure 1: Data flow through various stages of application
5.2
XMI Representation of UML
Component Diagrams
Figure2: Annotated XMI representation of a Component Dependency Diagram diagram
Components ‘C1’ and ‘C2’ are as shown in Figure2, Component C1 is identified by a unique xmi.id (0866) and C2 (0867). Component C1 is dependency client dependent on C2, component C2 is the dependency supplier, both are recorded by referenced xmi.idref values. Each participating element also records the relationship. The Dependency D1 which is for
component C1 is referenced as
<UML:ModelElement.clientDependency> with a <UML:Dependencyxmi.idref> values.
5.3
Interaction Metrics for
Component-Based Systems
Various interaction complexity measures for the component-based systems in the form of metrics are summarized below:
a) For Individual Component
Based on the proposed methodology, incoming and outgoing interaction density can be measured for a component. The dependent components on a parent component can also be identified. Interaction densities may be used to measure the integration efforts for the system.
i) Incoming Interaction Density
Incoming Interaction Density (required interface) (IID) for a component C can be measured as the ratio of Used Incoming Interactions (UML:Dependency.client) UII (C) to the Available Incoming Interactions (sum of UML:Dependency.client for component C) AII (C). AII (C) and UII (C) can be measured as:
AII (C)=Sum of all provided services of Parent Components of C (sum of UML:Dependency.client for component C)
UII (C) = Sum of all required services for Component C (number of UML:Dependency.clientfor component C)
Therefore,
𝐼𝐼𝐷 𝐶 = 𝑈𝐼𝐼(𝐶)𝐴𝐼𝐼(𝐶)
(4)
IID may be used to measure the integration efforts for that individual component. Higher value of IID results in complex integration efforts, which will increase the maintenance efforts.
ii) Outgoing Interaction Density
Outgoing Interaction Density (provided interface) (OID) for a component C can be measured as the ratio of
Used Outgoing Interactions
(UML:Dependency.supplier) UOI (C) to the Available
Outgoing Interactions (sum of
UML:Dependency.supplier for component C) AOI (C).
AOI (C) and UOI (C) can be measured as:
AOI (C) = Sum of all provided services of Component C (sum of UML:Dependency.supplier for component C)
UOI (C) = Sum of required services of child Components of C
(number of UML:Dependency.supplier)
Therefore,
O𝐼𝐷 𝐶 = 𝑈𝑂𝐼 (𝐶)
𝐴𝑂𝐼 (𝐶)
(5)
OID may be used as a measure of usability of component in the system. Higher value of this metric result in higher possibility of using this component by other child components, which is an indication of high dependability of this component within the system. Also, it may be used for measuring the service utilization. If all the provided interfaces of a component are utilized by other dependent components then it may be termed as efficient component in terms of service utilization. On the other hand, if some of the provided interfaces are not used by any of the dependent components; it means that the functionality provided by the component is not fully utilized by other components [18] (Sharma et. al., 2009).
iii) Dependency Level
Dependency level (DL) of a component is the sum of all the child components of C, which can be determined through XMI as the sum of (UML:Dependencyxmi.idref) for that component.
DL (C) = Sum of child components of C (6)
(Sum of UML:Dependencyxmi.idref)
This measure can be used to identify the critical components and isolated components in the system. Highest value of DL will be referred as the most critical component of the system. Any change in this component may require several possible changes in other dependent components also. On the other hand, 0 dependency level for a component means an isolated or independent component. It can accommodate any change without affecting other components of the system [18] (Sharma et. al., 2009).
b) For the System
Sum of Incoming interactions for all components
(sum of UML:Dependency.supplier for component C)
IID(S)= --- (7)
Number of Components
(sum of UML:Component xmi.id)
Similarly, Outgoing Interaction Density for the system S, OID (S) may be defined as
Sum of Outgoing interactions for all components
(sum of UML:Dependency.client for component C)
OID(S)= --- (8)
Number of Components
(sum of UML:Component xmi.id)
Also, Average Interaction Density (AID) for the system S may be defined as:
Sum of Interactions for all components
sum of (UML:Dependency.client + UML:Dependency.supplier) AID(S)= --- (9)
Number of Components
(sum of UML:Component xmi.id)
These measures can be used to measure the interaction complexity of the system, which may be a measure of integration efforts for the system.
5.4
Experimentation
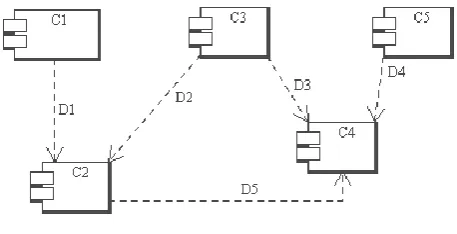
A simple component based system is shown in Figure3, here components are drawn in ArgoUML 0.32 modeling tool, after which XMI version 1.2 file is exported as shown in Annexure-1, this XMI file is parsed for extracting nodes, for which the pseudo-code is given in Table-4. In Figure 3 the above discussed concepts and measures are applied. There are total five components named C1, C2, C3, C4, and C5 in the system, some of these components are dependent on the other components and are denoted by dependencies D1, D2, D3, D4, D5.
The XMI file contains information of all components by assigning a unique (UML:Component xmi.id) to each component. The component provided interface (outbound) interactions for its client is assigned by (UML:Dependency.client) by assigning a unique (UML:Componentxmi.idref) to each component, similarly required interface (inbound) interactions are assigned as (UML:Dependency.supplier) in the system. The XMI file parsing approach for extracting information related to component dependency is better than other approaches because by using the parser a large XMI file can be parsed in a short time providing accurate information about artifacts and dependency among components. The components for which the interactions are to be used are parsed by their unique-id (xmi.idref). Pseudo-code for parsing the XMI file for client and supplier is given in Table-4, which has been implemented in Java using Netbeans 6.8.
As per Figure3 some components are having incoming interactions, referred as (UML:Dependency.supplier) and some are having outgoing interactions, referred as (UML:Dependency.client). For example component C1 is dependent on C2 which is shown by D1 as dependency (UML:Dependency) and is characterize by a unique identifier (UML:Dependency xmi.id). Component C3 is dependent on
[image:6.595.318.547.167.284.2]two components C2 and C4, shown by (UML:Dependency.client) D2 and D3. Similarly component C5 is dependent on component C4. Component C2 has two (UML:Dependency.supplier) component C1 and C3, through dependency D1 and D2 and one (UML:Dependency.client) shown by dependency D5, (UML:Dependency.supplier) is component C4.
Figure 3: CBS modeled in ArgoUMLhaving five Components C1, C2, C3, C4, C5 and dependency D1, D2,
D3, D4, D5.
To find out the inbound and outbound interactions, a method is proposed used for parsing the XMI file. The description of the code is as follows:
(i) The code given in Table2 is an XMI 1.2 file Exported from Figure-3, using ArgoUML 0.32. The XMI contents show dependency D1 (86B) between component C1 (866) and C2 (867).
(ii) The code given in Table3 shows how the information about dependencies and supplier are included in XMI file. This code basically contains the client means the xmi.id of the component which is having dependency on another component.
(iii) The code given in Table4, basically contains the supplier means the xmi.id of the component which is supplier for a dependency given by other component
5.5
Implementation of Pseudo-code for
Extraction of Dependency between
components
Table 2: XMI File showing Dependency D1 between components
Table 3: XMI File showing Dependency and Supplier
Table 4: XMI File showing Supplier (Provided Interface)
<
UML:Dependency.supplier
>
<
UML:Component
xmi.idref
='127-0-0-1-5354896a:13451187756:-8000:0000000000000869'/>
</
UML:Dependency.supplier
>
<UML:Dependency
xmi.id='127-0-0-1-5354896a:13451187756:-8000:000000000000086B' name='D1' isSpecification='false'>
<UML:Dependency.client>
<UML:Component
xmi.idref='127-0-0-1-5354896a:13451187756:-8000:0000000000000866'/>
</UML:Dependency.client>
<UML:Dependency.supplier>
<UML:Component
xmi.idref='127-0-0-1-5354896a:13451187756:-8000:0000000000000867'/>
</UML:Dependency.supplier>
</
UML:Dependency
>
<
UML:Dependency
xmi.id
='127-0-0-1-5354896a:13451187756:-8000:000000000000086C'
name
='D2'
isSpecification
='false'>
<
UML:Dependency.client
>
<
UML:Component
xmi.idref
='127-0-0-1-5354896a:13451187756:-8000:0000000000000868'/>
</
UML:Dependency.client
>
<
UML:Dependency.supplier
>
<
UML:Component
xmi.idref
='127-0-0-1-5354896a:13451187756:-8000:0000000000000867'/>
</
UML:Dependency.supplier
>
Table5: Pseudo code for parsing the XMI file detecting dependency between components in Java using Netbeans 6.8
The Pseudo-code in Table5 when executed collects the information about Dependency related to client and supplier and stores the information in a 2-dimensional String array umlDepd[countDepd][0] = xmi.id (client) and umlDepd[countDepd][1] = xmi.id (supplier). Similarly using a separate array, we can find components name along with their Dependency information.
The XMI file with the help of pseudo-code given in Table5, is parsed to extract the given metrics discussed above. This will help in analyzing the dependency levels (DL) and the dependent components for a particular component. This may also be used to analyze the impact of change on all components which are dependent on changed/replaced
component. The values of various measures extracted for these components are shown in Table6.
By parsing the XMI file, the incoming interactions (UML:Dependency) and outgoing interactions (UML:Supplier) are calculated by using a pseudo-code developed in Java, a two dimensional array is declared in which the incoming interactions and outgoing interactions are stored and counted by using a counter, with the help of this pseudo-code and as per Figure1 from which XMI file is generated, the dependency level (DL) and the dependent components for a particular component can be analyzed. The values of various measures for these components are as shown in Table 6.
public void addDepSuppInfo() {
for (cnt = 0; cnt<nTextLines; cnt++) {
if (textToDisplay[cnt].trim().length() >= 26) {
String checkS = textToDisplay[cnt].trim().substring(0, 22);
if (checkS.contains("<UML:Dependency xmi.id")) {
cnt++;
if (textToDisplay[cnt].trim().length() >= 18) {
while (!(textToDisplay[cnt].trim().startsWith("</UML:Dependency>"))) {
if (textToDisplay[cnt].trim().startsWith("<UML:Dependency.client>")) {
cnt++;
String umlD =
textToDisplay[cnt].trim().substring(26,textToDisplay[cnt].trim().length() -
2);
umlDepd[countDepd][0] = umlD;
cnt++;
if (textToDisplay[cnt].trim().startsWith("<UML:Dependency.supplier>")) {
cnt++;
String umlD = textToDisplay[cnt].trim().substring(26,
textToDisplay[cnt].trim().length() - 2);
umlDepd[countDepd][1] = umlD;
countDepd++;
}
}
}
}
}
}
}
Table6: Dependency metrics values calculated from XMI file
Component
UML:Component xmi.id=Dependency
Supplier
UML:Dependency(arrow)
UML:Dependency.Supplier(Incoming) UML:Dependency.client(Outgoing)
IIC
UML:Dependency.client
OIC
UML:Dependency.supplierDL
C1
xmi.id=0866
D1
xmi.id=086B
no incoming(no client) xmi.id=867 (C2)
0
1
1
C2
xmi.id=0867
D5
xmi.id=086B; 86C xmi.id=866; 868 xmi.id=869
2
1
1
C3
xmi.id=0868
D2, D3
xmi.id=086C; 86D no incoming (no client) xmi.id=867 (C2);869 (C4)
0
1
2
C4
xmi.id=0869
D3, D4, D5
xmi.id=086D; 86E; 86F xmi.id= 868; 86A not a supplier
3
0
0
C5
xmi.id=086A
D4
xmi.id= 86E
no incoming(no client) xmi.id=869 (C4)
0
1
1
Here based on the measurements given in Table 6 following predictions can be made—
1. Component C4 is having the highest (IIC), which means that integration efforts for using this component will be more than other components in the system.
2. The most critical component is C3, which has dependency level 2 and has two child components C2 and C4. If a change is done to component C3 than accordingly corresponding change has to be done to both components.
3. Components C2, C3, C5 are fully utilized by their respective child components.
4.
Dependency level of C4 is minimum i.e., 0, thus if any changes are done in component C4, it will not affect other components.6.
CONCLUSION
The present work proposes a UML based approach where design artifacts like components can be modeled to design component based systems using open source design tools like ArgoUML to represent dependency among components. This approach is more efficient than matrix based approach or Link List based as it can parse the XMI file faster and efficiently and the metrics can be derived at early stage of system development. This approach is expected to give faster searches for the components, which are dependent on other components. In this paper different metrics related with interactions among components are discussed and Pseudo-code has been developed in Java using Netbeans for parsing the XMI file to trace the incoming and outgoing interactions. The information may be used to analyze several interaction and dependency related issues with the proposed approach. The information may be used to measure the interaction complexity of the system.
7.
REFERENCES
[1] Narasimhan, V. L. and Hendradjaya, B., 2004. A New Suite of Metrics for the Integration of Software Components, 1st International Workshop on Object Systems and Software Architectures (WOSSA'2004), S. Australia, Australia, pp: 34 -39.
[2] Liu Y, Cunningham HC., 2004. Mapping component specifications to Enterprise JavaBeans implementations.Proceedings of the 42nd Annual Southeast Regional Conference, 2004. ACM Press: New York,; 177–182.
[3] Kon, F., Campbell, R. H., 2000. Dependence Management in Component-based Distributed Systems, IEEE Concurrency, Vol. 8, Issue 1, pp: 26-36.
[4] Mahmood, S., Lai, R., 2005. Measuring the Complexity of a UML Component Specification, Proceedings of Fifth International Conference on Quality Software (QSIC 2005), pp: 150-157.
[5] Vieira, M., Richardson, D. J., 2002. Analyzing Dependencies in Large Component-Based Systems, Proceedings of the 17th IEEE International Conference on Automated Software Engineering, Edinburgh, UK, pp: 241 -246.
[7] http://tutorials.jenkov.com/ood/understanding-dependencies.html, last access: 12-02-2012
[8] Li, B., 2003. Managing Dependencies in Component -Based Systems -Based on Matrix Model, Proceedings of Net Object. Days, Erfurt, Germany, pp: 22 -25.
[9] Lisa, C., Delugach, H. S., 2001. Dependency Analysis Using Conceptual Graphs, In Proceedings of the 9th International Conference on Conceptual Structures, ICCS 92001, pp: 117-130.
[10] Keller, A., Blumenthal, U., Kar, G., 2000. Classification and Computation of Dependencies for Distributed Management, Proceedings of the 5th International Conference on Computers and Communications (ISCC 2000), pp: 78-84.
[11] Gill, N. S., Balkishan, 2008. Dependency and Interaction Oriented Complexity Metrics of Component-Based Systems, ACM SIGSOFT Software Engineering Notes Vol. 33 Issue 2, pp: 1-5.
[12] Larsson, M., 2007. Applying Configuration Management Techniques to Component - Based System, MRTC Report, IT Licentiate thesis, 2000 -07, Uppsala University.
[13] Stafford, J. A., Alexandar, L. W., Caporuscio, M., 2003. The Application of Dependence Analysis to Software Architecture Descriptions, Lecture Notes in Computer Science, Vol. 2804, pp: 52-62.
[14] Narasimhan, V. L. and Hendradjaya, B., 2005. Theoretical Considerations for Software Component
Metrics. World Academy of Science, Engineering and Technology, 10, pp: 169-174.
[15] Narasimhan, V. L. and Hendradjaya, B., 2006. Some theoretical considerations for a suite of metrics for the integration of software components.ScienceDirect, Elsevier, 177, pp: 844-864.
[16] Kharb, L., Singh, R., 2008. Complexity Metrics for Component -Oriented Software Systems, ACM SIGSOFT Software Engineering Notes, Vol. 33, Issue 2, pp: 1-3.
[17] Boxall, M. A. S., Araban, S., 2004. Interface Metrics for Reusability Analysis of Components, Proceedings of. Australian Software Engineering Conference (ASWEC'2004), Melbourne, Australia, pp: 40 -46. [18] Arun Sharma, Rajesh Kumar, P. S. Grover, Dependency
Analysis for Component-Based Software Systems, accepted for publication in ACM SIGSOFT Software Engineering Notes, Vol. 34, Issue 4, July 2009, pp: 1-8. [19] T. Paterson: Object-Oriented Software Design Metrics
from XMI, M.Sc. Dissertation, Heriot-Watt University, 2002.
[20] Virol, C., 2005. Error Propagation Metrics from XMI, M.Sc., Lane Department of Computer Science & Electrical Engineering Morgantown, West Virginia University,https://eidr.wvu.edu